



Abstract
A variety of macromolecules accumulate in the glomerular mesangium in many different diseases, but the physics of the transport of these molecules within the mesangial matrix has not been extensively studied. We present a computational model of convection and diffusion within the porous mesangial matrix and apply this model to the specific instance of immunoglobulin A (IgA) transport in IgA nephropathy. We examine the influence of physiological factors including glomerular basement membrane (GBM) thickness and mesangial matrix density on the total accumulation of IgA. Our results suggest that IgA accumulation can be understood by relating convection and diffusion, thus demonstrating the importance of intrinsic glomerular factors.
Keywords: convection, diffusion, IgA nephropathy, glomerulus, mesangial cells, IgA, mesangium
the mesangium is the cell-populated matrix that serves as the seal holding together glomerular capillaries. Although it has a relatively small direct contribution to the glomerular filtration process, the mesangium is nevertheless a critical component of the filtration apparatus, as demonstrated by renal failure under conditions that jeopardize mesangial function (24, 44, 13, 15). In addition, one early indication of many kidney diseases is mesangial hypertrophy and proliferation, and mesangial cells respond quickly to injuries, even those whose primary targets are endothelial cells or podocytes (28, 62, 36). Taken together, all of this evidence indicates that mesangial cells must be in mechanical and/or biochemical communication with other glomerular cell types and may even communicate with extraglomerular cells. The importance of mesangial transport is further emphasized by the accumulation of tracer particles in the mesangial space (9) and by the pathological accumulation of immunoglobulin A (IgA) characteristic of IgA nephropathy (64). In spite of the importance of mesangial transport, it has received relatively little theoretical analysis.
Filtration through the glomerular capillary wall, in contrast, has been well studied both in vivo and computationally. The ability to measure glomerular filtration rate either for the whole subject (56) or in a single nephron (12) has allowed characterization of the filtration process under many different conditions. The work of Deen and colleagues (17, 47, 21) has afforded major theoretical insights into aspects of transport across the glomerular capillary wall. Since a vast majority of the plasma filtration occurs through the capillary wall rather than through the mesangium, these studies have provided little information about mesangial transport, but they have helped to create an accurate vision of the glomerular capillary milieu.
Our broad interest is in the role of the mesangium in health and disease. We would like to understand 1) how mesangial transport facilitates communication between the capillary cells and the mesangial cells, and 2) how transport of specific molecules within the mesangium contributes to function or dysfunction of the tissue. Plasma flow into the mesangium has been previously established (41–43), and we are interested in the movement of biomolecules within that flow. The objectives of the current study were 1) to develop a computational model of plasma and species transport within the mesangium, and 2) to apply that model to the question of how different factors contribute to the mesangial accumulation of IgA in IgA nephropathy. IgA nephropathy may be considered archetypal; the disease, which has been associated with a number of different contributory/causative factors (1, 3, 29, 35, 44, 45, 64), hinges upon aberrant biodistribution, with the defining symptom being accumulation of IgA in the mesangium. The key result of our analysis is the recognition that IgA nephropathy may be considered in terms of the transport of IgA, whereupon many disparate physiological states can be attributed to changes in the Péclet number governing the relative effects of convective transport in flow to diffusion of IgA.
MATERIALS AND METHODS
Species transport in the mesangium is governed by convection due to plasma flow, diffusion due to chemical gradients, and reaction with other extracellular components and/or removal by the cells. For the present model, only convection and diffusion were considered. Importantly, the plasma flow rate depends not only on the mechanical pressure but also on the oncotic pressure, which in turn is determined largely by the albumin concentration (48). As a result, our model had three components: plasma flow, albumin transport, and IgA transport. The three components are described below.
Plasma flow model.
Plasma flows through the mesangial matrix and composite perimesangial filtration barrier (PFB), which represents the composite resistance from the glomerular basement membrane and the podocyte layer. The average pore size in the mesangium is ≈20 nm (41), forcing a low flow rate where inertial effects are negligible. Furthermore, since the pore size is very small compared with mesangial dimensions of 1–3 mm (32, 52), the problem may be further simplified to Darcy flow, governed by:
| (1) |
| (2) |
Here, v is the superficial velocity, KD,mes is the hydraulic conductivity of the mesangium, and p is the local pressure. The Darcy model has been used to describe interstitial flow in many tissues (39, 58, 19, 51, 8).
Hydraulic conductivities for the mesangial matrix and filtration barrier were calculated as KD = κ/μ, where μ is the viscosity of plasma and κ is the tissue's Darcy permeability. Two different permeabilities were used, one for the mesangium to calculate KD,mes, and one representing the resistance of the PFB to calculate KD,PFB, the perimesangial filtration barrier hydraulic conductivity. Permeability was calculated from fiber radius (r) and fiber volume fraction (ϕ) (10):
| (3) |
Boundary conditions on Eq. 1 were (see Fig. 1):
Fig. 1.
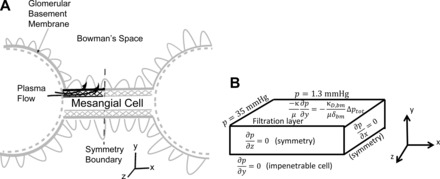
A: A sketch of glomerular capillaries with the adjacent mesangium. The simulation region is highlighted by dark black lines. The glomerular capillary was considered as a boundary condition. Only the mesangial matrix domain is shown in the figures. The perimesangial filtration barrier (PFB) was considered as the combination of the glomerular basement membrane and the podocytes. B: sketch of the simulation domain showing the pressure boundary conditions.
1) The pressure in the capillary was defined to be the baseline pressure and set to 35 mmHg.
2) The hydrostatic pressure in Bowman's space was set to 1.3 mmHg (i.e., 33.7 mmHg below the average glomerular capillary pressure). At the filtration barrier boundary, the plasma flux was determined by the combination of oncotic and hydrostatic pressure (19).
| (4) |
Here, is the surface normal, is the velocity, δPFB is the filtration barrier thickness, KD,PFB is the hydraulic conductivity of the filtration barrier, p is the hydrostatic pressure in the mesangium, and pext is the hydrostatic pressure in the Bowman's space. KD,PFB was calculated using Eq. 3, with values of r (2 Å) and ϕ (0.3) chosen to achieve reasonable mesangial flux rates [mesangial flux can only be a small fraction of single nephron glomerular filtration rate (SNGFR); Ref. 38].
3) Albumin in the filtering plasma increases the fluid's oncotic pressure relative to Bowman's space, as it is well known to do in the glomerular capillary (17). The oncotic pressure was calculated from the local concentration of albumin, calb using an approximation to the Landis-Pappenheimer equation (46).
| (5) |
Here calb is the concentration of albumin and a1 and a2 are constants (listed in Table 1). Because our model requires a diffusion coefficient that depends on size, albumin was used instead of total protein concentration in the osmotic pressure calculation. The albumin concentration (4 g/100 ml) is much higher than the IgA concentration in the plasma (0.2 g/100 ml), so IgA did not contribute to the oncotic pressure in most simulations. In cases with large accumulation of IgA, however, IgA concentrations can become significant.
Table 1.
Constants used in the model
| Parameter | Meaning | Value |
|---|---|---|
| μ | Plasma viscosity | 7 × 10⁻⁴ (Pa·s) (63) |
| a1 | Osmotic pressure coefficient | 1.63 mmHg/(g/dl) (46) |
| a2 | Osmotic pressure coeffcient | 0.294 mmHg/(g/dl)2 (46) |
Numbers in parentheses are references.
4) All other boundaries had zero flux, representing either a symmetry condition or an impermeable barrier. The symmetry condition on the right hand boundary (Fig. 1B) represents the case where a second capillary is connected to the mesangial region. We assumed the mesangial cell was impermeable to flow, leading to a no flux condition on the bottom boundary.
Albumin transport model.
Albumin movement within the mesangium is modeled by the convection-diffusion equation, which describes the movement of molecules in a flow field,
| (6) |
The albumin transport model is coupled to the plasma flow model because the flow field depends on the albumin concentration through Eq. 5, and albumin concentration depends on the flow field through Eq. 6. Therefore, these equations had to be solved simultaneously. In Eq. 6, is the velocity obtained from Eqs. 1 and 2 and is the diffusion coefficient of albumin in the mesangial matrix, and it was assumed that there was negligible hindrance of albumin convection through the matrix. We calculated diffusion coefficients based on the size of the albumin molecule, and the pore size and fiber thickness of the mesangial matrix, using established models of diffusion through porous fibrous matrices (Eq. 7) (2).
| (7) |
| (8) |
Here, is the free diffusion coefficient for the molecule, ϕ is the volume fraction occupied by the fibers, and λ is the ratio of the molecule radius (a) to radius of the fibers in the matrix.
The boundary conditions for albumin transport were as follows:
1) The albumin concentration was constant at 4 g/100 ml (6) in the capillary (Fig. 2).
Fig. 2.
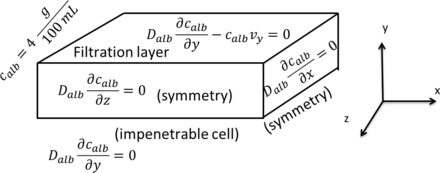
Albumin boundary conditions showing capillary concentrations on the left, with symmetry conditions on the right as well as front and rear faces. Albumin flux across the top (PFB) is defined to be zero.
2) The basement membrane was assumed to be a perfect filter, so the total flux across the filtration barrier was zero. In this case, v ≠ 0 because water exits the mesangial matrix across the filtration barrier. Thus the boundary condition was
| (9) |
3) All other surfaces have symmetry boundaries, so the total flux is zero on those as well. In this case, however, there is zero velocity as well (v = 0), as described above, so
| (10) |
IgA transport model.
The convection-diffusion equation also describes the movement of IgA complexes.
| (11) |
Diffusion coefficients were calculated using the diameter of monomeric and dimeric IgA, in fiber matrices with varying fiber thicknesses and fiber volume fractions. Because IgA is several times larger than albumin, its diffusion coefficient is significantly smaller. The boundary conditions for IgA transport were:
1) Constant concentration in the capillary of 0.2 g/100 ml (27).
2) No flux from all other surfaces, noting as in the case of albumin that the plasma velocity is zero at the impenetrable surfaces but not zero at the filtration boundary.
Implementation.
A standard Galerkin finite element simulation was developed in Matlab and used to solve all equations. Linear basis functions were used on a 25,000 element mesh that was generated with rectangular brick elements, with a spacing of 0.1 µm into the depth of the mesangium, 0.01 µm along the height of the mesangium, and 1 µm along the length of the glomerular capillary. Each element had eight Gauss points, and the dimensions of the entire mesangial matrix region (Fig. 1) were 5 × 0.5 × 10 µm. A segregated solving scheme was used that first solved the Darcy flow problem, assuming zero concentrations for albumin, to output a pressure field. That pressure field was then used to calculate a velocity input to the convection-diffusion equation. This resulted in a new concentration distribution for albumin and IgA, and this concentration distribution was used to calculate an osmotic pressure. The osmotic pressure was fed back to the Darcy solver in the boundary condition, and the process iterated until the pressure solution stopped changing within a tolerance of 0.001 Pascals. The results of this process were pressure at each node and the concentrations of albumin and IgA at each node. Simulations were run on computers at the Minnesota Supercomputing Institute (MSI) on four processors. The problem was solved in three dimensions but with no variation in the third direction, so concentration and velocity profiles are shown in two dimensions.
Case studies.
Our reference case was normal glomerular capillary blood pressure (35 mmHg; Ref. 27), basement membrane thickness (δbm = 0.4 µm; Ref. 40), basement membrane fiber radius of 2.0 Å and basement membrane volume fraction of 0.3, and IgA concentration of 0.2 g/100 ml (27). From this case, we examined the effects of a thin basement membrane (δbm = 0.1–0.3 µm; Ref. 39) and decreased IgA diffusion coefficient (increased molecular radius). We also examined the effect of mesangial matrix structure (increasing the mesangial matrix fiber volume fraction) since the deposition of mesangial matrix is a common response in glomerular disease (28). For the simulations in this study only mesangial fiber thickness was changed, with total fiber density kept constant.
Parameters in the model were varied as follows:
1) Four different thicknesses of basement membrane were used: 100, 200, 300, and 400 nm.
2) Mesangial matrix had a volume fraction of 0.05, 0.08, 0.1, 0.13 and 0.15, with a fiber radius of 2 nm.
3) The radius of IgA was set to 75 Å and then 1.25 and 1.5 times this number.
In addition, we also examined the effect of a reaction at the surface of the mesangial cell. In this case, the boundary conditions for IgA were altered to simulate a pseudo-first-order reaction. The flux was set equal to a constant reaction rate, k, multiplied by the local IgA concentration. The reaction rate was varied among the values 1.38, 0.138, and 0.0138 µm/s, based on published in vitro studies (see details in appendix).
RESULTS
Results from our reference case are shown in Fig. 3. Pressure is highest at the capillary, decreasing into the mesangium due to plasma loss into the urinary space (Fig. 3A). The pressure gradient drives flow into the mesangium and across the filtration barrier (Fig. 3B). Transmesangial flow concentrates albumin by 1% (Fig. 3C) and IgA by 20% (Fig. 3D) in the mesangial interior, compared with capillary levels. Because the perimesangial filtration barrier in our model perfectly filters albumin, an oncotic pressure arises in the mesangium (Fig. 3E), which opposes the hydrostatic pressure driving filtration. Thus the flow (determined by pressure gradients) drives solute concentration, which in turn affects flow by altering the driving pressure.
Fig. 3.
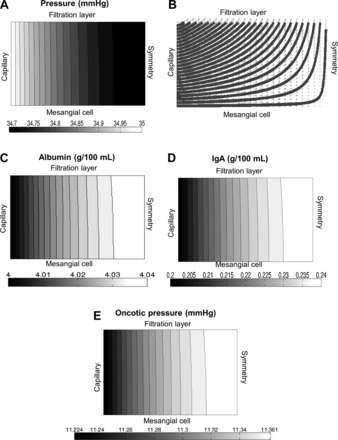
Results for the base case with a filtration barrier thickness of 0.4 µm, volume fraction ϕm = 0.05, and rIgA = 75 Å. A: contour lines for the pressure in mmHg. The highest pressures are found at the capillary boundary, with the pressure quickly dropping as fluid is lost across the filtration barrier. B: streamlines of plasma flow in the mesangial matrix. The symmetry boundary condition on the right-hand side causes a sharp turn in plasma flow. C: Albumin concentration within the matrix. Albumin is very close to the plasma level throughout the mesangium. D: immunoglobulin A (IgA) concentration within the mesangial matrix. Because of its larger size, IgA diffuses more slowly and therefore concentrates more than albumin, rising 20% above its capillary concentration. E: oncotic pressure due to albumin in the mesangial matrix. This pressure significantly reduces the driving force of filtration.
Mesangial flux changes with both filtration barrier thickness, as well as mesangial matrix permeability (Fig. 4). Thinner filtration barriers have the largest effect, as they decrease the resistance of the entire mesangial region (Fig. 4A). In contrast, changing the permeability of the mesangial matrix has little effect for thicker filtration barriers (Fig. 4B). However, at the thinnest filtration barrier tested (100 nm), mesangial matrix permeability is important. With the thinner filtration barrier, the resistance to flow from the mesangial matrix begins to approach the resistance from the filtration barrier, so changing mesangial matrix permeability has a significant influence on mesangial matrix flux.
Fig. 4.
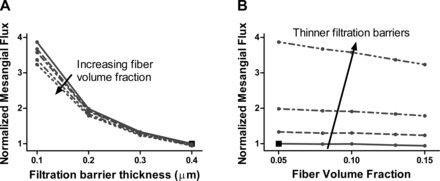
A: as the filtration barrier becomes thinner, mesangial flux increases. Mesangial flux values are normalized by the value in the reference case. B: mesangial matrix fiber volume fraction has only a small effect for thicker filtration barriers (0.2–0.4 µm). For a filtration barrier thickness of 0.1 µm, however, changing the mesangial matrix volume fraction has a noticeable effect.
We investigated the effects of intrinsic glomerular factors on IgA accumulation. IgA accumulation increases dramatically with thinner basement membranes (Fig. 5A), reaching values of 10–100 times the serum concentration, in sharp contrast to the 1.2 times the concentration seen in the reference case. The larger mesangial fluxes due to thinner basement membranes (Fig. 4) carry more IgA into the mesangial region. Because of IgA's small diffusion coefficient, this increased convective flux creates steep counteracting concentration gradients and thus much higher total accumulation. IgA accumulation also increases with increasing mesangial matrix fiber volume fraction (Fig. 5B). As the fiber volume fraction increases, the permeability of the mesangial matrix drops. Lower permeability under a constant pressure drop causes smaller mesangial fluxes (Fig. 4B); simultaneously, the increased matrix density results in more hindrance to diffusion. These two effects compete, with lower convective fluxes tending to decrease accumulation, but more hindered diffusion tending to increase accumulation. The net result is increased IgA accumulation as the matrix volume fraction increases (Fig. 5B). Dimerizing IgA increases its radius and has a similar effect on diffusion but not on flow (Fig. 6), because the IgA concentration is so low it does not affect viscosity or osmotic pressure. As the radius of IgA increases, it becomes harder for it to move through the porous mesangial matrix, and thus its accumulation increases dramatically.
Fig. 5.
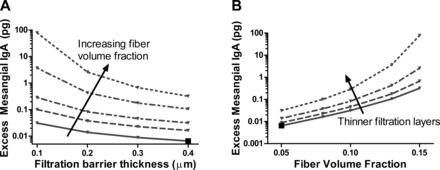
Excess mesangial accumulation vs. filtration barrier thickness (A) and mesangial matrix fiber volume fraction (B). Excess mesangial IgA is the IgA in the mesangial matrix above the concentration in the capillary. The reference case is again marked with the large black square.
Fig. 6.
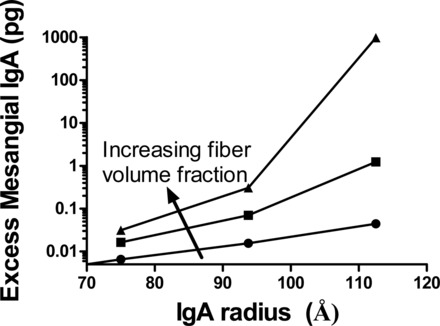
As the radius of IgA increases, the accumulation of IgA in the mesangium also increases. Results shown here are for IgA having a radius of 1×, 1.25×, and 1.75× the actual radius of IgA. These results are with a filtration barrier thickness of 0.4 µm, and mesangial matrix volume fractions of 0.05, 0.08, and 0.1.
When a cell surface reaction at the fastest rate was added to the model, accumulation decreased or ceased altogether, depending on the rate of reaction. We investigated simple first-order reaction kinetics, which increase linearly with increasing substrate (IgA) concentration. For large reaction rates (k = 1.38 µm/s), this resulted in the unreasonable result of a total absence of IgA accumulation (not shown). However, at lower reaction rates (k = 0.138, and 0.0138 µm/s), accumulation still occurred but at lower amounts, depending on mesangial flux (Fig. 7). In these cases, higher mesangial flux convected more IgA into the mesangium, which counteracted the loss from mesangial cell surface reaction. At lower fluxes, with k = 0.138 µm/s, the reaction removed IgA more quickly than it could accumulate. For the lowest k value tested (0.0138 µm/s), IgA accumulated for all PFB thicknesses.
Fig. 7.
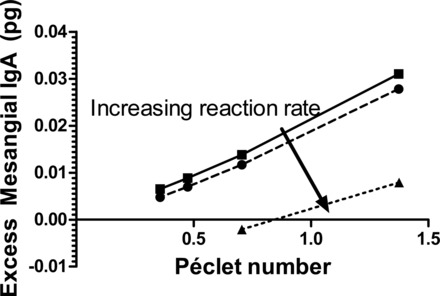
When a cell surface reaction is added to the model accumulation decreases. The magnitude of the decrease depends on the reaction rate, with faster reactions leading to less accumulation or even eliminating it altogether.
These results indicate that several different factors influence IgA mesangial accumulation, including perimesangial filtration barrier thickness, mesangial matrix permeability, and the radius of the diffusing IgA. These glomerular and species factors can be examined in terms of the way they affect convection and diffusion. Fundamentally, our model is a convection-diffusion model, so the importance of these factors lies in how they change convection and/or diffusion. Higher mesangial fluxes, which convect IgA, tend to increase accumulation. Higher diffusion coefficients, which allow the immunoglobulin to escape into the capillary, tend to decrease accumulation. Thus thinner PFBs, which allow increased mesangial flux, would tend to increase accumulation. Larger IgA radii, which decrease diffusion, also tend to increase accumulation.
The relative importance of convection and diffusion are quantified by the Péclet number. The Péclet number is defined as vL/D where v is a characteristic velocity, L is a characteristic length scale, and D is the diffusion coefficient. The numerator, vL, quantifies the strength of convection while the denominator, D, quantifies the strength of diffusion. For our simulation results we calculated a Péclet number using the mean velocity at the entrance of the mesangium for v, the length of the mesangium towards the symmetry boundary for L, and the diffusion coefficient of IgA for D. Plotting the accumulation of IgA vs. the Péclet number (Fig. 8) collapses all of the case studies in this work into a single curve. This general effect was also seen in the presence of a reaction on the mesangial cell surface (Fig. 7), but as the reaction rate got larger, IgA removal by cell surface reaction became the dominant factor.
Fig. 8.
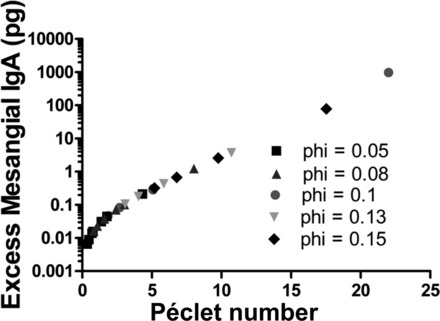
The accumulation of IgA in the mesangium for the cases plotted earlier but vs. the Péclet number. They form a smooth line, suggesting that accumulation depends significantly on Péclet number rather than the specific parameters of the simulation.
DISCUSSION
Although there is uncertainty in the specific parameter values used in this study, experimental measurements of blood velocity in the glomerular capillaries (66), mesangial dimensions (52), immunoglobulin and albumin diffusion coefficients (11, 7), mesangial pore sizes (59), and glomerular pressure drops suggest that transport in the mesangium is indeed near a Péclet number of order one. When the Péclet number is near one, convection and diffusion exert equal influence. As a result, even small changes to the strength of convection and/or diffusion, can greatly alter IgA transport. IgA accumulation will be highly sensitive to biological changes that result in increased or decreased plasma velocity or IgA diffusion, as shown schematically in Table 2.
Table 2.
Different physiological changes can have similar effects on IgA accumulation if their effect on the Péclet number is similar
| Physiological Change | Diffusion | Convection | Péclet Number | IgA Accumulation |
|---|---|---|---|---|
| Thinner basement membranes | - | ↑↑ | ↑↑ | ↑↑ |
| Denser mesangial matrix | ↓↓ | –/↓ | ↑↑ | ↑↑ |
| Larger IgA radius | ↓↓ | - | ↑↑ | ↑↑ |
IgA, immunoglobulin A.
The solute-agnostic nature of the model here, combined with the universality of the underlying physical principles, suggests that any macromolecule or tracer that is large or considerably hindered by the mesangial matrix will concentrate in the mesangium. Lipoproteins fall within this size range, and thus their transport would be affected by the parameters varied here (filtration barrier thickness, mesangial matrix permeability, etc.). Lipoproteins have been implicated in kidney disease (60, 30), and studies have shown that lipoprotein concentrations can affect mesangial cell proliferation (49). Tracer studies with imposil and carbon have shown that the mesangium is an important clearance route (37, 22). Size-dependent accumulation in the mesangium has also been experimentally observed (9).
A similar process appears to occur in amyloid disease of the kidney (18), with abnormal proteins (e.g., serum amyloid A protein; Ref. 25) exhibiting elevated serum levels and subsequently concentration and fibrogenesis in the mesangium. In collagenofibrotic glomerulopathy (20), the species in question is an atypical collagen III molecule, but the mesangial accumulation is similar. Although the subsequent accumulation process and molecule-cell interactions vary with disease, and the model parameters would vary with the molecule, it appears that the fundamental mechanisms explored herein are at work in many cases and that the transport dynamics of the mesangium render it particularly vulnerable to diseases of macromolecular accumulation.
Thus we must conclude that the well-established tendency of macromolecules to accumulate in the mesangium (54) can be explained in terms of nonspecific transport phenomena. This natural accumulation may be valuable in the healthy kidney, allowing the mesangium to function as sensitive monitor of serum proteins and to use its contractility to maintain proper glomerular function (54) or communicate changes is serum protein levels to the extraglomerular mesangium and juxtaglomerular apparatus via gap junction connections (65). In the case of disease, however, this tendency to accumulate macromolecules has a negative effect on mesangial function. Thus the general transport processes must be considered in conjunction with the specific biological processes (e.g., cell-molecule interactions) to create a full picture of a mesangial disease.
Early investigations suggested a role for the mesangium in regulating glomerular capillary diameter (5), but later work demonstrated that large capillary size changes would not result from mesangial contraction (33). Nevertheless, mesangial cell contraction can change the surrounding matrix structure: contraction will increase the space available for plasma flow while maintaining constant fiber volume, thus decreasing matrix fiber volume fraction (50). This drop in fiber volume fraction could have significant effects on macromolecule accumulation, as the increased permeability allows easier transport across the mesangial region. Since the mesangium connects adjacent glomerular capillaries, increased capillary to capillary transport may play a role in the attenuated responses to ANG II observed after mesangial cell injury (4).
In the case of IgA nephropathy, certain factors are known to increase the risk of developing disease (64) without completely predicting it. Our model suggests that the association of thin basement membranes (TBM) with IgA nephropathy (14) might be due to TBM causing increased convection, which increases the IgA accumulation (Fig. 4). Our model also provides insight into the findings that mesangial IgA deposition requires the presence of both IgA and soluble CD89 (sCD89) (3). Because smaller macromolecules more easily escape the mesangium (Fig. 6), a IgA-sCD89 complex would concentrate significantly more than either IgA or sCD89 alone. Nephropathy development might hinge upon the decreased diffusion coefficient that results from complex formation and creates high mesangial concentrations.
The transport model in this paper is simplified, as it ignores uptake by mesangial cells, which is important in IgA nephropathy and other diseases (55). Uptake could be added to the current modeling framework by introducing a reaction term at the mesangial cell surface (i.e., by modifying the boundary condition to allow flux into the cell). Such a change to the model would lead to other dimensionless groups, comparing the rate of reaction at the cell surface to convective or diffusive transport. Since mesangial cells rapidly clear many solutes (22, 23, 31), this dimensionless number may be more important than the Péclet number.
This model only considered the accumulation of IgA. In reality, accumulation per se is not sufficient to cause damage (64), but it is a necessary step in the process. Another simplification of the model was the assumption of no solute flux into the urinary space. Albumin is known to cross the filtration barrier (16) and if IgA also leaked across the filtration barrier, that would decrease accumulation. An extended model using estimated sieving coefficients for albumin and IgA at the filtration barrier (21) could address this issue.
GRANTS
This work was supported by National Science Foundation Grant CMMI-1300649 and National Institute of Diabetes and Digestive and Kidney Diseases Fellowship Grant F31-DK-097947 (to S. E. Hunt).
DISCLOSURES
No conflicts of interest, financial or otherwise, are declared by the author(s).
AUTHOR CONTRIBUTIONS
Author contributions: S.E.H., K.D.D., Y.S., and V.H.B. conception and design of research; S.E.H. performed experiments; S.E.H., K.D.D., Y.S., and V.H.B. analyzed data; S.E.H., K.D.D., Y.S., and V.H.B. interpreted results of experiments; S.E.H. prepared figures; S.E.H. and V.H.B. drafted manuscript; S.E.H., K.D.D., Y.S., and V.H.B. edited and revised manuscript; S.E.H., K.D.D., Y.S., and V.H.B. approved final version of manuscript.
ACKNOWLEDGEMENTS
This work was supported with resources and the use of facilities at the Minneapolis Veterans Affairs Health Care System. This work was carried out in part using computing resources at the University of Minnesota Supercomputing Institute.
APPENDIX
The maximum reaction rate was estimated based on in vitro kinetic data giving second-order kinetics with a rate constant of about 5 × 10⁻⁶·M−1·min−1 (34). This value was converted to a pseudo-first-order reaction by assuming a constant surface receptor concentration of 106 receptors per cell (26, 53), and a cell surface area of 100 µm2. The resulting pseudo-first-order surface reaction rate constant was 1.38 μm/s. A similar estimate was obtained based on Wang et al. (61), whose data suggest a reaction and internalization time of 5–15 min for sudden exposure to IgA solution. Given Wang's 5-min time scale, 0.5-ml reaction solution volume, and six-well plates (35-mm diameter wells), the surface reaction rate constant would be on the order of 1 μm/s. Thus 1.38 μm/s was taken as the maximum reaction rate. Slower rates were also considered.
Glossary
- a
Radius of diffusing molecule
- a1, a2
Osmotic pressure coefficients
- calb
Concentration of albumin
- cIgA
Concentration of IgA
Free diffusion coefficient, calculated from the Stokes-Einstein equation
Diffusion coefficient of albumin
- δPFB
Thickness of the filtration barrier (basement membrane + podocytes)
- kB
Boltzmann constant
- KD,mes
Hydraulic conductivity of the mesangial matrix KD = κ/μ
- KD,PFB
Hydraulic conductivity of the perimesangial filtration barrier
- κ
Tissue Darcy permeability
- μ
Plasma viscosity
- λ
Ratio of molecule radius to fiber radius
- p
Hydrostatic pressure in the mesangium
- pext
Hydrostatic pressure in Bowman's space
- Π
Oncotic pressure in mesangium
Surface normal vector
- ϕ
Fiber volume fraction, in mesangial matrix or perimesangial filtration barrier (PFB)
- r
Matrix fiber radius
- T
Temperature (K)
Plasma velocity
REFERENCES
- 1.Amore A, Cirina P, Conti G, Brusa P, Peruzzi L, Coppo R. Glycosylation of circulating IgA in patients with IgA nephropathy modulates proliferation and apoptosis of mesangial cells. J Am Soc Nephrol 12: 1862–1871, 2001. [DOI] [PubMed] [Google Scholar]
- 2.Amsden B. Solute diffusion within hydrogels. Mech Models Macromol 31: 8382–8395, 1998. [Google Scholar]
- 3.Berthelot L, Papista C, Maciel TT, Biarnes-Pelicot M, Tissandie E, Wang PH, Tamouza H, Jamin A, Bex-Coudrat J, Gestin A, Boumediene A, Arcos-Fajardo M, England P, Pillebout E, Walker F, Daugas E, Vrtosvnik F, Flamant M, Benhamou M, Cogné M, Moura IC, Monteiro RC. Transglutaminase is essential for IgA nephropathy development acting through IgA receptors. J Exp Med 209: 793–806, 2012. [DOI] [PMC free article] [PubMed] [Google Scholar]
- 4.Blantz RC, Gabbai FB, Tucker BJ, Yamamoto T, Wilson CB. Role of mesangial cell in glomerular response to volume and angiotensin II. Am J Physiol Renal Fluid Electrolyte Physiol 264: F158–F165, 1993. [DOI] [PubMed] [Google Scholar]
- 5.Blantz RC, Konnen KS, Tucker BJ. Angiotensin II effects upon the glomerular microcirculation and ultrafiltration coefficient of the rat. J Clin Invest 57: 419–434, 1976. [DOI] [PMC free article] [PubMed] [Google Scholar]
- 6.Burtis CA, Ashwood ER, Bruns DE. Tietz Textbook of Clinical Chemistry and Molecular Diagnostics. New York: Elsevier Health Sciences, 2012. [Google Scholar]
- 7.Chary SR, Jain RK. Direct measurement of interstitial convection and diffusion of albumin in normal and neoplastic tissues by fluorescence photobleaching. Proc Natl Acad Sci USA 86: 5385–5389, 1989. [DOI] [PMC free article] [PubMed] [Google Scholar]
- 8.Chauhan VP, Stylianopoulos T, Martin JD, Popovic Z, Chen O, Kamoun WS, Bawendi MG, Fukumura D, Jain RK. Normalization of tumour blood vessels improves the delivery of nanomedicines in a size-dependent manner. Nat Nanotechnol 7: 383–388, 2012. [DOI] [PMC free article] [PubMed] [Google Scholar]
- 9.Choi CH, Zuckerman JE, Webster P, Davis ME. Targeting kidney mesangium by nanoparticles of defined size. Proc Natl Acad Sci USA 108: 6656–6661, 2011. [DOI] [PMC free article] [PubMed] [Google Scholar]
- 10.Clague DS, Phillips RJ. A numerical calculation of the hydraulic permeability of three-dimensional disordered fibrous media. Phys Fluids 9: 1562, 1997. [Google Scholar]
- 11.Clauss MA, Jain RK, Tissues N. Interstitial transport of rabbit and sheep antibodies in normal and neoplastic tissues interstitial transport of rabbit and sheep antibodies in normal and neoplastic tissues. Cancer Res 50: 3487–3492, 1990. [PubMed] [Google Scholar]
- 12.Coelho JB, Chien KC, Bradley SE. Measurement of single-nephron glomerular filtration rate without micropuncture. Am J Physiol 223: 832–839, 1972. [DOI] [PubMed] [Google Scholar]
- 13.Coppo R, Feehally J, Glassock RJ. IgA nephropathy at two score and one. Kidney Int 77: 181–186, 2010. [DOI] [PubMed] [Google Scholar]
- 14.Cosio FG, Falkenhain ME, Sedmak DD. Association of thin glomerular basement membrane with other glomerulopathies. Kidney Int 46: 471–474, 1994. [DOI] [PubMed] [Google Scholar]
- 15.Daha MR, Van Kooten C. Deposition of IgA in primary IgA nephropathy: it takes at least four to tango. Nephrol Dial Transplant 28: 794–797, 2013. [DOI] [PubMed] [Google Scholar]
- 16.Deen WM, Haraldsson B, Nyström J. Properties of the glomerular barrier and mechanisms of proteinuria. Physiol Rev 88: 451–487, 2008. [DOI] [PubMed] [Google Scholar]
- 17.Deen WM, Robertson CR, Brenner BM. A model of glomerular ultrafiltration in the rat. Am J Physiol 223: 1178–1183, 1972. [DOI] [PubMed] [Google Scholar]
- 18.Dember LM. Amyloidosis-associated kidney disease. J Am Soc Nephrol 17: 3458–3471, 2006. [DOI] [PubMed] [Google Scholar]
- 19.Drumond MC, Deen WM. Structural determinants of glomerular hydraulic permeability. Am J Physiol Renal Fluid Electrolyte Physiol 266: F1–F12, 1994. [DOI] [PubMed] [Google Scholar]
- 20.Duggal R, Nada R, Rayat CS, Rane SU, Sakhuja V, Joshi K. Collagenofibrotic glomerulopathy–a review. Clin Kidney J 5: 7–12, 2012. [DOI] [PMC free article] [PubMed] [Google Scholar]
- 21.Edwards A, Daniels BS, Deen WM. Ultrastructural model for size selectivity in glomerular filtration. Am J Physiol Renal Physiol 276: F892–F902, 1999. [DOI] [PubMed] [Google Scholar]
- 22.Elema JD, Hoyer JR, Vernier RL. The glomerular mesangium: uptake and transport of intravenously injected colloidal carbon in rats. Kidney Int 9: 395–406, 1976. [DOI] [PubMed] [Google Scholar]
- 23.Emancipator SN, Rao CS, Amore A, Coppo R, Nedrud JG. Macromolecular properties that promotemesangial binding and mesangiopathic nephritis. J Am Soc Nephrol 2: S149–158, 1992. [DOI] [PubMed] [Google Scholar]
- 24.Fogo A, Hawkins EP, Berry PL, Glick AD, Chiang ML, MacDonell RC, Ichikawa I. Glomerular hypertrophy in minimal change disease predicts subsequent progression to focal glomerular sclerosis. Kidney Int 38: 115–123, 1990. [DOI] [PubMed] [Google Scholar]
- 25.Gillmore JD, Lovat LB, Persey MR, Pepys MB, Hawkins PN. Amyloid load and clinical outcome in AA amyloidosis in relation to circulating concentration of serum amyloid A protein. Lancet 358: 24–29, 2001. [DOI] [PubMed] [Google Scholar]
- 26.Gómez-Guerrero C, González E, Egido J. Evidence for a specific IgA receptor in rat and human mesangial cells. J Immunol 151: 7172–7181, 1993. [PubMed] [Google Scholar]
- 27.Gonzalez-Quintela A, Alende R, Gude F, Campos J, Rey J, Meijide LM, Fernandez-Merino C, Vidal C. Serum levels of immunoglobulins (IgG, IgA, IgM) in a general adult population and their relationship with alcohol consumption, smoking and common metabolic abnormalities. Clin Exp Immunol 151: 42–50, 2008. [DOI] [PMC free article] [PubMed] [Google Scholar]
- 28.Herrera GA, Turbat-Herrera EA, Teng J. Mesangial homeostasis and pathobiology: their role in health and disease. Contrib Nephrol 169: 6–22, 2011. [DOI] [PubMed] [Google Scholar]
- 29.Hiki Y, Odani H, Takahashi M, Yasuda Y, Nishimoto A, Iwase H, Shinzato T, Kobayashi Y, Maeda K. Mass spectrometry proves under-O-glycosylation of glomerular IgA1 in IgA nephropathy. Kidney Int 59: 1077–1085, 2001. [DOI] [PubMed] [Google Scholar]
- 30.Kamanna VS, Bassa BV, Kirschenbaum MA. Atherogenic lipoproteins and human disease: extending concepts beyond the heart to the kidney. Curr Opin Nephrol Hypertens 6: 205–211, 1997. [DOI] [PubMed] [Google Scholar]
- 31.Keane WF, Raij L. Impaired mesangial clearance of macromolecules in rats with chronic mesangial ferritin-antiferritin immune complex deposition. Lab Invest 43: 500–508, 1980. [PubMed] [Google Scholar]
- 32.Kriz W, Elger M, Lemley K, Sakai T. Structure of the glomerular mesangium: a biomechanical interpretation. Kidney Int Suppl 30: S2–9, 1990. [PubMed] [Google Scholar]
- 33.Kriz W, Elger M, Mundel P, Lemley KV. Structure-stabilizing forces in the glomerular tuft. J Am Soc Nephrol 5: 1731–1739, 1995. [DOI] [PubMed] [Google Scholar]
- 34.Kuhn LC, Kraehenbuhl JP. Role of secretory component, a secreted glycoprotein, in the specific uptake of IgA dimer by epithelial cells. J Biol Chem 254: 11072–11081, 1979. [PubMed] [Google Scholar]
- 35.Lai KN. Pathogenesis of IgA nephropathy. Nat Rev Nephrol 8: 275–283, 2012. [DOI] [PubMed] [Google Scholar]
- 36.Latta H. An approach to the structure and function of the glomerular mesangium. J Am Soc Nephrol 2: S65–73, 1992. [DOI] [PubMed] [Google Scholar]
- 37.Leiper JM, Thomson D, MacDonald MK. Uptake and transport of imposil by the glomerular mesangium in the mouse. Lab Invest 37: 526–533, 1977. [PubMed] [Google Scholar]
- 38.Lemley KV, Elger M, Kretzler M, Nagata M, Sakai T, Uiker S, Koeppen-Hagemann I, Kriz W. The glomerular mesangium: capillary support function and its failure under experimental conditions. Clin Investig 70: 843–856, 1992. [DOI] [PubMed] [Google Scholar]
- 39.Levick JR. Flow through interstitium and other fibrous matrices. Q J Exp Physiol 72: 409–437, 1987. [DOI] [PubMed] [Google Scholar]
- 40.Linossier MT, Palle S, Berthoux F. Different glycosylation profile of serum IgA1 in IgA nephropathy according to the glomerular basement membrane thickness: normal versus thin. Am J Kidney Dis 41: 558–564, 2003. [DOI] [PubMed] [Google Scholar]
- 41.Makino H, Hironaka K, Shikata K, Nagake Y, Kumagai I, Kashihara N, Ota Z. Mesangial matrices act as mesangial channels to the juxtaglomerular zone. Tracer and high-resolution scanning electron-microscopic study. Nephron 66: 181–188, 1994. [DOI] [PubMed] [Google Scholar]
- 42.Michael AF, Keane WF, Raij L, Vernier RL, Mauer SM. The glomerular mesangium. Kidney Int 17: 141–154, 1980. [DOI] [PubMed] [Google Scholar]
- 43.Michael AF, Kim Y. The Glomerular Mesangium. Am J Kidney Dis 12: 393–396, 1988. [DOI] [PubMed] [Google Scholar]
- 44.Moura IC, Arcos-Fajardo M, Gdoura A, Leroy V, Sadaka C, Mahlaoui N, Lepelletier Y, Vrtovsnik F, Haddad E, Benhamou M, Monteiro RC. Engagement of transferrin receptor by polymeric IgA1: evidence for a positive feedback loop involving increased receptor expression and mesangial cell proliferation in IgA nephropathy. J Am Soc Nephrol 16: 2667–2676, 2005. [DOI] [PubMed] [Google Scholar]
- 45.Moura IC, Benhamou M, Launay P, Vrtovsnik F, Blank U, Monteiro RC. The glomerular response to IgA deposition in IgA nephropathy. Semin Nephrol 28: 88–95, 2008. [DOI] [PubMed] [Google Scholar]
- 46.Myers BD, Deen WM, Robertson CR, Brenner BM. Dynamics of glomerular ultrafiltration in the rat. VIII. Effects of hematocrit. Circ Res 36: 425–435, 1975. [DOI] [PubMed] [Google Scholar]
- 47.Neal CR, Muston PR, Njegovan D, Verrill R, Harper SJ, Deen WM, Bates DO. Glomerular filtration into the subpodocyte space is highly restricted under physiological perfusion conditions. Am J Physiol Renal Physiol 293: F1787–F1798, 2007. [DOI] [PubMed] [Google Scholar]
- 48.Nicholson JP, Wolmarans MR, Park GR. The role of albumin in critical illness. Br J Anaesth 85: 599–610, 2000. [DOI] [PubMed] [Google Scholar]
- 49.Nishida Y, Oda H, Yorioka N. Effect of lipoproteins on mesangial cell proliferation. Kidney Int Suppl 71: S51–S53, 1999. [DOI] [PubMed] [Google Scholar]
- 50.Olivetti G, Kithier K, Giacomelli F, Wiener J. Glomerular permeability to endogenous proteins in the rat: effects of acute hypertension. Lab Invest 44: 127–137, 1981. [PubMed] [Google Scholar]
- 51.Ramanujan S, Pluen A, McKee TD, Brown EB, Boucher Y, Jain RK. Diffusion and convection in collagen gels: implications for transport in the tumor interstitium. Biophys J 83: 1650–1660, 2002. [DOI] [PMC free article] [PubMed] [Google Scholar]
- 52.Sakai T, Kriz W. The structural relationship between mesangial cells and basement membrane of the renal glomerulus. Anat Embryol (Berl) 176: 373–386, 1987. [DOI] [PubMed] [Google Scholar]
- 53.Sancho J, González E, Escanero JF, Egido J. Binding kinetics of monomeric and aggregated IgG to Kupffer cells and hepatocytes of mice. Immunology 53: 283–289, 1984. [PMC free article] [PubMed] [Google Scholar]
- 54.Schlondorff D. The glomerular mesangial cell: an expanding role for a specialized pericyte. FASEB J 1: 272–281, 1987. [DOI] [PubMed] [Google Scholar]
- 55.Schlöndorff D, Banas B. The mesangial cell revisited: no cell is an island. J Am Soc Nephrol 20: 1179–187, 2009. [DOI] [PubMed] [Google Scholar]
- 56.Stevens LA, Coresh J, Greene T, Levey AS. Assessing kidney function–measured and estimated glomerular filtration rate. N Engl J Med 354: 2473–2483, 2006. [DOI] [PubMed] [Google Scholar]
- 57.Stockand JD, Sansom SC. Glomerular mesangial cells: electrophysiology and regulation of contraction. Physiol Rev 78: 723–744, 1998. [DOI] [PubMed] [Google Scholar]
- 58.Swartz MA, Fleury ME. Interstitial flow and its effects in soft tissues. Annu Rev Biomed Eng 9: 229–256, 2007. [DOI] [PubMed] [Google Scholar]
- 59.Takami H, Naramoto A, Nakazawa K, Shigematsu H, Ohno S. Ultrastructure of glomerular mesangial matrix by quick-freeze and deep-etch methods. Kidney Int 38: 1211–1215, 1990. [DOI] [PubMed] [Google Scholar]
- 60.Takemura T, Yoshioka K, Aya N, Murakami K, Matumoto a Itakura H, Kodama T, Suzuki H, Maki S. Apolipoproteins and lipoprotein receptors in glomeruli in human kidney diseases. Kidney Int 43: 918–927, 1993. [DOI] [PubMed] [Google Scholar]
- 61.Wang Y, Zhao MH, Zhang YK, Li XM, Wang HY. Binding capacity and pathophysiological effects of IgA1 from patients with IgA nephropathy on human glomerular mesangial cells. Clin Exp Immunol 136: 168–175, 2004. [DOI] [PMC free article] [PubMed] [Google Scholar]
- 62.Wehner H, Majorek B. Early glomerular changes in streptozotocin diabetes of the guinea pig. Virchows Arch A Pathol Anat Histol 368: 179–189, 1975. [DOI] [PubMed] [Google Scholar]
- 63.Windberger U, Bartholovitsch A, Plasenzotti R, Korak KJ, Heinze G. Whole blood viscosity, plasma viscosity and erythrocyte aggregation in nine mammalian species: reference values and comparison of data. Exp Physiol 88: 431–440, 2003. [DOI] [PubMed] [Google Scholar]
- 64.Wyatt RJ, Julian BA. IgA nephropathy. N Engl J Med 368: 2402–2414, 2013. [DOI] [PubMed] [Google Scholar]
- 65.Yao J, Zhu Y, Morioka T, Oite T, Kitamura M. Pathophysiological roles of gap junction in glomerular mesangial cells. J Membr Biol 217: 123–130, 2007. [DOI] [PubMed] [Google Scholar]
- 66.Zimmerhackl B, Parekh N, Kücherer H, Steinhausen M. Influence of systemically applied angiotensin II on the microcirculation of glomerular capillaries in the rat. Kidney Int 27: 17–24, 1985. [DOI] [PubMed] [Google Scholar]
