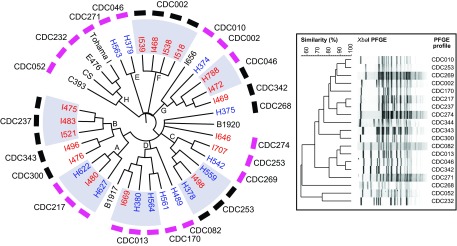
FIG 2 .
Maximum likelihood for gene order (MLGO) clustering of epidemic strains from the 2010 California (blue) and 2012 Vermont (red) statewide pertussis epidemics. Publicly available genomes (Tohama I, CS, B1917, and B1920) and two resequenced vaccine strains (C393 and E476) were also included (black). Pertactin production and deficiency of each strain are indicated by pink and black boxes, respectively. Clades referenced within the text are indicated by letters. The inset displays banding patterns of the PFGE profiles of all epidemic and vaccine strains sequenced in this study. The dendrogram of PFGE profiles was created using the unweighted pair group method using average linkages (UPGMA) with 1% band tolerance and optimization settings. Genomes for the epidemic isolates I488 and I517 were excluded from the analysis (see Materials and Methods and Data Set S1 in the supplemental material).

