Abstract
Purpose:
To evaluate the relationship between vision-related quality of life (QOL) as measured by the short-form 11-item Japanese version of the Visual Function Questionnaire (VFQ-J11) and the severity of visual field (VF) defects in patients with glaucoma.
Methods:
The study included 134 glaucoma patients and 30 normal subjects. VF testing using the Humphrey Field Analyzer was performed to obtain both the VF index (VFI) and MD in both eyes of each glaucoma patient. Binocular integrated VF was constructed for each patient by merging corresponding sensitivity values from monocular VFs, and the correlation between visual function and vision-related QOL was then assessed.
Results:
A significant relationship was found between QOL and VF in 6 of 7 subscales on the VFQ-J11, and between the composite scores in both the better eye and the worse eye in glaucoma patients. The relationship was stronger in the worse eye than in the better eye. Overall, correlation coefficients of the VFI were higher than those of MD and slightly higher than those of integrated VF in the worse eye.
Conclusions:
The VFI showed a marginally better correlation than MD. Assessment of VFI in the worse eye may provide useful information regarding vision-related QOL in glaucoma patients.
Key Words: quality of life, visual field, VFQ-J11
Glaucoma is a chronic degenerative optic neuropathy associated with a gradual loss of ganglion cells and decreased thickness of the retinal nerve fiber layer1 that reduces quality of life (QOL). The primary goal in treating glaucoma patients is to help them maintain their QOL. Self-report measures, such as the 25-item National Eye Institute Visual Function Questionnaire (NEI VFQ-25) have frequently been used to investigate the effect of glaucoma on vision-related QOL.2–5 A significant relationship has been reported between responses on the NEI VFQ-25 and the severity of visual field (VF) defects, as measured by standard automated perimetry, with lower QOL scores being correlated with more severe VF defects.2,4
Suzukamo et al6 questioned the appropriateness of the “driving” domain in the Japanese version of the VFQ because the related activity seemed relatively unimportant to Japanese patients. They also claimed that the NEI VFQ could only be unidimensional if the “color vision,” “peripheral vision,” and “ocular pain” domains were excluded. The Japanese-language version of the NEI VFQ-25 is composed of 25 essential and 13 optional items that generate subscales,7 and has been tested6 and used8–11 in a number of studies on vision-related QOL. However, asking patients in clinical settings to respond to a large number of questions on visual function can impose a substantial burden. The short-form 11-item Japanese version of the VFQ (VFQ-J11) has been reported as being superior to the NEI VFQ-25 in terms of responsiveness and criterion-related validity.12 The VFQ-J11 provides relatively little information on people with close to normal visual function, but a vast amount of information on individuals severely affected by vision problems.12
The purpose of the current study was to investigate the relationship between vision-related QOL, as measured by the VFQ-J11, and the severity of VF defects in patients with glaucoma.
PATIENTS AND METHODS
Study Population
For this study, 134 patients with glaucoma and 30 normal subjects were enrolled and subsequently followed up at Kagawa University Hospital from March 2014 to August 2014. A detailed explanation of the study objectives and methods was provided to all eligible subjects, and those who agreed to participate signed an informed consent form in accordance with the principles embodied in the Declaration of Helsinki. The study protocol was approved by the institutional review board of the Kagawa University Faculty of Medicine. Normal control subjects were either attending outpatient clinics, were spouses or friends of recruited patients, or were volunteers from among the hospital staff.
All subjects underwent a complete ophthalmic examination that included visual acuity (VA) testing with refraction, intraocular pressure, gonioscopy, and dilated fundus examination with stereoscopic biomicroscopy of the optic nerve head using a slit-lamp and indirect ophthalmoscopy. Inclusion criteria for glaucoma were primary open-angle glaucoma, glaucomatous excavation of the optic nerve head, and consistent glaucomatous VF defects as determined by the Humphrey Field Analyzer (HFA) (Carl Zeiss Meditec, Dublin, CA). Glaucomatous eyes were defined as eyes exhibiting structural glaucomatous changes, such as vertical cup-disc asymmetry between fellow eyes of ≥0.2, cup-to-disc ratio ≥0.6, and neuroretinal rim narrowing, notches, localized pallor, or retinal nerve fiber layer defects with glaucomatous VF loss in the corresponding hemifield. A glaucomatous VF was defined as an abnormal glaucoma hemifield test on at least 2 consecutive tests at baseline and the presence of at least 3 contiguous test points within the same hemifield on the pattern deviation plot at P<1%, with at least 1 at P<0.5% excluding points on the edge of the field or those directly above and below the blind spot. To be enrolled in the study as a control, subjects had to have an intraocular pressure ≤21 mm Hg, no history of retinal pathology, and a normal VF. Exclusion criteria included a history of any kind of retinal pathology, neurological disease, retinal laser procedure, or retinal or intraocular surgery.
Data Collection
Corrected VA was assessed bilaterally in all subjects using the logarithm of the minimum angle of resolution. VF data were obtained using program 30-2 of the HFA. Only reliable VF data were used. HFA reliability criteria (<25% fixation losses, <15% false-positive errors) were applied. The false-negative rate was not used as an indicator of test reliability.13 VF testing using the HFA was performed to obtain VF index (VFI) and MD scores in both eyes of each subject. Eyes with higher scores were defined as the better eye. Binocular integrated VF (IVF) was estimated solely on the basis of monocular results, using the best sensitivity values from corresponding VF locations from the 2 eyes; no additional testing was required.14–16 Each location in a monocular 30-2 VF corresponds with a “spatially-coincident” point in the binocular VF. Next, the maximum raw sensitivity (dB) and best total deviation (TD) values from each of the overlapping locations were determined to provide an estimate of sensitivity and TD in binocular viewing conditions. IVF sensitivity at the location of the blind spot in 1 eye is dependent on retinal sensitivity at the corresponding location in the other; therefore, these locations were not excluded. IVF MD was calculated as the mean of individual binocular TD values across the IVF. For the current study, visual function data were collected from all subjects within 6 months of enrollment.
VFQ-J11
Vision-related QOL was assessed using the VFQ-J11. The VFQ-J11 score is presented as an index between 0 and 100, with 0 representing the worse possible score and 100 the best; the overall score is an unweighted average of attributes from all 11 questions. The VFQ-J11 is also composed of the following 7 subscales: general vision; near vision; distance vision; social functioning; role limitation; dependency; and distress.
Statistical Analysis
The independent Student t test and the χ2 test were used to assess differences between the control and glaucoma groups. Spearman rank-order correlations were determined to assess relationships between visual function and the composite and subscale scores of the VFQ-J11. All statistical values are presented as the mean±SD. Because of the exploratory character of this study, no adjustments were applied for multiple testing. P-values are given for descriptive reasons only. All analyses were performed using SPSS (version 19.0; IBM, New York, NY).
RESULTS
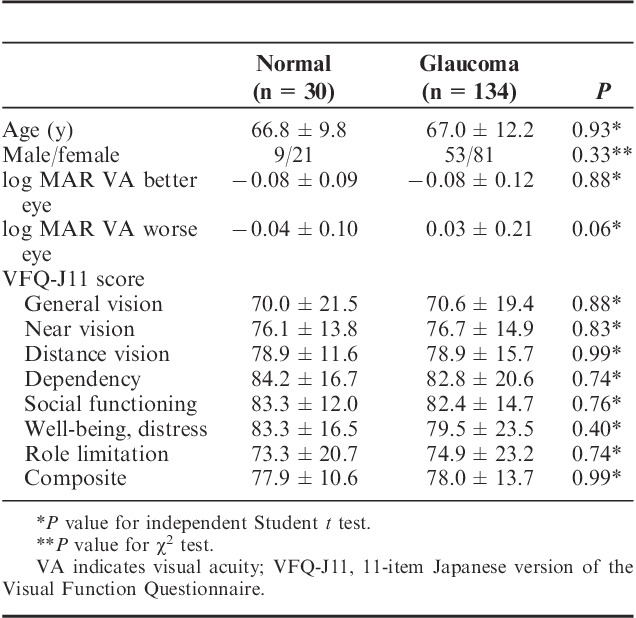
The clinical characteristics of all subjects are shown in Table 1. Mean age was 66.4±9.2 years (range, 46 to 91 y) for normal subjects, and 67.0±11.8 years (range, 34 to 92 y) for patients with glaucoma (P=0.84). No significant differences were observed for sex (P=0.33), VA in the better eye (P=0.88), VA in the worse eye (P=0.06), or VFQ-J11 scores (P=0.40 to 0.99). The highest score was seen in dependency, whereas the lowest score was seen in general vision in both normal subjects and glaucoma patients.
TABLE 1.
Clinical Characteristics in Study Participants

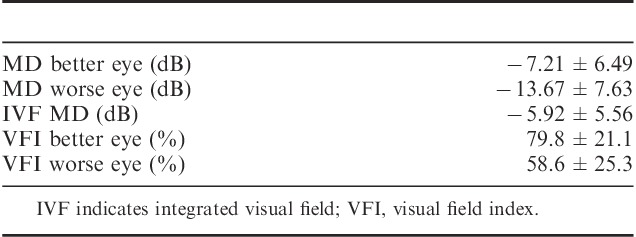
Mean MD and VFI scores were −7.21±6.49 dB (range, 1.88 to 25.19 dB) and 79.8±21.1% (range, 24% to 100%) in the better eye and −13.67±7.63 dB (range, −0.70 to −30.47 dB) and 58.6±25.3% (range, 0% to 97%) in the worse eye, respectively (Table 2). Mean IVF MD was −5.92±5.56 dB (range, 1.85 to −24.19 dB).
TABLE 2.
Ophthalmological Data of Glaucoma Patients

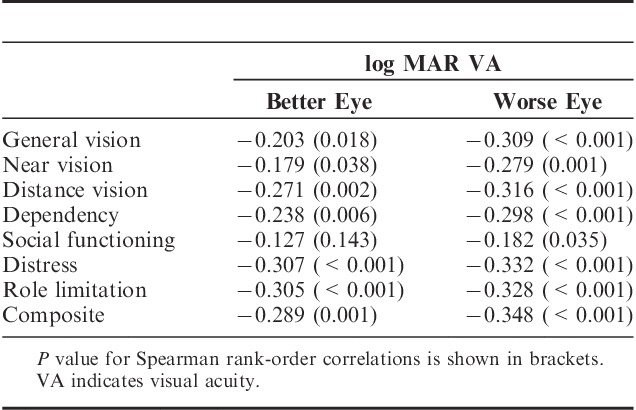
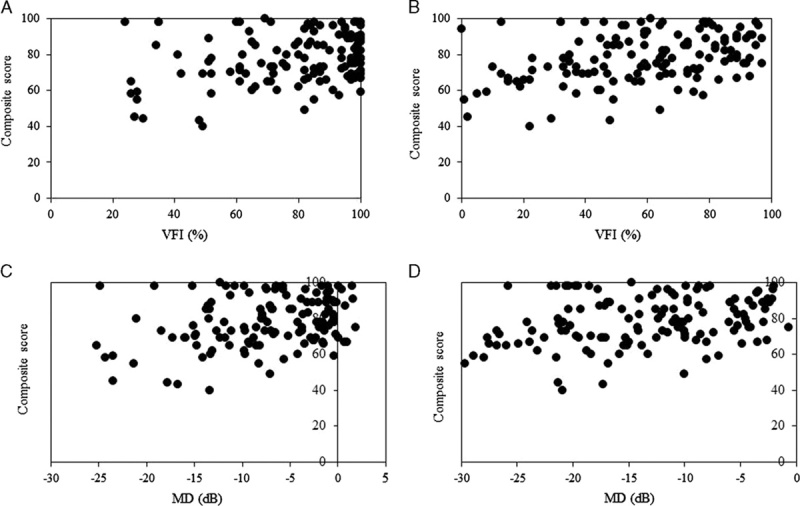
VFQ-J11 scores correlated most closely with VFI in the worse eye, followed by VA in the worse eye with a slight difference (Tables 3 and 4). For both VFI and VA in the worse eye, moderate correlations were observed in the composite scores. The correlation coefficient of distress was higher in VFI, MD, and VA than in any individual subscale for both the better and worse eyes. The correlation coefficient of the VFI in the worse eye was highest in the VFQ-J11 composite scores. The relationships between VF defects and VFQ-J11 composite scores are shown in Figure 1.
TABLE 3.
Association Between Visual Acuity and Health-related Quality of Life in All Participants

TABLE 4.
Association Between Visual Field Loss and Health-related Quality of Life in All Participants

FIGURE 1.

Scatter plot showing the relationship between composite scores on the short-form 11-item Japanese version of the Visual Function Questionnaire and the worse eye with visual field index (VFI) scores (A), the better eye with VFI scores (B), the better eye with MD (C) and the worse eye with MD (D) obtained using program 30-2 of the Humphrey Field Analyzer.
Composite scores decreased significantly for VFI in the worse eye values <50% (P<0.001, compared with VFI values >50%; P=0.02, compared with normal subjects) (Table 5).
TABLE 5.
VFI Values Above and Below 50% in the Worse Eye in All Participants

DISCUSSION
Compared with the NEI VFQ-25, which has been used to measure visual function in a wide variety of contexts,8–11 the VFQ-J11 takes less time to complete and therefore places less of a burden on respondents while maintaining sound psychometric properties.12,17 Furthermore, scores on the VFQ-J11 correlate more strongly with visual functions, such as VA and VF than those on the NEI VFQ-25.12 For these reasons, we decided to use the VFQ-J11 for measuring visual function in the present study.
No significant differences were found in VFQ-J11 scores between normal subjects and glaucoma patients. Although composite scores in patients with glaucoma showing VFI values of >50% in the worse eye were similar to those of normal subjects, they were significantly lower in glaucoma patients with VFI values of <50%. Moreover, significant correlations were evident between composite scores and VFI changes in the worse eye. Although Wändell et al18 previously reported that glaucoma patients had a good QOL, especially when their vision was intact, QOL is reduced with impaired VA and VF. Takahashi et al19 recently reported that vision-related QOL in glaucoma patients is reduced with awareness of VF defects. We have also confirmed that vision-related QOL remains unaffected until visual function is significantly decreases.
Better-functioning and worse-functioning eyes have been investigated in terms of relationships with QOL in numerous studies. A few of these studies11,20 reported finding stronger associations between QOL and monocular VF indices in the better eye than in the worse eye; however, another study21 contradicted these findings. In the present study, on the basis of VFI, MD, and VA, a slightly stronger relationship was apparent between the worse eye and QOL in visual functions. Clinicians’ decisions regarding patient management typically focus on the better eye, as better visual function is believed to be more closely associated with QOL; however, the results of the present study suggest that clinicians must also pay attention to the worse eye. Turano et al22 previously reported a correlation between vision in patients with glaucoma and obstacle course walking speed, with the strongest being for MD of the VF in the worse eye.
In the present study, the correlation coefficients of both MD and IVF in the worse and better eyes were similar. IVF does not represent “real” binocular testing, but rather simulates a binocular VF by merging monocular VFs, and is therefore not the same as VF testing with both eyes open. The results of actual binocular VF testing may have been different. Specific perimetric strategies can be used to obtain “real” binocular VFs; however, these are not routinely performed in clinical practice.
The VFI, which was originally developed with the goal of addressing the shortcomings of MD, is believed to be less affected than MD by the confounding effects of media opacities, such as cataracts.23 In addition, in contrast to the VFI, which is weighted, central VF test points are assigned greater significance compared with those located more peripherally, which is notable because the central VF is essential for vision-related QOL in daily life. In this study, although a marginally better correlation was seen with VFI compared with MD, a significant relationship was evident between QOL and both VFI and MD.
The present study did have some limitations. First, because the VFQ-J11 provides a subjective measure of vision-related QOL, it may not reflect the true impairment in QOL experienced by patients in their daily lives. Adults with age-related cognitive impairment tend to overestimate functional abilities,24 whereas those with depression tend to underestimate such abilities.25,26 In addition, whether these results are affected by the mode of administration (self-administered or interviewer-administered) of these measures remains unclear. Second, several types of glaucoma, including primary open-angle glaucoma (POAG), normal-tension glaucoma (NTG), exfoliation glaucoma, and primary angle-closure glaucoma were included in this study, and patterns of VF defects in NTG and POAG have been reported to differ. Although some cases involving NTG have been reported to be at risk of developing VF defects closer to fixation,27 little difference was seen in NEI VFQ-25 scores between NTG and POAG in a recent report.11
The results of the present study suggest that the VFQ-J11 is an extremely useful measure of vision-related QOL in patients with glaucoma. The VF loss that causes glaucoma remains irreversible; therefore, clinicians should modify or enhance treatment to prevent significant decreases in QOL. To work toward improving the QOL of patients, it is necessary to know the extent to which it is affected. If the VFI is <50% in the worse eye of a patient with glaucoma, their vision-related QOL may be significantly reduced.
Footnotes
Supported by a Grant-in-Aid for Scientific Research from the Ministry of Education, Culture, Sports, Science, and Technology of Japan (26462689).
Disclosure: The authors declare no conflict of interest.
REFERENCES
- 1.Weinreb RN, Khaw PT. Primary open-angle glaucoma. Lancet. 2004;363:1711–1720. [DOI] [PubMed] [Google Scholar]
- 2.McKean-Cowdin R, Wang Y, Wu J, et al. Los Angeles Latino Eye Study Group. Impact of visual field loss on health-related quality of life in glaucoma: the Los Angeles Latino Eye Study. Ophthalmology. 2008;115:941–948. [DOI] [PMC free article] [PubMed] [Google Scholar]
- 3.Spaeth G, Walt J, Keener J. Evaluation of quality of life for patients with glaucoma. Am J Ophthalmol. 2006;141:S3–S14. [DOI] [PubMed] [Google Scholar]
- 4.van Gestel A, Webers CA, Beckers HJ, et al. The relationship between visual field loss in glaucoma and health-related quality-of-life. Eye (Lond). 2010;24:1759–1769. [DOI] [PubMed] [Google Scholar]
- 5.Lisboa R, Chun YS, Zangwill LM, et al. Association between rates of binocular visual field loss and vision-related quality of life in patients with glaucoma. JAMA Ophthalmol. 2013;131:486–494. [DOI] [PMC free article] [PubMed] [Google Scholar]
- 6.Suzukamo Y, Oshika T, Yuzawa T, et al. Psychometric properties of the 25-item National Eye Institute Visual Function Questionnaire (NEI VFQ-25), Japanese version. Health Qual Life Outcomes. 2005;3:65. [DOI] [PMC free article] [PubMed] [Google Scholar]
- 7.Mangione CM, Lee PP, Gutierrez PR, et al. National Eye Institute Visual Function Questionnaire Field Test Investigators. Development of the 25-item National Eye Institute Visual Function Questionnaire. Arch Ophthalmol. 2001;119:1050–1058. [DOI] [PubMed] [Google Scholar]
- 8.Okamoto F, Okamoto Y, Hiraoka T, et al. Vision-related quality of life and visual function after retinal detachment surgery. Am J Ophthalmol. 2008;146:85–90. [DOI] [PubMed] [Google Scholar]
- 9.Yamada M, Mizuno Y, Miyake Y. Cataract Survey Group of National Hospital Organization of Japan. A multicenter study on the health-related quality of life of cataract patients: baseline data. Jpn J Ophthalmol. 2009;53:470–476. [DOI] [PubMed] [Google Scholar]
- 10.Okamoto F, Okamoto Y, Hiraoka T, et al. Effect of vitrectomy for epiretinal membrane on visual function and vision-related quality of life. Am J Ophthalmol. 2009;147:869–874. [DOI] [PubMed] [Google Scholar]
- 11.Sawada H, Fukuchi T, Abe H. Evaluation of the relationship between quality of vision and the visual function index in Japanese glaucoma patients. Graefes Arch Clin Exp Ophthalmol. 2011;249:1721–1727. [DOI] [PubMed] [Google Scholar]
- 12.Fukuhara S, Wakita T, Yamada M, et al. Development of short version of the visual function questionnaire using item-response theory. PLoS ONE. 2013;8:e73084. [DOI] [PMC free article] [PubMed] [Google Scholar]
- 13.Bengtsson B, Heijl A. False-negative responses in glaucoma perimetry: indicators of patient performance or test reliability? Invest Ophthalmol Vis Sci. 2000;41:2201–2204. [PubMed] [Google Scholar]
- 14.Crabb DP, Viswanathan AC, McNaught AI, et al. Simulating binocular visual field status in glaucoma. Br J Ophthalmol. 1998;82:1236–1241. [DOI] [PMC free article] [PubMed] [Google Scholar]
- 15.Nelson-Quigg JM, Cello K, Johnson CA. Predicting binocular visual field sensitivity from monocular visual field results. Invest Ophthalmol Vis Sci. 2000;41:2212–2221. [PubMed] [Google Scholar]
- 16.Crabb DP, Fitzke FW, Hitchings RA, et al. A practical approach to measuring the visual field component of fitness to drive. Br J Ophthalmol. 2004;88:1191–1196. [DOI] [PMC free article] [PubMed] [Google Scholar]
- 17.Hiratsuka Y, Yamada M, Akune Y, et al. Assessment of vision-related quality of life among patients with cataracts and the outcomes of cataract surgery using a newly developed visual function questionnaire: the VFQ-J11. Jpn J Ophthalmol. 2014;58:415–422. [DOI] [PubMed] [Google Scholar]
- 18.Wändell PE, Lundström M, Brorsson B, et al. Quality of life among patients with glaucoma in Sweden. Acta Ophthalmol Scand. 1997;75:584–588. [DOI] [PubMed] [Google Scholar]
- 19.Takahashi G, Otori Y, Urashima M, et al. For Quality of Life Improvement Committee. Evaluation of quality of life in Japanese glaucoma patients and its relationship with visual function. J Glaucoma. 2015. [Epub ahead of print]. [DOI] [PubMed] [Google Scholar]
- 20.Gutierrez P, Wilson MR, Johnson C, et al. Influence of glaucomatous visual field loss on health-related quality of life. Arch Opthalmol. 1997;115:777–784. [DOI] [PubMed] [Google Scholar]
- 21.Jampel HD, Schwartz A, Pollack I, et al. Glaucoma patients’ assessment of their visual function and quality of life. J Glaucoma. 2002;11:154–163. [DOI] [PubMed] [Google Scholar]
- 22.Turano KA, Rubin GS, Quighley HA. Mobility performance in glaucoma. Invest Ophthalmol Vis Sci. 1999;40:2803–2809. [PubMed] [Google Scholar]
- 23.Bengtsson B, Heijl A. A visual field index for calculation of glaucoma rate of progression. Am J Ophthalmol. 2008;145:343–353. [DOI] [PubMed] [Google Scholar]
- 24.Rubenstein LZ, Schairer C, Wieland GD, et al. Systematic biases in functional status assessment of elderly adults: effects of different data sources. J Gerontol. 1984;39:686–691. [DOI] [PubMed] [Google Scholar]
- 25.Kuriansky JB, Gurland BJ, Fleiss JL, et al. The assessment of self-care capacity in geriatric psychiatric patients by objective and subjective methods. J Clin Psychol. 1976;32:95–102. [DOI] [PubMed] [Google Scholar]
- 26.Kiyak HA, Teri L, Borson S. Physical and functional health assessment in normal aging and in Alzheimer’s disease: self-reports vs family reports. Gerontologist. 1994;34:324–330. [DOI] [PubMed] [Google Scholar]
- 27.Caprioli J, Spaeth GL. Comparison of visual field defects in the low-tension glaucoma with those in the high-tension glaucomas. Am J Ophthalmol. 1984;97:730–737. [DOI] [PubMed] [Google Scholar]


