Abstract
Background
In previous work, we demonstrated the presence of hydroxyapetite (type II microcalcification), HAP, in triple negative MDA-MB-231 breast cancer cells. We used 18F-NaF to detect these types of cancers in mouse models as the free fluorine, 18F−, binds to HAP similar to bone uptake. In this work, we investigate other bone targeting agents and techniques including 99mTc-MDP SPECT and Osteosense 750EX FMT imaging as alternatives for breast cancer diagnosis via targeting HAP within the tumor microenvironment.
Methods
Thirteen mice were injected subcutaneously in the right flank with 106 MDA-MB-231 cells. When the tumor size reached ~0.6 cm3, mice (n = 9) were injected with ~37 MBq of 99mTc-MDP intravenously and then imaged one hour later in a NanoSPECT/CT or injected intravenously with 4 nmol/g of Osetosense 750EX and imaged 24 hours later in an FMT (n = 4). The imaging probe concentration in the tumor was compared to that of muscle. Following SPECT imaging, the tumors were harvested, sectioned into 10 µm slices, and underwent autoradiography or von Kossa staining to correlate 99mTc-MDP binding with HAP distribution within the tumor. The SPECT images were normalized to the injected dose and regions-of-interest (ROIs) were drawn around bone, tumor, and muscle to obtain the radiotracer concentration in these regions in units of percent injected dose per unit volume. ROIs were drawn around bone and tumor in the FMT images as no FMT signal was observed in normal muscle.
Results
Uptake of 99mTc-MDP was observed in the bone and tumor with little or no uptake in the muscle with concentrations of 11.34 ± 1.46 (mean ± SD), 2.22 ± 0.95, and 0.05 ± 0.04 %ID/cc, respectively. Uptake of Osteosense 750EX was also observed in the bone and tumor with concentrations of 0.35 ± 0.07 (mean ± SD) and 0.04 ± 0.01 picomoles, respectively. No FMT signal was observed in the normal muscle. There was no significant difference in the bone-to-tumor ratio between the two modalities (5.1 ± 2.3 for SPECT and 8.8 ± 2.2 for FMT) indicating that there is little difference in tumor uptake between these two agents.
Conclusion
This study provides evidence of the accessibility of HAP within the breast tumor microenvironment as an in vivo imaging target for bone-seeking agents. SPECT imaging using 99mTc-MDP can be rapidly translated to the clinic. FMT imaging using Osteosense 750EX is not currently approved for clinical use and is limited to animal research.
Keywords: Breast cancer, MDA-MB-231, Microcalcification, 99mTc-MDP, SPECT, Hydroxyapetite
1. Introduction
Mammograms often reveal small bone-like calcium deposits associated with breast cancer [1–5]. While there are many theories on the origin of these calcium deposits, more and more evidence in the past years has indicated that they could be the end result of a microcalcification process that begins inside the cell and then migrates to the microenvironment surrounding the tumors [6,7]. There are two types of microcalcifications: type I contain calcium oxalate, (CO), CaC2O4, generally associated with benign disease or non-invasive lobular carcinoma in situ, and type II contain calcium phosphates in the form of carbonated calcium hydroxyapatite (HAP), Ca10(PO4)6OH2, and are mainly associated with malignancy [1,5–12]. β-Glycerophosphate (βG) is hydrolyzed to glycerol and inorganic phosphate (Pi) on the malignant cell surface by alkaline phosphatase (ALP). Pi is then transported into the cell by the type II family of Na-Pi cotransporters where Pi then combines with calcium to produce HAP crystals. Finally, HAP leaves the cells and settles into the extracellular matrix [6,7]. Therefore HAP microcalcifications may be a sign of precancerous cells or early breast cancer including ductal carcinoma in situ (DCIS) [13].
HAP is also the basic component of normal skeletal bone [14,15]. Single Photon Emission Computed Tomography (SPECT) using [99mTc] methylene diphosphonate (99mTc-MDP) and Fluorescence Molecular Tomography (FMT) using Osteosense have been used extensively (and exclusively) for bone imaging. The uptake of 99mTc-MDP in bone is due to both chemical adsorption of 99mTc-MDP onto the surface of the HAP in bone and incorporation into the crystalline structure of HAP [16,17]. Osteosense is a synthetic phosphonate derivative that binds to HAP [18].
We have previously reported on the presence of HAP in the MDA-MB-231 triple negative breast cell line and provided evidence for the use of 18F-NaF positron emission tomography (PET) imaging for detecting MDA-MB-231 tumors in mouse models [19]. Upon administration, 18F− dissociates from the sodium ion in the blood and binds to HAP within the tumor microenvironment in a manner similar to bone uptake. In this work, we expand on our previous work and investigate the use of other bone-targeting agents including 99mTc-MDP and Osteosense 750EX in a multimodality approach to image MDA-MB- 231 tumors in mouse models of breast cancer via targeting the HAP within the tumor microenvironment. We then compare the results of this work to 18F-NaF PET results from our previous study.
2. Methods
All animal studies were approved by the Vanderbilt University Committee on Institutional Animal Care prior to conducting the experiments.
2.1. Tumor model
The mouse models were created as described in previous work [19]. Briefly, the MDA-MB-231 cells were cultured in Dulbecco's Modified Eagle's Medium (DMEM, Invitrogen, Carlsbad, CA) supplemented with 10% fetal bovine serum and 1% penicillin streptomycin (Invitrogen, Carlsbad, CA) at 37 °C in a humidified, 5% CO2 incubator. Approximately 10millionMDA-MB-231 cells in a 1:2 ratio of matrigel and DMEM were injected subcutaneously in the right hind limb of four to five week old female Foxn1 nu/nu mice (n = 13). Imaging sessions were conducted when the tumor size reached ~0.6 cm3 (as measured by calipers).
2.2. SPECT/CT imaging
Mice (n = 9) were anesthetized with 2% isofluorane and injected with ~37 MBq/0.2 mL 99mTc-MDP intravenously. The mice were positioned in a NanosSPECT/CT (Bioscan, Washington DC) at approximately 1 hour post radiotracer administration. A nine pinhole aperture, each with a pinhole diameter of 1.4 mm, was used on each of the four camera heads to allow for maximum sensitivity. Twenty-four projections at 60 seconds per projection were acquired for a total scan time of ~30 min. SPECT acquisitions were reconstructed via the manufacturers HiSPECT software using Ordered Subsets Expectation Maximization (OSEM) iterative reconstruction algorithm with 9 iterations and 4 subsets. CT images were conducted at an x-ray beam intensity of 90 mAs with an x-ray energy of 45 kVp. The SPECT/CT images were reconstructed into 176 × 176 × 300 slices with a voxel size of 0.2 × 0.2 × 0.2 mm3.
2.3. Autoradiography and staining
Upon completion of the SPECT/CT imaging sessions, the mice were euthanized and the tumors were harvested. Sections (10 µm) of the tumor and muscle (from the contralateral hind limb) were imaged in a Beta MicroImager (Biospace Labs, France) or stained with von Kossa to correlate 9mTc-MDP distribution sites with staining results. The stained slide and the autoradiography slide were subsequent sections to allow for better visual correlation of the two slides.
2.4. FMT imaging
Mice (n=4) were injected with 4nmol/g Osteosense 750EX (Perkin Elmer Inc, Boston, MA) intravenously. This dose was chosen based on the recommendations of the manufacturer. Approximately 24 hours later, the mice were anesthetized with 2% isofluorane and positioned in an FMT 2500 (Perkin Elmer Inc., Boston, MA). Scanning was performed using the 750EX channel. The entire mouse, except head and tail, were in the field-of-view. The scan lasted approximately 20 min. The images were reconstructed using the on-board TrueQuant software into a 512 × 512 × 13 array with a voxel size of 0.163 × 0.163 × 1 mm3.
2.5. Additional CT imaging
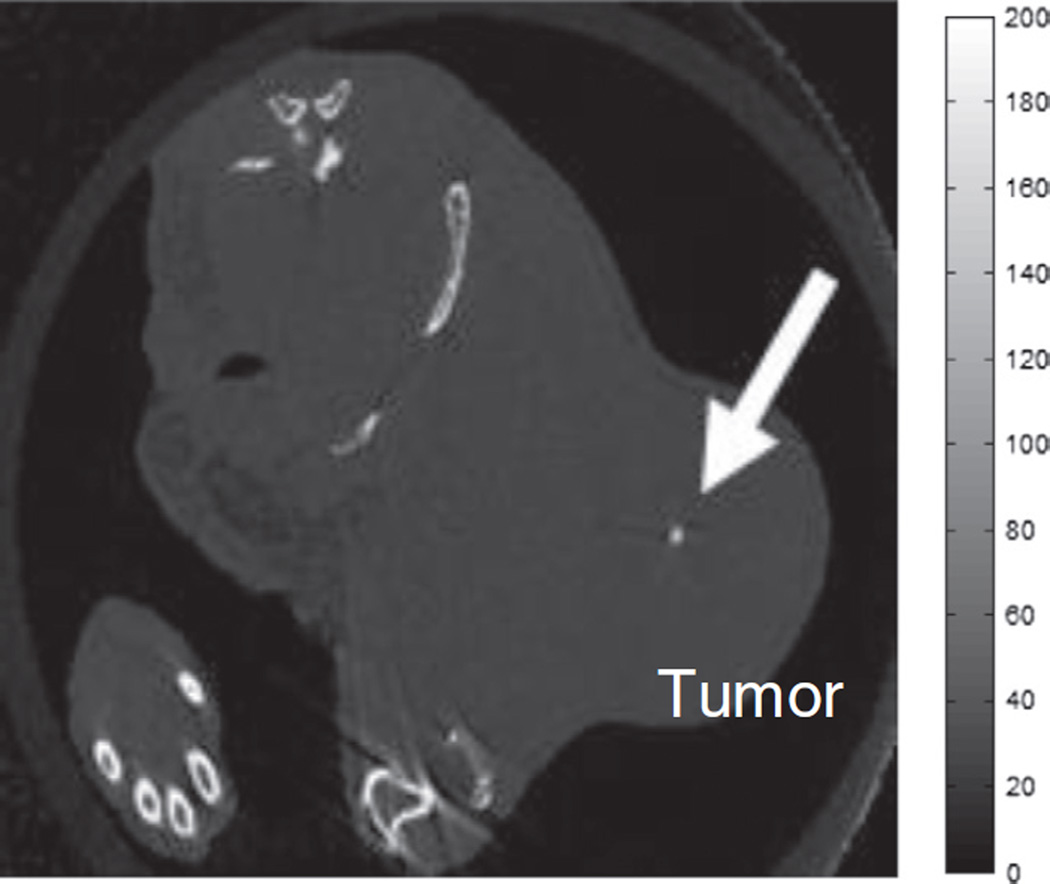
One of the mice had a tumor with size > 1500 mm3. It was euthanized without SPECT imaging and then imaged in a microCT 50 (SCANCO, Switzerland) at an x-ray beam intensity of ~1 kAs and an x-ray peak voltage of 45 kVp. The scan lasted approximately 4 hours. The image was reconstructed at a resolution of 0.45 × 0.45 × 0.45 mm3.
2.6. Data analysis
A-SPECT/CT: Regions-of-interest (ROIs) were manually drawn around the entire tumor, bone (hips + spine), and the muscle of the contralateral hind limb in the CT images for each mouse using the medical imaging analysis tool AMIDE[20] and superimposed on the SPECT images. The total radiotracer concentration within the tumor was compared to the mean radiotracer concentration of the bone and muscle using one way ANOVA followed by a Tukey's test using Prisim version 4.03 (Graphpad Software, Inc., La Jolla, Ca, USA). The statistical significance threshold was considered to be p < 0.05.
B-FMT: Cylindrical ROIs were drawn around the tumor and part of the spine using the onboard TrueQuant software.
3. Results
3.1. SPECT/CT imaging
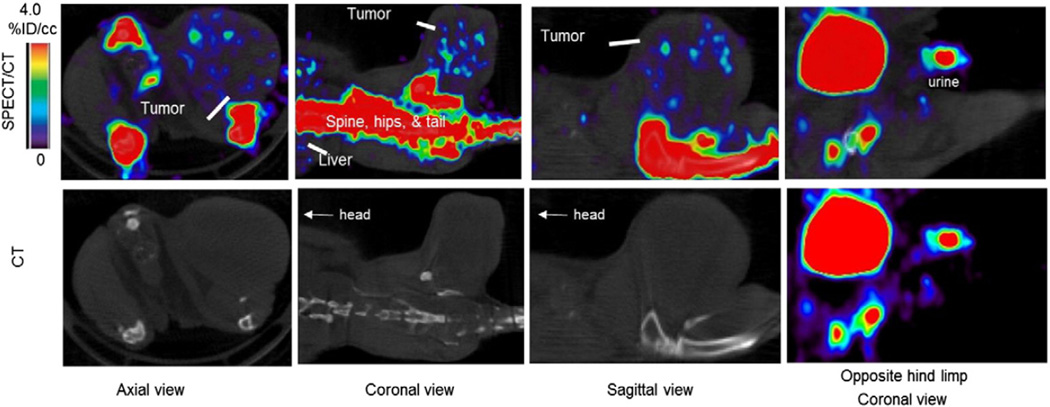
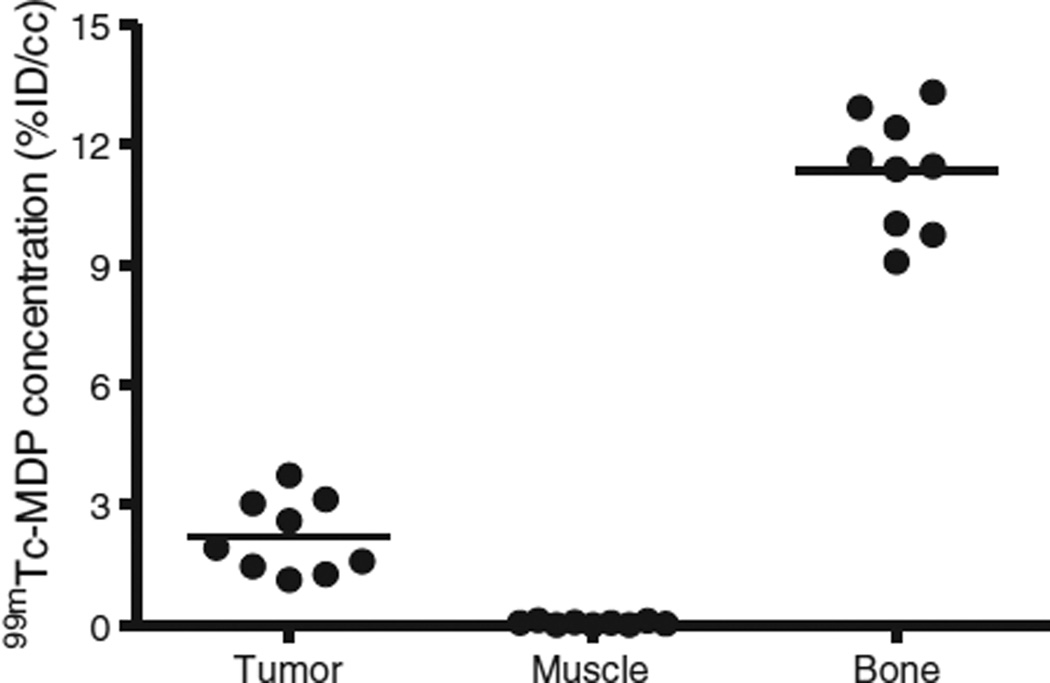
Tumor volumes using the CT images were estimated to be ~0.6 ± 0.15 cm3. Uptake of 99mTc-MDP was limited to the bone, liver, and tumor with little or no uptake observed in the muscle as shown in Fig. 1. Bone and tumor uptake of 99mTc-MDP was clearly visible in the SPECT images with little or no uptake in the muscle and normal tissue. The average radiotracer concentration, normalized to the injected dose (percent injected dose per unit volume, %ID/cc), was 2.22 ± 0.95 (mean ± SD), 0.05 ± 0.04, and 11.34 ± 1.46 in the tumor, muscle, and bone, respectively (please see Fig. 2). The concentrations in any of those regions were significantly different from any of the other two regions (p < 0.0001), i.e. tumor vs muscle, tumor vs bone, and bone vs muscle.
Fig. 1.
SPECT/CT images of a xenograft mouse bearingMDA-MB-231 at 1 hour post 99mTc-MDP administration. The distribution of the radiotracer was localized to bone, liver, bladder, and tumor with nearly zero activity in the muscle. The bone and bladder were masked using the CT images and superimposed on the SPECT images enhancing the visibility of the tumor radiotracer concentration.
Fig. 2.
Statistical analysis on 99mTc-MDP concentration in different regions of xenograft mice bearing MDA-MB-231 breast cancer cell line. A paired t-test comparing tumor to muscle revealed a p value of < 0.05.
3.2. Autoradiography and staining
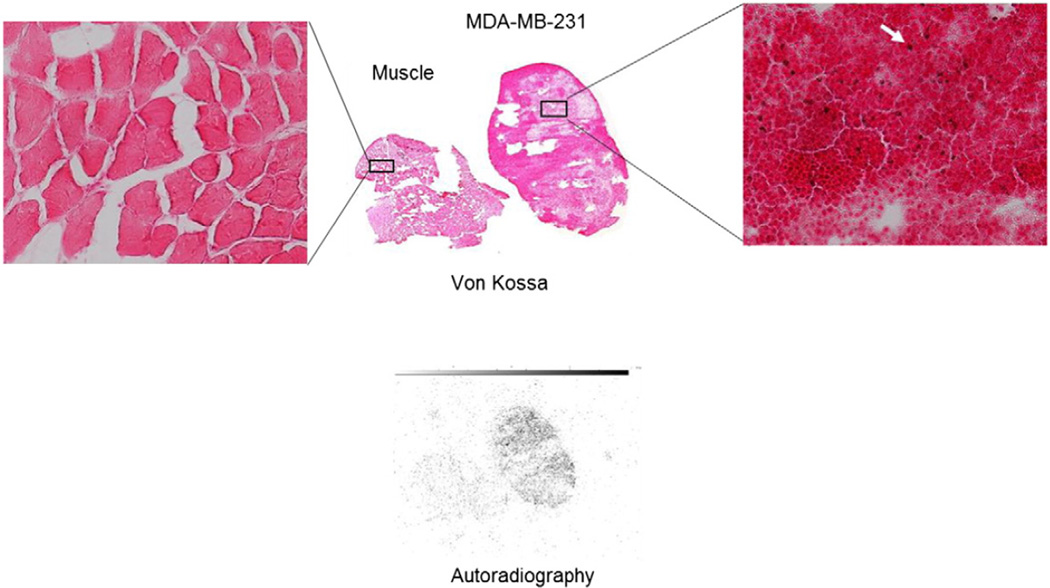
Autoradiography signal was well correlated with positive von Kossa stains (red/brown) found in the tumor sections. No 99mTC-MDP signal nor positive von Kossa stains were found in the muscle as shown in Fig. 3.
Fig. 3.
Von Kossa (colored) and autoradiography slices (black and white) of muscle and an MDA-MB-231 tumor harvested from a mouse immediately following SPECT imaging with 99mTc-MDP. The far left and far right inserts are magnified images of the stained samples. The red/brown von Kossa stains (pointed to by the white arrow) indicate the presence of type II microcalcification. Distribution of 99mTc-MDP was well correlated with the positive von Kossa stains while no autoradiography signal or positive stains were found in the muscle tissue.
3.3. FMT imaging
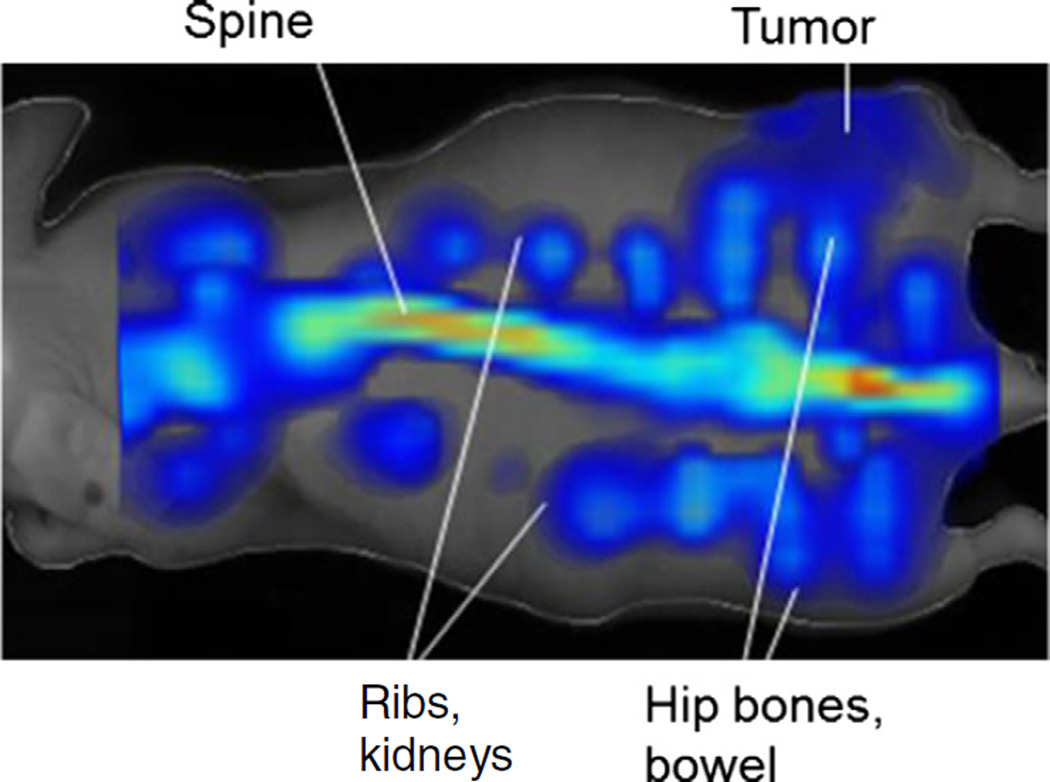
We observed Osteosense 750EX uptake in the bone (0.35 ± 0.07 mean ± SD picomoles) and tumor (0.043 ± 0.01) with the uptake in the bone, as expected, significantly higher than that of the tumor (p < 0.05) as shown in Fig. 4. Because there was no Osteosense 750EX uptake in normal muscle, we could not obtain any numerical value for muscle.
Fig. 4.
FMT image of a mouse injected with Osteosense 750 ex.
3.4. Additional CT imaging
For the mouse with a tumor size > 1500 mm3 imaged in a SCANCO microCT 50, a solid calcium deposit was clearly visible in the tumor as shown in Fig. 5, similar to calcifications observed in mammograms.
Fig. 5.
A high resolution CT image (0.045 × 0.45 × 0.45 mm3) of an MDA-MB-231 xenograft mouse model imaged with a SCANCO microCT 50. A calcium deposit similar to those seen in mammograms was clearly visible in this tumor.
4. Discussion
99mTc-MDP uptake was observed in the bone, liver, and tumor as shown in Fig. 1. Visual inspection of the autoradiography and von Kossa staining on tumor sections demonstrate a correlation between the distribution of 99mTc-MDP in the tumor and the presence of HAP as shown in Fig. 3. On the other hand, no autoradiography signal or positive von Kossa staining was observed in the muscle indicating specific uptake of 99mTc-MDP to hydroxyapetite lattices found within the tumor microenvironment. As expected, there was significantly higher uptake of 99mTc-MDP in the bone compared to tumor (p < 0.05) since the bone has a significantly larger surface area and higher HAP density.
It is worth noting that in order to visualize the tumors in the SPECT images, the display window was set to a maximum of 4% ID/cc, which made the bone signal appear saturated (please see Fig. 1). Typically, with 99mTc-MDP SPECT imaging of bone, the display window is set to a maximum that is higher than the mean activity in the bone in order to resolve bone structure and bone metastases.
99mTc-MDP uptake in the liver is typically observed due to the aggregation of the 99mTc-MDP molecules in the presence of calcium which leads to the formation of a large insoluble complex localized in the liver [21]. There may be unbound calcium ions in the MDA-MB-231 tumors too small to be resolved by CT. These ions would also cause aggregation of the 99mTc-MDP molecules which could also explain the presence of 99mTc-MDP in the MDA-MB-231 tumors. However, as we provided evidence of the presence of HAP in MDA-MB-231 cell line and demonstrated the correlation between 99mTc-MDP distributions and HAP distribution in the tumor (please see Fig. 3), we believe that it is mainly the presence of HAP that contributed to the observation of the uptake of 99mTc-MDP in the tumor, similar to the mechanisms of bone uptake of this radiotracer. In contrast, we did not observe liver uptake of 18F− since no HAP exists in the normal liver [19]. In the clinic, since the breast is relatively far from the liver, especially when using dedicated SPECT scanners, and since the radiotracer concentration in normal muscle tissue is significantly lower than that of tumor (please see Figs. 1 and 2), we do not expect liver uptake of the radiotracer to hinder the detection of the breast tumor. More importantly, we expect liver uptake of the radiotracer to cause spill-over artifacts into the breast image that could otherwise be interpreted as tumors.
While the fluorescence resolution is poor compared to SPECT imaging, our results demonstrate, for the first time, that FMT imaging using Osteosense 750EX is a useful nonradioactive technique for in vivo screening of breast tumors containing HAP. The poor resolution however, introduces limitations on this technique. In mammary fat pad mouse models of breast cancer, bone uptake of the fluorescence dye would probably hinder the ability to properly identify the tumors due to the visual overlap of the mammary fat pads with the skeletal bone in the images coupled with the low resolution of 3D fluorescence.
The additional FMT signals we observed around the spine extending from the rib cage and liver to the rectum (please see Fig. 4) are most likely rib bones, kidneys, and GI clearance starting from the gallbladder as well as urine extending from the kidneys to the bladder. Osteosense 750EX is a targeted fluorescent in vivo biphosphonate imaging agent where the phosphonate component of the probe, PO(OH)2, is an effective chelating agent for calcium, magnesium, and other divalent and trivalent cations [22]. The mice were fed normal mouse chow 5001 (LabDiet, St. Louis, MO) which are rich in alfalfa, calcium, and magnesium. In addition, autofluorescence has been observed in these types of diets in living mice especially in the NIR range [23]. An alfalfa free diet could potentially reduce GI background signal.
In Table 1, we compare the three different methods: 18F-NaF PET (from our previous study [19]), 99mTc-MDP SPECT, and Osteosense 750EX FMT for HAP imaging in breast cancer. Although the tumor to muscle ratio in the SPECT data (44.4 ± 40.3) was higher than that of the PET data (3.6 ± 1.4), this difference was not significant (p > 0.05) due to the large error bars on the SPECT ratio. The presence of 18F− in muscle is mainly due to continuous and rapid reperfusion of 18F− between normal tissue and blood in a state of equilibrium. Free 18F− is filtered through the glomeruli and undergoes tubular reabsorption. Therefore, renal clearance of 18F− depends on overall urinary flow [24]. The mice in our PET study were imaged for over 60 min with a simultaneous injection of 18F-NaF and were under anesthesia for the entire time. Thus, urinary flow was hindered and 18F− would have been filtered back into the blood stream. On the other hand, renal clearance of 99mTc-MDP depends on phosphate concentration and pH and the mice were allowed to stay conscious in their caged for 60min post 99m Tc-MDP administration. The lack of reperfusion in the SPECT study may explain why the value of 99mTc-MDP in muscle was nearly nil (0.05 ± 0.04) where this value may just be due to scatter background. Thus tumor-to-muscle ratio of 99mTc-MDP approaches infinity and may not be a good quantitative measure. This is especially the case for Osteosense 750EX FMT imaging as no FMT signal was observed in the muscle. The bone-to-tumor ratio may be a better representative value in comparing the different modalities quantitatively. This ratio was 5.1 ± 2.3 for SPECT, 10.7 ± 3.3 for PET, and 8.8 ± 2.2 for FMT. All three ratios are within the error bars of one another. The lower uptake of 99mTc-MDP in bone compared to PET is perhaps due to the reasons mentioned above regarding reperfusion and renal clearance and due to a couple of other factors: (i) distribution of 99mTc-MDP injected dose mainly in the bone, tumor and liver while 18F− was mainly found in bone and tumor; and (ii) more importantly, 18F− binds to HAP in the entire bone while 99mTc-MDP is physicochemical adsorbed only at the mineralization front of bone (osteoid) and at the osteocytes lacunae but not near osteoclasts [24].
Table 1.
Comparison of n vivo bone-targeting agents' concentration in tumor, muscle and bone.
| Imaging modality | Imaging agent | Agent concentration in (mean ± SD)a | ||
|---|---|---|---|---|
| Tumor | Muscle | Bone | ||
| PET | 18F-NaF | 2.9 ± 0.8 | 0.8 ± 0.2 | 31 ± 4 |
| SPECT | 99mTc-MDP | 2.22 ± 0.95 | 0.05 ± 0.04 | 11.34 ± 1.46 |
| FMT | Osteosense 750EX | 0.04 ± 0.01 | N/Ab | 0.35 ± 0.07 |
PET and SPECT agent concentration units are in %ID/cc. FMT agent concentration unit is picomoles.
No FMT signal was observed in normal muscle.
Taken all together, while bone uptake of 99mTc-MDP and Osteosense 750EX was higher than tumor uptake, of more importance is that the results from this study and the previous one on 18F-NaF PET provide evidence that bone-targeting agents can be used for diagnosis of breast cancer via targeting the early stages of microcalcification. This may be accomplished even before solid calcium deposits, similar to that shown in Fig. 5, can be resolved in a mammogram or CT and therefore, may allow for early intervention. While CT resolution exceeds SPECT or FMT resolution, only solid calcium deposits can be detected with x-ray and not micro-HAP lattices. On the other hand, 99mTc-MDP SPECT imaging, Osteosense 750EX FMT imaging, or 18F-NaF PET imaging (as demonstrated in Ref. [19]) can be used to detect HAP presence before the solid calcium deposits are formed. Furthermore, it is still unclear how exactly these calcium deposits form. We hypothesize that it may be due to clustering of HAP lattices as tumor grows and more HAP is produced.
We did not carry out studies to demonstrate the difference (if any) of 99mTc-MDP or Osteosense 750EX in tumors with calcium oxylate to compare to tumors with HAP due to lack of CO tumor models. Cox et al. [7] demonstrated that the benign breast cell line, MCF10a, may contain CO and no HAP. We have exhausted every method to grow MCF10a cells in mice. However, due to the benign nature of this cell line, our attempts at creating xenograft mouse models with MCF10a failed. Since 99mTc-MDP molecules are aggregated in the presence of calcium, we would predict that uptake of this radiotracer would also be observed in breast tumors containing calcium deposits resulting from CO. The very presence of calcium in a molecule could cause the aggregation on 99mTc-MDP. On the other hand, there is no direct evidence that 99mTc-MDP had been successfully used to detect kidney stones, which compose mainly of CO, in vivo. Therefore, whether 99mTc-MDP SPECT imaging can be used to distinguish between benign breast lesions containing only CO and malignant lesions containing HAP remains to be investigated on human patients which is the subject of our future work. Since 99mTc-MDP is already FDA approved and is typically used in the clinic for bone imaging, translation to the clinic for breast cancer imaging can be rapid. In the clinic the breast is relatively far from the liver and the rib cage. Therefore, it is unlikely to observe spill over artifacts into the breast region from the liver and ribs. The detectability of breast tumors using 99mTc-MDP may be enhanced even further when combined with dedicated breast SPECT imaging systems with enhanced spatial resolution and sensitivity, as well as reduced background, compared to whole-body scanners [25]. In contrast, Osteosense 750EX is not currently approved for clinical use. Therefore, Osteosense 750EX FMT imaging for now is limited to animal research.
5. Conclusion
We have demonstrated that bone-targeting agents coupled with in vivo imaging can be used to noninvasively identify intra-tumoral calcifications in a murine model of triple negative breast cancer via targeting HAP within the tumor microenevironement. In the clinic, we propose the use of 99mTc-MDP SPECT imaging in adjunct to mammograms to assist in the diagnosis of suspicious lesions. As microcalcifications may be a sign of precancerous cells or early stage breast cancer, 99mTc-MDP SPECT or 18F-NaF PET imaging as outlined in this work and previous (depending on modality and radiotracer availability) provides promising preliminary evidence of potentially being effective methods of early breast cancer detection. Specifically, if a lesion is detected in mammograms while no solid calcium deposits were observed, and biopsy is not feasible or the lesion appears to be multicentric, then 99mTc-MDP SPECT or 18F-NaF PET imaging can be used. If the radiotracer observed in the legion, then it would be a strong indication of the presence of microcalcification and that the lesion may be tumorigenic.
For now, Osteosense 750EX is not approved for clinical use and can be used as an alternative to 99mTc-MDP SPECT or 18F-NaF PET imaging in animal research settings only.
Acknowledgments
We would like to thank Zou Yue for animal support. We thank the National Institutes of Health for funding via NCI R01CA138599, NCI P30 CA68485, NCI P50CA098131, and NCI P30 CA68485. We thank the Kleberg Foundation for their generous support of our Imaging Program.
References
- 1.Baker R, Rogers KD, Shepard N, Stone N. New relationships between breast microcalcifications and cancer. Br J Cancer. 2010;103:1034–1039. doi: 10.1038/sj.bjc.6605873. [DOI] [PMC free article] [PubMed] [Google Scholar]
- 2.Gershon-Cohen J. The importance of x-ray microcalcifications in breast cancer. Am J Roentgenol Radium Ther Nucl Med. 1967;99:1010–1011. doi: 10.2214/ajr.99.4.1010. [DOI] [PubMed] [Google Scholar]
- 3.Malar E, Kandaswamy A, Chakravarthy D, Giri Dharan A. A novel approach for detection and classification of mammographic microcalcifications using wavelet analysis and extreme learning machine. Comput Biol Med. 2012;42:898–905. doi: 10.1016/j.compbiomed.2012.07.001. [DOI] [PubMed] [Google Scholar]
- 4.Ketcham AS, Moffat FL. Vexed surgeons, perplexed patients, and breast cancers which may not be cancer. Cancer. 1990;65:387–393. doi: 10.1002/1097-0142(19900201)65:3<387::aid-cncr2820650302>3.0.co;2-y. [DOI] [PubMed] [Google Scholar]
- 5.Holme TC, Reis MM, Thompson A, Robertson A, Parham D, Hickman P, et al. Is mammographic microcalcification of biological significance? Eur J Surg Oncol. 1993;19:250–253. [PubMed] [Google Scholar]
- 6.Morgan MP, Cooke MM, Christopherson PA, Westfall PR, McCarthy GM. Calcium hydroxyapatite promotes mitogenesis and matrix metalloproteinase expression in human breast cancer cell lines. Mol Carcinog. 2001;32:111–117. doi: 10.1002/mc.1070. [DOI] [PubMed] [Google Scholar]
- 7.Cox RF, Hernandez-Santana A, Ramdass S, McMahon G, Harmey JH, Morgan MP. Microcalcifications in breast cancer: novel insights into the molecular mechanism and functional consequence of mammary mineralisation. Br J Cancer. 2012;106:525–537. doi: 10.1038/bjc.2011.583. [DOI] [PMC free article] [PubMed] [Google Scholar]
- 8.Haka AS, Shafer-Peltier KE, Fitzmaurice M, Crowe J, Dasari RR, Feld MS. Identifying microcalcifications in benign and malignant breast lesions by probing differences in their chemical composition using Raman spectroscopy. Cancer Res. 2002;62:5375–5380. [PubMed] [Google Scholar]
- 9.Morgan MP, Cooke MM, McCarthy GM. Microcalcifications associated with breast cancer: an epiphenomenon or biologically significant feature of selected tumors? J Mammary Gland Biol Neoplasia. 2005;10:181–187. doi: 10.1007/s10911-005-5400-6. [DOI] [PubMed] [Google Scholar]
- 10.Frappart L, Boudeulle M, Boumendil J, Lin HC, Martinon I, Palayer C, et al. Structure and composition of microcalcifications in benign and malignant lesions of the breast: study by light microscopy, transmission and scanning electron microscopy, microprobe analysis, and x-ray diffraction. Hum Pathol. 1984;15:880–889. doi: 10.1016/s0046-8177(84)80150-1. [DOI] [PubMed] [Google Scholar]
- 11.Radi MJ. Calcium oxalate crystals in breast biopsies. An overlooked form of microcalcification associated with benign breast disease. Arch Pathol Lab Med. 1989;113:1367–1369. [PubMed] [Google Scholar]
- 12.Muttarak M, Kongmebhol P, Sukhamwang N. Breast calcifications: which are malignant? Singap Med J. 2009;50:907–913. [quiz 14] [PubMed] [Google Scholar]
- 13.Schreera I, Lüttgesb J. Precursor lesions of invasive breast cancer. Eur J Radiol. 2005;54:62–71. doi: 10.1016/j.ejrad.2004.11.014. [DOI] [PubMed] [Google Scholar]
- 14.Czernin J, Satyamurthy N, Schiepers C. Molecular mechanisms of bone 18F-NaF deposition. J Nucl Med. 2010;51:1826–1829. doi: 10.2967/jnumed.110.077933. [DOI] [PMC free article] [PubMed] [Google Scholar]
- 15.Blau M, Ganatra R, Bender MA. 18F-fluoride for bone imaging. Semin Nucl Med. 1972;2:31–37. doi: 10.1016/s0001-2998(72)80005-9. [DOI] [PubMed] [Google Scholar]
- 16.Kanishi D. 99mTc-MDP accumulation mechanisms in bone. Oral Surg Oral Med Oral Pathol. 1993;75:239–246. doi: 10.1016/0030-4220(93)90100-i. [DOI] [PubMed] [Google Scholar]
- 17.Biersack H-J, Freeman LM. Clinical nuclear medicine. Berlin Heidelberg New York: Springer-Verlag; 2007. [Google Scholar]
- 18.Zilberman Y, Kallai I, Gafni Y, Pelled G, Kossodo S, Yared W, et al. Fluorescence molecular tomography enables in vivo visualization and quantification of nonunion fracture repair induced by genetically engineered mesenchymal stemcells. J Orthop Res. 2008;26:522–530. doi: 10.1002/jor.20518. [DOI] [PubMed] [Google Scholar]
- 19.Wilson GH, III, Gore JC, Yankeelov TE, Barnes S, Peterson TE, True JM, et al. An approach to breast cancer diagnosis via PET imaging of microcalcifications using 18F-NaF. J Nucl Med. 2014;55:1138–1143. doi: 10.2967/jnumed.114.139170. [DOI] [PMC free article] [PubMed] [Google Scholar]
- 20.Loening AM, Gambhir SS. AMIDE: a free software tool for multimodality medical image analysis. Mol Imaging. 2003;2:131–137. doi: 10.1162/15353500200303133. [DOI] [PubMed] [Google Scholar]
- 21.Palmer AM, Watt I, Dieppe PA. Soft-tissue localization of 99mTc-hydroxymethylene diphosphonate due to interaction with calcium. Clin Radiol. 1992;45:326–330. doi: 10.1016/s0009-9260(05)80085-6. [DOI] [PubMed] [Google Scholar]
- 22.Figueiredo JL, Passerotti CC, Sponholtz T, Nguyen HT, Weissleder R. A novel method of imaging calcium urolithiasis using fluorescence. J Urol. 2008;179:1610–1614. doi: 10.1016/j.juro.2007.11.100. [DOI] [PubMed] [Google Scholar]
- 23.Inoue Y, Izawa K, Kiryu S, Tojo A, Ohtomo K. Diet and abdominal autofluorescence detected by in vivo fluorescence imaging of living mice. Mol Imaging. 2008;7:21–27. [PubMed] [Google Scholar]
- 24.Wong KK, Piert M. Dynamic bone imaging with 99mTc-labeled diphosphonates and 18F-NaF: mechanisms and applications. J Nucl Med. 2013;54:590–599. doi: 10.2967/jnumed.112.114298. [DOI] [PubMed] [Google Scholar]
- 25.Tornai MP, Bowsher JE, Archer CN, Peter J, Jaszczak RJ, MacDonald LR, et al. A 3D gantry single photon emission tomograph with hemispherical coverage for dedicated breast imaging. Nucl Instrum Meth A. 2003;497:157–167. [Google Scholar]


