

Abstract
Background
Few studies have discussed the emergency call and prehospital care as a continuous process to decrease the prehospital and in‐hospital delays for acute stroke. To identify features associated with early hospital arrival (<90 minutes) and treatment (<120 minutes), we analyzed the operation of current dispatch protocol and emergency medical services and compared stroke recognition by dispatchers and ambulance crews.
Methods and Results
This was a 2‐year prospective observational study. All stroke patients who were transported to the hospital by emergency medical services and received recanalization therapy were recruited for the study. For a sample of 308 patients, the stroke code was activated in 206 (67%) and high priority was used in 258 (84%) of the emergency calls. Emergency medical services transported 285 (93%) of the patients using the stroke code and 269 (87%) using high priority. In the univariate analysis, the most dominant predictors of early hospital arrival were transport using stroke code (P=0.001) and high priority (P=0.002) and onset‐to‐call (P<0.0001) and on‐scene times (P=0.052). In the regression analysis, the influences of high‐priority transport (P<0.01) and onset‐to‐call time (P<0.001) prevailed as significant in both dichotomies of early arrival and treatment. The on‐scene time was found to be surprisingly long (>23.5 minutes) for both early and late‐arriving patients.
Conclusions
Fast emergency medical services activation and ambulance transport promoted early hospital arrival and treatment. Although patient‐dependent delays still dominate the prehospital process, it should be ensured that the minutes on the scene are well spent.
Keywords: emergency medical services, stroke, time factors
Introduction
Imperatives in efficient stroke chain of survival include low threshold for suspicion, fast on‐scene evaluation of cardinal symptoms, and immediate ambulance transport of patients deemed candidates for stroke thrombolysis. Using emergency medical services (EMS) reportedly expedites early hospital arrival and increases the likelihood of receiving intravenous thrombolysis.1, 2 One of the least investigated elements of this chain is the emergency phone call that activates the EMS system. Numerous reports have described the diversity of the emergency call contents, which reflect the tremendous challenge of conceiving a sudden bodily sensation or sign as representing a stroke symptom and a medical emergency.3, 4, 5 In the EMS system, sensitivity and specificity rates ≥90% have optimally been reached by the ambulance paramedics depending on the different algorithms used to identify stroke patients6, 7, 8; however, the successful identification of stroke patients during the emergency calls has been variable, ranging from 31% to 83% in different EMS systems.4, 9, 10
Although the emergency call and how it is handled compose the vital initiating link of the whole chain of survival, few studies have reported the role of emergency call processing in decreasing prehospital delay or increasing the likelihood of early treatment.3, 11 Although the door‐to‐treatment time in Helsinki, Finland, has been cut from 86 minutes to only 18 minutes, it has proven difficult to cut the onset‐to‐door time (ODT) from the mean of 74 minutes reported for our patients between 1998 and 2001.12, 13, 14, 15 This led to us to evaluate how emergency medical dispatchers perform in emergency call processing and identification of acute stroke patients receiving intravenous thrombolysis, using the current national dispatch guidelines. We also compared the use of the FAST (face, arm, speech, time) test6 by the dispatchers during the emergency call and the EMS personnel on the scene to identify those features of the dispatch process and prehospital care that are independently associated with early hospital arrival and recanalization treatment.
Methods
The Study Setting
Helsinki University Hospital (HUH) provides tertiary care to a population of 1.6 million inhabitants of the Helsinki metropolitan area. The 65‐bed emergency department (ED) is responsible for all neurological emergencies 24 hours a day. Since the start of the routine application of stroke thrombolysis in 1995, HUH has been the only comprehensive stroke center in the region. Key quality metrics such as stroke severity, ODT, door‐to‐treatment time, onset‐to‐treatment time (OTT), and outcome have been systematically registered since the beginning12; however, patients who do not receive recanalization therapy are not entered to any registry.
Emergency Call Processing
In the HUH area, all emergency phone calls are handled by a regional emergency medical communication center. When responding to a “112” call, the dispatcher should quickly ascertain the site address and the nature of the emergency. For acute stroke, the dispatcher screens for symptoms according to the FAST algorithm and some common stroke‐associated complaints to make the dispatch decision. Based on the protocol algorithm, a single positive FAST criterion suffices for ambulance dispatch using the symptom code for stroke and acute onset of <5 hours ago to dispatch using high priority (ie, lights and sirens). Callers are urged to redial 112, especially if the nearest ambulance is far away or the symptoms deteriorate or vanish.
The Prehospital Assessment
The EMS in the HUH area is provided by 3 city‐based fire departments with common stroke care guidelines. On the scene, the ambulance crew interviews the patient and bystanders and conducts a quick neurological examination using the FAST algorithm. Blood pressure, oxygen saturation, Glasgow Coma Scale score, tympanic temperature, and blood glucose are measured. An intravenous line is set for fluid therapy and enables later contrast agent administration. If the patient's symptoms clearly fit acute stroke and started <5 hours earlier, a prenotification phone call is placed to the ED staff on prompt high‐priority transport. Atypical symptoms can be discussed on the telephone with an EMS physician or directly with hospital stroke neurologist. The EMS uses an electronic patient reporting system that stores all prehospital patient reports in a common database.16
The Cohort
This prospective, consecutive, population‐based, observational cohort received recanalization therapy between January 1, 2010, and December 31, 2011. The study plan was approved by the departments of neurology and surgery at HUH. Because the study was register based, no additional informed consent or ethics review board approval was required. The patients’ medical records at HUH were combined with prehospital patient records retrieved from the Merlot Medi (CGI Group Inc) electronic patient reporting database and with the emergency call discussions from the national Emergency Response Center administration database. All authentic discussions were audited meticulously 2 times by the lead author (T.P.) and evaluated in terms of the dispatch guidelines. The resulting information was cross‐checked with the prehospital patient reports and hospital records. Electronic time stamps were registered for estimated symptom onset, beginning and end of the emergency call, ambulance dispatch, ambulance arrival on the scene, beginning of patient transport, hospital arrival, and tissue plasminogen activator administration. The emergency call and ambulance dispatch–related time stamps were registered automatically. The on‐scene arrival, transport, and hospital arrival–related time stamps were registered manually by the EMS by tapping the mobile electronic patient reporting computer and by the hospital stroke neurologist administering the tissue plasminogen activator. Operative time delays were calculated using the time stamps acquired. If several emergency phone calls were made for the same case, the onset‐to‐call time was based on the time stamp of the first call. We excluded all non‐EMS admissions such as taxi transportation and walk‐ins, those transported to HUH from other health care institutions, those with no available electronic patient reporting data, and those with missing or incomplete emergency call discussions.
Statistical Analysis
The patients were categorized based on early or late hospital arrival and treatment. An ODT of ≤90 minutes was considered an early hospital arrival, and an OTT of ≤120 minutes was considered early treatment. The cutoff values were selected based on the earlier reported pretreatment time intervals from the study setting,13, 14, 15 suggestions from the available literature,17, 18 and the distribution of the obtained data (median values). Mann–Whitney U, Fisher exact, and Student t tests were used for comparison of study groups (early versus late ODT/OTT) in univariate analysis, as appropriate. Variables connected to EMS system operation with >90% available data and a univariate P<0.2 were selected for binary logistic regression analyses. Two‐tailed significance was considered at P<0.05. The statistical analysis was performed using SPSS version 21 (IBM Corp).
Results
A total of 308 patients fulfilled the study entry criteria (Figure 1), with characteristics provided in Table 1. In the bivariate analysis, the most dominant predictors of early hospital arrival and treatment were transport with stroke code, transport using high priority, and short onset‐to‐call and on‐scene times (OST) (Tables 2 and 3). Regarding the FAST algorithm symptoms, observing arm weakness in the paramedic examination clearly expedited the arrival. Although the call‐to‐alarm and ambulance response times were significantly shorter for early arrivals, the time differences were rather insignificant (<1 minute). In contrast, OST was long (>23.5 minutes) for both early and late‐arriving patient groups. We also calculated the mean additive delays from the analyzed EMS operational steps to the fraction of patients who missed the early OTT <2 hours. Although the paramount additional delay was added onset‐to‐call time (41 minutes), the single most dominant operational variable in the average additional delays was the OST, with >2 minutes of added delay (Table 3, Figure 2).
Figure 1.

Description of the patient sample.
Table 1.
Characteristics of the Study Sample
| Parameter | n | All Patients |
|---|---|---|
| Age, y | 308 | 68 (13) |
| Men, % | 308 | 55.2 |
| NIHSS, points | 303 | 8 (5–14) |
| Vertebrobasilar stroke, % | 308 | 8.8 |
| Onset‐to‐call time, min | 289 | 14 (2–47) |
| Call duration, min | 308 | 3 (2–4) |
| Call‐to‐dispatch time, min | 307 | 3 (2–4) |
| Ambulance response time, min | 304 | 7 (6–10) |
| On‐scene time, min | 284 | 24 (19–31) |
| Transport time, min | 124 | 24 (16–30) |
| Onset‐to‐door time, min | 308 | 82 (59–140) |
| Door‐to‐treatment time, min | 306 | 20 (14–36) |
| Onset‐to‐treatment time, min | 306 | 118 (78–173) |
| Facial droop discussed (in the emergency call), % | 308 | 38.6 |
| Arm weakness discussed, % | 308 | 54.2 |
| Speech disturbance discussed, % | 308 | 78.2 |
| Symptom onset time discussed, % | 308 | 86.7 |
| Ambulance dispatch code stroke, % | 308 | 66.9 |
| High priority dispatch, % | 308 | 83.8 |
| New call suggested, % | 307 | 46.3 |
| Facial droop examined (EMS), % | 308 | 83.8 |
| Arm weakness examined, % | 308 | 93.5 |
| Speech disturbance examined, % | 308 | 93.2 |
| Onset time examined, % | 308 | 97.1 |
| Prenotification given to emergency department, % | 308 | 63.6 |
| Ambulance transport using stroke code, % | 305 | 92.5 |
| Ambulance transport using high priority, % | 305 | 87.3 |
All data presented using mean (standard deviation) or median (interquartile range) unless stated otherwise. EMS indicates emergency medical services; min, minutes; NIHSS, National Institutes of Health Stroke Scale.
Table 2.
Dichotomic Analysis of Patient Characteristics in Terms of Early and Late Hospital Arrival
| Variable | n | ODT <90 minutes (n=180) | ODT >90 minutes (n=128) | P Value |
|---|---|---|---|---|
| Age, y | 308 | 68 (13) | 67 (13) | 0.414 |
| Men, % | 308 | 53.9 | 57.0 | 0.642 |
| NIHSS, points | 303 | 8 (5–14) | 7 (4–13) | 0.116 |
| Vertebrobasilar stroke, % | 308 | 6.1 | 12.5 | 0.08 |
| Call duration, min | 308 | 3 (2–4) | 3 (2–4) | 0.063 |
| Onset‐to‐call time, min | 289 | 6 (0–16) | 60 (18–104) | <0.0001 |
| Call‐to‐alarm time, min | 307 | 3 (2–4) | 3 (2–5) | 0.001 |
| Ambulance response time, min | 304 | 7 (5–9) | 8 (6–11) | 0.004 |
| On‐scene time, min | 284 | 24 (18–31) | 26 (20–32) | 0.052 |
| Transport time, min | 122 | 24 (14–30) | 23 (18–31) | 0.531 |
| Based on the emergency phone call, % | ||||
| Facial droop mentioned | 119 | 57.1 | 51.0 | 0.576 |
| Arm weakness mentioned | 167 | 80.2 | 64.8 | 0.033 |
| Speech disturbance mentioned | 241 | 92.3 | 91.8 | 1.000 |
| Stroke mentioned | 308 | 26.7 | 25.0 | 0.793 |
| Fall mentioned | 308 | 27.8 | 27.3 | 1.000 |
| Patient on the phone | 308 | 21.7 | 28.1 | 0.379 |
| New call suggested by the dispatcher | 307 | 49.2 | 42.2 | 0.247 |
| Ambulance dispatch using code stroke | 308 | 68.3 | 64.8 | 0.541 |
| Ambulance dispatch using high priority | 308 | 89.4 | 75.8 | 0.002 |
| Based on paramedic examination, % | ||||
| Facial droop present | 258 | 67.9 | 59.6 | 0.183 |
| Arm weakness present | 288 | 77.3 | 69.6 | 0.167 |
| Speech disturbance present | 287 | 83.2 | 82.5 | 0.874 |
| Previous stroke mentioned in the patient report | 308 | 11.1 | 9.4 | 0.707 |
| Prenotification given to emergency department | 308 | 66.1 | 60.2 | 0.247 |
| Ambulance transport using stroke code | 305 | 97.8 | 87.3 | 0.001 |
| Ambulance transport using high priority | 305 | 95.5 | 77.8 | <0.0001 |
All data presented using mean (standard deviation) or median (interquartile range) unless stated otherwise. NIHSS indicates National Institutes of Health Stroke Scale.
Table 3.
Dichotomic Analysis of Patient Characteristics in Terms of Early and Late Recanalization Treatment
| Variable | n | OTT <2 hours (n=163) | OTT >2 hours (n=143) | P Value |
|---|---|---|---|---|
| Age, y | 306 | 69 (13) | 67 (13) | 0.102 |
| Men, % | 306 | 52.1 | 58.7 | 0.252 |
| NIHSS, points | 302 | 8 (5–14) | 6 (3–13) | 0.020 |
| Vertebrobasilar stroke, % | 306 | 3.7 | 14.7 | 0.003 |
| Call duration, min | 306 | 3 (2–4) | 3 (2–4) | 0.115 |
| Onset‐to‐call time, min | 287 | 6 (0–16) | 47 (9–100) | <0.0001 |
| Call‐to‐alarm time, min | 305 | 3 (2–3) | 3 (2–5) | <0.0001 |
| Ambulance response time, min | 302 | 7 (5–9) | 8 (6–10) | 0.035 |
| On‐scene time, min | 282 | 24 (17–30) | 26 (20–32) | 0.010 |
| Transport time, min | 122 | 21 (14–30) | 24 (19–32) | 0.094 |
| Based on the emergency phone call, % | ||||
| Facial droop | 119 | 58.7 | 50.0 | 0.362 |
| Arm weakness | 165 | 82.6 | 61.6 | 0.004 |
| Speech disturbance | 239 | 91.5 | 92.7 | 0.813 |
| Stroke mentioned | 306 | 25.8 | 25.9 | 1.000 |
| Fall mentioned | 306 | 28.2 | 26.6 | 0.798 |
| Patient on the phone | 306 | 23.3 | 25.9 | 0.705 |
| New call suggested by the dispatcher | 305 | 51.9 | 39.9 | 0.039 |
| Ambulance dispatch using code stroke | 306 | 70.6 | 62.9 | 0.181 |
| Ambulance dispatch using high priority | 306 | 90.2 | 76.2 | 0.001 |
| Based on paramedic examination, % | ||||
| Facial droop | 257 | 69.9 | 57.7 | 0.049 |
| Arm weakness | 286 | 83.3 | 62.9 | <0.0001 |
| Speech disturbance | 285 | 84.2 | 81.1 | 0.530 |
| Previous stroke mentioned in the patient report | 306 | 12.3 | 8.4 | 0.350 |
| Prenotification given to emergency department | 306 | 65.0 | 62.9 | 0.057 |
| Ambulance transport using stroke code | 303 | 98.8 | 87.2 | <0.0001 |
| Ambulance transport using high priority | 303 | 97.5 | 77.3 | <0.0001 |
All data presented using mean (standard deviation) or median (interquartile range) unless stated otherwise. NIHSS indicates National Institutes of Health Stroke Scale.
Figure 2.
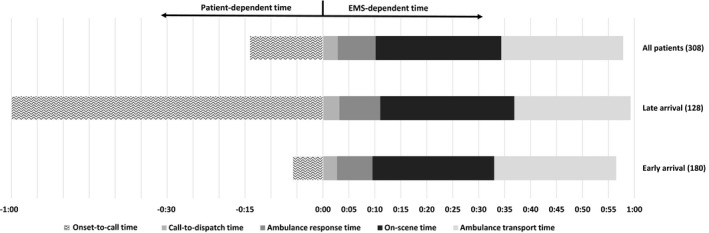
Sequential presentation of prehospital time intervals (median) of all patients shown together with patient groups arriving early (onset‐to‐door time <90 minutes) and late (onset‐to‐door time >90 minutes). Performance of emergency medical services (EMS) is similar, whereas the onset‐to‐call time varies significantly.
In the binary logistic regression analysis, the influences of transport using high priority and onset‐to‐call time prevailed as significant in both dichotomies of ODT <90 and OTT <120 minutes (Table 4). Because of a possible confounding effect between dispatcher and EMS variables, we reran the binary logistic models by removing either dispatcher or EMS variables, but this did not change the significance. For both end points (ODT and OTT), the onset‐to‐call time duration and high‐priority transport to the hospital were the most important determinants.
Table 4.
Backwards Logistic Regression Analyses for Selected Variables Associated With Early Hospital Arrival and Treatment
| Variable | P¹ | ODT <90 minutes | P² | OTT <2 hours |
|---|---|---|---|---|
| Age | — | — | 0.083 | 1.027 (0.996–1.059) |
| Onset‐to‐call time | <0.001 | 0.999 (0.998–0.999) | <0.001 | 0.999 (0.999–0.999) |
| Call duration | 0.09 | 0.991 (0.996–1.001) | — | — |
| New call suggested by the dispatcher | — | — | 0.037 | 2.235 (1.050–4.760) |
| Call‐to‐dispatch time | 0.139 | 0.997 (0.992–1.001) | 0.133 | 0.998 (0.995–1.001) |
| Dispatch‐to‐scene time | 0.001 | 0.997 (0.996–0.999) | 0.08 | 0.999 (0.998–1.000) |
| On‐scene time | 0.001 | 0.999 (0.998–0.999) | 0.09 | 0.999 (0.998–1.000) |
| Dispatch using high priority | 0.048 | 5.259 (1.017–27.195) | — | — |
| Arm weakness | — | — | 0.079 | 2.114 (0.918–4.869) |
| Transport using high priority | <0.001 | 0.084 (0.023–0.310) | 0.02 | 0.114 (0.028–0.462) |
Both regression models presented using P values and odds ratios (95% CI). All odds ratios for time intervals are based on change per minute. P¹=P value for ODT <90 minutes, P²=P value for OTT <2 hours. — indicates variable not included in the final model; ODT, onset‐to‐door time; OTT, onset‐to‐treatment time.
Discussion
The results of this study highlight the components of the prehospital phase that assign stroke patients to early and late management groups. The dispatchers used the stroke code in more than two‐thirds of the cases and high‐priority dispatch in >80%. The ambulance crews identified >90% of the stroke patients, and the rate of high‐priority transport remained only a small fraction below that (87%). These figures are among the highest reported for both emergency call processing and prehospital stroke care.18 Analysis of the prehospital time intervals revealed that prompt operation on the scene and use of high‐priority transport were key operational success features routing patients to the early categories of hospital arrival and recanalization treatment. Still, the delayed activation of the EMS remains the dominant holdup in the stroke chain of survival.
Because assignment to high priority and stroke code dispatch and transportation did not reach 100%, even in these eventually recanalized patients, and because they were significant predictors of early hospital arrival and treatment, there is still room for improvement. Then again, although the time intervals of emergency call processing were also highly significant predictors, only minute‐delay fractions could be attributed to them. Consequently, pushing stricter expedition of call processing by dispatchers might not boost performance. Shortening initial telephone interviews could, in fact, degrade diagnostic accuracy. Regarding EMS performance, the median OST in the sample was surprisingly long. Moreover, the OSTs in the late arrival and treatment groups were 2 minutes longer, which could indicate a decreased sense of urgency in cases in which the onset‐to‐call time was long to begin with. The OST duration in our hospital area also seemed to have increased compared with previous results.14 Several additional minutes potentially could be saved with relatively simple methods such as the implementation of a time limit for the on‐scene stay. OSTs as low as 15 to 18 minutes have been successfully achieved in recent studies19, 20; however, these reports did not discuss the duration of in‐hospital delays. The key to short door‐to‐needle time is to do as little as possible after the patient has arrived at the ED and as much as possible before that,13 which can frontload some inevitable delays to the OST. Caution is required in interpreting the results because too a tight time limit on the scene might result in inferior quality of patient examination and reporting, which does not remove the delay but rather transfers it to the ED process. Moreover, conducting some of the necessary emergency procedures during ambulance transport could endanger the safety of both patients and EMS personnel. Interestingly, using high‐priority dispatch, the stroke code or prenotification to the ED were not found to promote early hospital arrival or early stroke treatment; however, it must be remembered that the present sample was limited to patients who successfully received stroke treatment.
Onset‐to‐call time still overwhelmingly burdens the whole stroke chain of survival and was the single most important determinant of early hospital arrival and treatment (Tables 1 through 4). A fundamental question is how to influence patients’ immediate response. Because ad hoc community outreach education campaigns tend to achieve transient results with high cost,21 better stroke knowledge should perhaps be integrated into social programs and schooling systems instead of depending on patient associations. Stroke knowledge and identifying the patient's condition might not be factors as important in EMS activation as the caller's palpable sense of urgency22, 23; patients with severe symptoms arrive earlier.2, 14 Evaluating mild, atypical, or fluctuating symptoms and the callers’ hesitation to ask for help remain important challenges. It was interesting that the dispatcher's suggestion to call back in case of worsening state was associated with shorter OTT. This could mean that the dispatcher managed to single out those potentially severely ill patients who should also be treated fast by EMS on scene and rushed to ED management.
In the Finnish EMS system, unlike some international settings,4, 24 a rigid code‐specific algorithm is not applied when determining dispatch code and priority. This flexibility allows the dispatcher enough freedom to decrease delays when the caller spontaneously provides the key information. Consequently, we were surprised to find that the call‐to‐dispatch time significantly exceeded the recommended 90‐second limit in our national guidelines. This finding is important because both the call duration and the call‐to‐dispatch time were associated with early hospital arrival and treatment, respectively (Tables 2 and 3). Together with even longer reported delays, this finding may reflect the time‐consuming nature and associated difficulties of calls from stroke patients.3 Yet again, the additional time used in the dispatch process might have contributed to the relatively high frequency of use of the stroke code and high priority and thus may have benefited patient transportation.
The EMS had a high reporting rate for all FAST criteria, reflecting knowledge of our prehospital stroke scrutiny. Stroke recognition rate was high despite a fair proportion of vertebrobasilar stroke (9%). Unilateral arm weakness was the only FAST symptom associated with early treatment (Table 3) and suggests that a classical anterior circulation stroke is well recognized. Although patients were frequently transported using stroke code and high priority, slightly >60% prompted documented prenotification of the ED.
The study had some limitations. Because the sample was from a registry consisting primarily of thrombolysed patients, patients not considered for recanalization and nonstroke patients assigned the stroke code in the EMS system (false positives) could not be included. The sample was based on a single EMS system, and the results might not be generalizable to other settings. The record of FAST criteria had a number of missing values and often represented >1 symptom category simultaneously, which possibly reduced their weight as predictors. Alternatively, the natural evolution of stroke symptoms may have included fluctuation of FAST symptoms by the time the patients reached the ED and the stroke neurologist's examination.
Continuous monitoring of stroke quality metrics and implementation of quality improvement activities are essential features of a comprehensive stroke center. The collected information should be used to stimulate ongoing total quality management in line with the steps of the Deming cycle (plan, do, check, act). Motivated by the first European randomized controlled trials of recombinant tissue plasminogen activator, we reported the first cycle (1998–2001) of our “prelabel” recombinant tissue plasminogen activator stroke thrombolysis service12 and the second guided quality assurance cycle (1999–2004) to improve, primarily, in‐hospital delays.15 After confirming that door‐to‐needle time was reduced by 38 minutes associated with improved patient outcomes,14 these steps led to well‐known optimization of door‐to‐needle time <20 minutes by 2011 in Helsinki,13 allowing ultraearly recipients (OTT <70 minutes) of tissue plasminogen activator to gain the most independence.25
In conclusion, when the early OTT window of 120 minutes is missed, the average additional delay stems from the patient‐dependent onset‐to‐call time by an additional 41 minutes. Assuming that this delay and transport times (24 minutes) (Figure 2) cannot essentially be improved by honing of standard operational procedures, the largest remaining additional delay is OST (24 minutes). Consequently, we have embarked on a quality assurance project to ensure that all time on the scene is well spent.
Sources of Funding
This study was funded by Helsinki University Hospital (EVO), Finnish Medical Foundation, Finska Läkaresällskapet, Laerdal Foundation for Acute Medicine, Paavo Nurmi Foundation, and Sigrid Jusélius Foundation.
Disclosures
None.
(J Am Heart Assoc. 2016;5:e002808 doi: 10.1161/JAHA.115.002808)
References
- 1. Morris DL, Rosamond W, Madden K, Schultz C, Hamilton S. Prehospital and emergency department delays after acute stroke: the Genentech Stroke Presentation Survey. Stroke. 2000;31:2585–2590. [DOI] [PubMed] [Google Scholar]
- 2. Saver JL, Smith EE, Fonarow GC, Reeves MJ, Zhao X, Olson DM, Schwamm LH; GWTG‐Stroke Steering Committee and Investigators . The “golden hour” and acute brain ischemia: presenting features and lytic therapy in >30,000 patients arriving within 60 minutes of stroke onset. Stroke. 2010;41:1431–1439. [DOI] [PMC free article] [PubMed] [Google Scholar]
- 3. Handschu R, Poppe R, Rauss J, Neundörfer B, Erbguth F. Emergency calls in acute stroke. Stroke. 2003;34:1005–1009. [DOI] [PubMed] [Google Scholar]
- 4. Jones SP, Carter B, Ford GA, Gibson JME, Leathley MJ, McAdam JJ, O'Donnel M, Punekar S, Quinn T, Watkins CL; ESCORTT group . The identification of acute stroke: an analysis of emergency calls. Int J Stroke. 2012;8:408–412. [DOI] [PubMed] [Google Scholar]
- 5. Mosley I, Nicol M, Donnan G, Patrick I, Dewey H. Stroke symptoms and the decision to call for an ambulance. Stroke. 2007;38:361–366. [DOI] [PubMed] [Google Scholar]
- 6. Harbison J, Hossain O, Jenkinson D, Davis J, Louw SJ, Ford GA. Diagnostic accuracy of stroke referrals from primary care, emergency room physicians, and ambulance staff using the face arm speech test. Stroke. 2003;34:71–76. [DOI] [PubMed] [Google Scholar]
- 7. Bray JE, Martin J, Cooper G, Barger B, Bernard S, Bladin C. Paramedic identification of stroke: community validation of the melbourne ambulance stroke screen. Cerebrovasc Dis. 2005;20:28–33. [DOI] [PubMed] [Google Scholar]
- 8. Bergs J, Sabbe M, Moons P. Prehospital stroke scales in a Belgian prehospital setting: a pilot study. Eur J Emerg Med. 2010;17:2–6. [DOI] [PubMed] [Google Scholar]
- 9. Kothari R, Barsan W, Brott T, Broderick J, Ashbrock S. Frequency and accuracy of prehospital diagnosis of acute stroke. Stroke. 1995;26:937–941. [DOI] [PubMed] [Google Scholar]
- 10. Buck BH, Starkman S, Eckstein M, Kidwell CS, Haines J, Huang R, Colby D, Saver JL. Dispatcher recognition of stroke using the National Academy Medical Priority Dispatch System. Stroke. 2009;40:2027–2030. [DOI] [PMC free article] [PubMed] [Google Scholar]
- 11. Caceres JA, Adil MM, Jadhav V, Chaudhry SA, Pawar S, Rodriguez GJ, Suri MF, Qureshi AI. Diagnosis of stroke by emergency medical dispatchers and its impact on the prehospital care of patients. J Stroke Cerebrovasc Dis. 2013;22:e610–e614. [DOI] [PubMed] [Google Scholar]
- 12. Lindsberg PJ, Soinne L, Roine RO, Salonen O, Tatlisumak T, Kallela M, Häppölä O, Tiainen M, Haapaniemi E, Kuisma M, Kaste M. Community‐based thrombolytic therapy of acute ischemic stroke in Helsinki. Stroke. 2003;34:1443–1449. [DOI] [PubMed] [Google Scholar]
- 13. Meretoja A, Strbian D, Mustanoja S, Tatlisumak T, Lindsberg PJ, Kaste M. Reducing in‐hospital delay to 20 minutes in stroke thrombolysis. Neurology. 2012;79:306–313. [DOI] [PubMed] [Google Scholar]
- 14. Puolakka T, Väyrynen T, Häppölä O, Soinne L, Kuisma M, Lindsberg PJ. Sequential analysis of pretreatment delays in stroke thrombolysis. Acad Emerg Med. 2010;17:965–969. [DOI] [PubMed] [Google Scholar]
- 15. Lindsberg PJ, Häppölä O, Kallela M, Valanne L, Kuisma M, Kaste M. Door to thrombolysis: ER reorganization and reduced delays to acute stroke treatment. Neurology. 2006;67:334–336. [DOI] [PubMed] [Google Scholar]
- 16. Kuisma M, Väyrynen T, Hiltunen T, Porthan K, Aaltonen J. Effect of introduction of electronic patient reporting on the duration of ambulance calls. Am J Emerg Med. 2009;27:948–955. [DOI] [PubMed] [Google Scholar]
- 17. Lees KR, Bluhmki E, von Kummer R, Brott TG, Toni D, Grotta JC, Albers GW, Kaste M, Marler JR, Hamilton SA, Tilley BC, Davis SM, Donnan GA, Hacke W; ECASSA, ATLANTIS, NINDS and EPITHET et‐PA Study Group , Allen K, Mau J, Meier D, del Zoppo G, De Silva DA, Butcher KS, Parsons MW, Barber PA, Levi C, Bladin C, Byrnes G. Time to treatment with intravenous alteplase and outcome in stroke: an updated pooled analysis of ECASS, ATLANTIS, NINDS, and EPITHET trials. Lancet. 2010;375:1695–1703. [DOI] [PubMed] [Google Scholar]
- 18. Fassbender K, Balucani C, Walter S, Levine SR, Haass A, Grotta J. Streamlining of prehospital stroke management: the golden hour. Lancet. 2013;12:585–596. [DOI] [PubMed] [Google Scholar]
- 19. Patel MD, Brice JH, Moss C, Suchindran CM, Evenson KR, Rose KM, Rosamond WD. An evaluation of emergency medical services stroke protocols and scene times. Prehosp Emerg Care. 2014;18:15–21. [DOI] [PMC free article] [PubMed] [Google Scholar]
- 20. Simonsen S, Andresen M, Michelsen L, Viereck S, Lippert FK, Iversen H. Evaluation of prehospital transport time of stroke patients to thrombolytic treatment. Scand J Trauma Resusc Emerg Med. 2014;22:65 doi: 10.1186/s13049‐014‐0065‐z. [DOI] [PMC free article] [PubMed] [Google Scholar]
- 21. Hodgson C, Lindsay P, Rubini F. Can mass media influence emergency department visits for stroke? Stroke. 2007;38:2115–2122. [DOI] [PubMed] [Google Scholar]
- 22. Skolarus LE, Zimmerman MA, Murphy J, Brown DL, Kerber KA, Bailey S, Fowlkes S, Morgenstern LB. Community‐based participatory research: a new approach to engaging community members to rapidly call 911 for stroke. Stroke. 2011;42:1862–1866. [DOI] [PMC free article] [PubMed] [Google Scholar]
- 23. Mikulík R, Bunt L, Hrdlicka D, Dusek L, Václavík D, Kryza J. Calling 911 in response to stroke: a nationwide study assessing definitive individual behavior. Stroke. 2008;39:1844–1849. [DOI] [PubMed] [Google Scholar]
- 24. Krebes S, Ebinger M, Baumann AM, Kellner PA, Rozanski M, Doepp F, Sobesky J, Gensecke T, Leidel BA, Malzahn U, Wellwood I, Heuschmann PU, Audebert HJ. Development and validation of a dispatcher identification algorithm for stroke emergencies. Stroke. 2012;43:776–781. [DOI] [PubMed] [Google Scholar]
- 25. Strbian D, Soinne L, Sairanen T, Häppölä O, Lindsberg PJ, Tatlisumak T, Kaste M; Helsinki Stroke Thrombolysis Registry Group . Ultraearly thrombolysis in acute ischemic stroke is associated with better outcome and lower mortality. Stroke. 2010;41:712–716. [DOI] [PubMed] [Google Scholar]