Abstract
Background
Diabetes mellitus (DM) is associated with mitochondrial oxidative stress. We have shown that myocardial oxidative stress leads to diastolic dysfunction in a hypertensive mouse model. Therefore, we hypothesized that diabetes mellitus could cause diastolic dysfunction through mitochondrial oxidative stress and that a mitochondria‐targeted antioxidant (MitoTEMPO) could prevent diastolic dysfunction in a diabetic mouse model.
Methods and Results
C57BL/6J mice were fed either 60 kcal % fat diet (high‐fat diet [HFD]) or normal chow (control) for 8 weeks with or without concurrent MitoTEMPO administration, followed by in vivo assessment of diastolic function and ex vivo studies. HFD mice developed impaired glucose tolerance compared with the control (serum glucose=495±45 mg/dL versus 236±30 mg/dL at 60 minutes after intraperitoneal glucose injection, P<0.05). Myocardial tagged cardiac magnetic resonance imaging showed significantly reduced diastolic circumferential strain (Ecc) rate in the HFD mice compared with controls (5.0±0.3 1/s versus 7.4±0.5 1/s, P<0.05), indicating diastolic dysfunction in the HFD mice. Systolic function was comparable in both groups (left ventricular ejection fraction=66.4±1.4% versus 66.7±1.2%, P>0.05). MitoTEMPO‐treated HFD mice showed significant reduction in mitochondria reactive oxygen species, S‐glutathionylation of cardiac myosin binding protein C, and diastolic dysfunction, comparable to the control. The fasting insulin levels of MitoTEMPO‐treated HFD mice were also comparable to the controls (P>0.05).
Conclusions
MitoTEMPO treatment prevented insulin resistance and diastolic dysfunction, suggesting that mitochondrial oxidative stress may be involved in the pathophysiology of both conditions.
Keywords: diastolic dysfunction, insulin resistance, mitochondrial oxidative stress
Subject Categories: Animal Models of Human Disease, Oxidant Stress, Contractile function, Heart Failure, Metabolic Syndrome
Introduction
Approximately half of patients with heart failure have a preserved ejection fraction,1, 2 and their prognosis is as poor as those with heart failure with reduced ejection fraction. Currently, there is no specific treatment for this condition. Although diastolic dysfunction appears to play an important role, there has been poor understanding of the underlying pathophysiology.2 Several epidemiologic studies have shown that type 2 diabetes mellitus (DM) and hypertension are closely associated with heart failure with preserved ejection fraction.3, 4
We have shown that increased oxidative stress in cardiomyocytes causes S‐glutathionylation of the myofibrillar protein, cardiac myosin binding protein C (cMyBP‐C), leading to hypertension‐induced diastolic dysfunction.5 Administration of tetrahydrobiopterin (BH4), a cofactor of nitric oxide synthase (NOS), can prevent S‐glutathionylation of cMyBP‐C and diastolic dysfunction.6 Furthermore, we have shown that other conditions that can increase oxidative stress in cardiomyocytes, such as angiotensin II exposure and mitochondrial manganese superoxide dismutase (MnSOD) depletion, also lead to diastolic dysfunction.5
Mitochondrial oxidative stress plays a major role in the pathophysiology of type 2 DM and its complications.7, 8 In humans and animal models, insulin resistance and type 2 DM are associated with increased production of free radicals or impaired antioxidant defenses.7, 8, 9 Therefore, we hypothesized that DM leads to mitochondrial oxidative stress in cardiomyocytes and S‐glutathionylation of cMyBP‐C, leading to diastolic dysfunction.
Methods
High‐Fat Diet (HFD)–Induced Obesity and Insulin Resistance
Animal care and interventions were provided in accordance with the National Institutes of Health Guide for the Care and Use of Experimental Animals, and all animal protocols were approved by the Institutional Animal Care and Use Committees of the University of Illinois at Chicago and Lifespan. Six‐week‐old male C57BL6/J mice were purchased from Jackson Laboratory (Bar Harbor, MA). The HFD group was fed 60 kcal % fat diet (Research Diets Inc, New Brunswick, NJ) for 8 weeks. The age‐ and gender‐matched control group was fed normal chow (Harlan, Indianapolis, IN) for 8 weeks. MitoTEMPO (2‐(2,2,6,6‐tetramethyl‐piperidin‐1‐oxyl‐4‐ylamino)‐2‐oxoethyl‐triphenylphosphonium chloride) was administered at 0.5 mg/kg twice a day intraperitoneally for 8 weeks while mice continued HFD. Pioglitazone was administered at 30 mg/kg by oral lavage once a day for 8 weeks. Following 8 weeks of HFD, mice underwent cardiac magnetic resonance (CMR) followed by euthanasia to harvest tissues for ex vivo studies. Body weight and food intake were determined weekly for 8 weeks during the midportion of the light cycle. Preweighed food was placed in the food hoppers and measured on a per‐cage basis every week. Food intake was determined as grams consumed per day.
Measurement of Plasma Glucose and Insulin
Serum glucose levels were measured by a glucometer (ACCU‐CHEK; Roche Applied Science, Indianapolis, IN) after drawing blood from the tail vein. After euthanasia, blood was also collected by cardiac puncture and centrifuged to separate plasma. Plasma insulin level was measured using an enzyme‐linked immunosorbent assay kit (Millipore, Billerica, MA). Glucose tolerance test was performed after 8‐hour fasting.
Myocardial Tagged Magnetic Resonance Imaging
While mice were receiving general anesthesia using 1% to 1.5% isoflurane, myocardial tagged CMR was performed on a 600‐MHz Bruker Avance console (Bruker Biospin, Billerica, MA) equipped with an actively shielded 14.1‐T, 89‐mm‐bore vertical magnet and a 1000‐mT/m, 110‐μs rise‐time microimaging gradient system.10 Three short‐axis cine slices (1 mm thickness) were acquired covering the entire left ventricle (LV) with cardiac and respiratory gating. From these cine images, LV volume and mass were calculated by contouring the endo‐ and epicardium using Osirix imaging software (Geneva, Switzerland). In addition, these cine images allowed accurate timing of end‐systole, which was defined as the smallest LV cavity volume. A myocardial tagged midventricular short‐axis image was obtained using a cardiac‐ and respiratory‐gated spatial modulation of magnetization sequence.11 After tagging‐grid generation, multiple tagged‐images were acquired from end systole throughout LV diastole with a temporal resolution of 5 ms. Image analyses were processed using Matlab (MathWorks, Natick, MA). Serial motions of the tagging grids were tracked manually. Deformed tagging square‐like elements were divided into 2 adjacent triangles for homogeneous strain calculations from the reference time point of end‐systole.12, 13 Maximal circumferential strain rate (Ecc) rate during the rapid filling phase was calculated to assess diastolic function.14, 15
Echocardiography
Mitral inflow velocity (E) and longitudinal tissue velocity of the mitral anterior annulus (E′) were assessed in the subcostal 4‐chamber view using a Vevo 770 high‐resolution in vivo imaging system (Visual Sonics, Toronto, Canada).6 During the image acquisition, mice were anesthetized with 1% to 1.5% isoflurane so that a heart rate of 350 to 390 beats/min was maintained.
Invasive Hemodynamic Measurement
With mice under the general anesthesia using 1% to 1.5% isoflurane, a pressure‐volume catheter was inserted into the right common carotid artery and advanced into the LV. Inferior vena cava occlusion was performed via a diaphragm incision. Following calibration of volume and parallel conductance, baseline hemodynamic measurements were obtained. Multiple pressure‐volume loops were acquired during compression of the inferior vena cava. End‐diastolic pressure volume relationship was calculated using linear regression.5
Assessment of Mechanical Properties of Cardiomyocytes
Hearts were excised from anesthetized mice and perfused with buffer (NaCl 113, KCl 4.7, Na2HPO4 0.6, KH2PO4 0.6, MgSO4 1.2, Phenol Red 0.032, NaHCO3 12, KHCO3 10, HEPES 10, and taurine 30, 2‐3‐butanedione monoxime 10 mmol/L) and digested with collagenase II (Worthington Biochemical Co., Lakewood, NJ) for 10 minutes at 37°C (N=6–8 in each group, 5–10 myocytes in each mouse). Following washing with control buffers (NaCl 133.5, KCl 4, Na2HPO4 1.2, HEPES 10, MgSO4 1.2 mmol/L and 0.1% BSA) at serially increasing Ca2+ concentrations (0.2, 0.5, and 1 mmol/L), cardiomyocytes were suspended in Modified Eagle's Medium with 1% insulin‐transferrin‐selenium, 0.1% BSA, and 1% glucose in a 95% O2/5% CO2 incubator at 37°C.6
The mechanical properties of cardiomyocytes were assessed using an IonOptix Myocam System (IonOptix Inc., Milton, MA).16 Unloaded cardiomyocytes placed on a glass slide for 5 minutes were imaged with an inverted microscope and perfused with a normal Tyrode's buffer (NaCl 133, KCl 5.4, MgCl2 5.3, Na2PO4 0.3, HEPES 20, glucose 10 mmol/L, pH 7.4) containing 1.2 mmol/L calcium held at 37°C with a temperature controller. Cardiomyocytes were paced with 10 V, 4‐ms square‐wave pulses at 1.0 Hz, and sarcomere shortening and relengthening were assessed using the following indices: diastolic sarcomere length (μm), peak fractional shortening (%), relaxation time constant τ (calculated as a0+a1et/τ where t=time, s), relengthening time (s), and maximum relaxation velocity (dL/dt, μm/s).
Cardiomyocytes were loaded with 1 μmol/L fura 2‐acetoxymethyl (AM) ester for 15 minutes and de‐esterized for additional 15 minutes at 37°C. After loading, cells were washed twice and then imaged with an inverted microscope. To mimic HFD conditions, cells were perfused with a modified Tyrode's buffer containing 1.2 mmol/L calcium, 1.0 mmol/L pyruvate, and 1% fatty acids mixture (Sigma‐Aldrich) including 2 ng/mL arachidonic and 10 ng/mL each linoleic, linolenic, myristic, oleic, palmitic and stearic, 0.22 μg/mL cholesterol from New Zealand sheep's wool, 2.2 μg/mL Tween‐80, 70 ng/mL tocopherol acetate, and 100 μg/mL Pluronic F‐68 and under 37°C perfusion. Cardiomyocytes were paced at 1.0 Hz for 10‐ms duration and the fluorescence measurements were recorded with a dual‐excitation fluorescence photomultiplier system. Cardiomyocytes were exposed to light emitted by a 75‐W Xenon lamp and passed through either a 340‐ or 380‐nm wavelength filter. The emitted fluorescence was detected at 510 nm. To take into account any interference, the background fluorescence for each cardiomyocyte was determined by moving the cardiomyocyte out of the view and recording the fluorescence from the bath solution alone. The time course of the fluorescence signal decay was fit to a single exponential equation, and the time constant (τ) was used as a measure of the rate of intracellular Ca2+ decay.
Measurement of Mitochondrial Oxidative Stress
Following isolation of cardiomyocytes as described above, cells were stained with both MitoSOX (5 μmol/L) and MitoTracker green (100 nmol/L) (Molecular Probe, Carlsbad, CA) for 15 minutes at 37°C and washed twice. Flow cytometry evaluated cardiomyocytes using the Cyan ADP analyzer (Beckman Coulter, Brea, CA). Five thousand cardiomyocytes were selected by appropriate forward and side scatter gating. After a second gating by pulse‐width, MitoSOX fluorescence was detected. Unstained cells were used as a reference standard. The mean of the fluorescence intensity was obtained from the MitoSOX histogram. For confocal microscope images, isolated cardiomyocytes were attached by laminin‐coated glass dish. Confocal images were obtained using ×63 magnification objective by LSM 510M (Carl Zeiss, Inc, Thornwood, NY).17
The cell‐permeant dye 2′,7′‐dichlorodihydrofluorescein diacetate (H2DCFDA; Life Technologies, Grand Island, NY) was used to measure generalized oxidative stress in cardiomyocytes. Isolated cardiomyocytes (10 000 cells) from each group (N=5 in each group) were plated in laminin‐coated plate with MEM medium including 1% insulin, transferrin, selenium, 5% FBS, and 1% lipid mixture (Sigma) with or without fresh‐dissolved antioxidants, mitoTEMPO (10 μmol/L), BH4 (10 μmol/L), and apocynin (100 μmol/L) for 1 hour. After washing twice with plating medium, cells were incubated with H2DCF‐DA (5 μmol/L) for 15 minutes at 37°C, and then washed twice with medium. Fluorescence intensity was read every 2 minutes for 20 minutes using a microplate reader (Synergymx, Winooski, VT) at 495/530 nm and 37°C. After reading, cells were fixed with 4% paraformaldehyde for 15 minutes, and DAPI was added (0.5 μg/mL). Fluorescence data were normalized by DAPI‐positive cell counts.
Transmission Electron Microscopy
Tissues were washed with cold PBS and fixed with electron microscopy grade 4% glutaraldehyde in 0.1 mol/L cacodylate buffer (pH 7.4). Fixed tissues were incubated with 1% osmium tetroxide in cacodylate buffer for 2 hours and processed for embedding. Ultra‐thin sections were cut at 83 nm, placed on 200 mesh copper grids, and stained with uranyl acetate and lead citrate. All materials were purchased from Electron Microscopy Sciences (Hatfield, PA). Samples were visualized using a JEM‐1220 Jeol transmission electron microscopy (JEM, Peabody, MA), and micrographs were taken using a Gatan Digital Micrograph (Gatan Microscopy, Pleasanton, CA). Five random images from each sample were taken for analysis in each mouse (N=3–5 in each group). The area occupied by mitochondria was calculated using Image J (National Institutes of Health, Bethesda, MD).17
Measurement of [NADH] and [NAD+]
Intracellular NADH and NAD+ levels ([NADH] and [NAD+]) were detected by using the EnzyChromTM [NADH]/[NAD+] Assay Kit (BioAssay Systems, Hayward, CA) in control and HFD heart tissue following the manufacturer's protocol. Twenty milligrams of heart tissue was homogenized in assay buffer. A bicinchoninic acid assay protein assay was performed to normalize each group. The optical density was measured at 565 nm for 15 minutes. N=8 in each group.
Immunoblotting and Immunoprecipitation
Proteins (30 μg) were isolated from the frozen ventricles (N=5–6 in each group) and separated on a 4% to 12% SDS‐PAGE gel and transferred onto a 0.2 μm polyvinyl difluoride membrane for S‐glutathionylation of cMyBP‐C. Myofibrils were prepared from mouse hearts as described previously.6 Myofibrils were separated on a 4% to 12% SDS‐PAGE gel and transferred onto a 0.2‐μm polyvinyl difluoride membrane. Following blocking the membrane in 5% nonfat dry milk with 2.5 mmol/L N‐ethylmaleimide for 1 hour, anti‐glutathione mouse monoclonal primary antibody (Virogen, Watertown, MA) was applied to detect for S‐glutathionylation on cMyBP‐C. NOS primary antibodies (1:1000–2000) were phospho‐eNOS (Ser1177) (Cell Signaling Technology, #9571), phospho‐eNOS (Thr475) (Cell Signaling Technology, #9574), eNOS (Cell Signaling Technology, #9586), nNOS (Ser1177) (Cell Signaling Technology, #4231), and GAPDH as a loading control (Abcam, ab9484). Optical density of the bands was measured with ChemiDoc MP system (Bio‐Rad, Hercules, CA) and analyzed with Quantity One imaging analysis software (Bio‐Rad).
For slot blots of 3‐nitrotyrosine, slot blot systems were used (Bio‐Rad). After hydration of nitrocellulose membrane with Tris‐tricine transfer buffer (25 mmol/L Tris, 192 mmol/L glycine, 20% methanol pH 8.3), total lysates (5 μg) were blotted onto a 0.2‐μm nitrocellulose membrane and vacuum dried. Proteins on slot blots were fixed at 25 V, 1.3A for 5 minutes using semidry transfer system Turbo (Bio‐Rad). Anti‐3‐nitrotyrosine antibody (Abcam) was used to detect protein nitrosylation. The following procedures were the same as for immunoblotting.
Total lysates (200 μg) were incubated with monoclonal MnSOD (SOD2) antibody (2 μg, Abcam) and 10 μL of antibody capture affinity ligand (Millipore, capture and release reversible immunoprecipitation kit) for 30 minutes at room temperature. After washing of the spin column, precipitated MnSOD was eluted and immunoblotted with acetylated lysine antibody (Cell Signaling #9441). The immunoblotting procedure was the same as previously described.
Statistical Analysis
Descriptive statistics are mean±SEM or mean±SD where indicated. Comparisons for each group were performed using nonparametric Mann–Whitney test (Wilcoxon rank sum) or unpaired Student t tests. For comparisons between multiple groups, one‐way ANOVA with post hoc Bonferroni's multiple comparison test comparing all groups was used for single cardiomyocytes data. Ecc rate was correlated with invasive hemodynamics and echocardiographic tissue Doppler imaging by the nonparametric Spearman correlation method. All data analyses were performed using Graphpad Prism 5.0, Origin 8.5, or SPSS 16.0. Significance was defined when P<0.05. *denotes P<0.05, **denotes P<0.01, and ***denotes P<0.001.
Results
HFD‐Induced Metabolic Syndrome and Type 2 DM
HFD mice developed significant obesity following 8 weeks of a HFD as shown in Table 1 and Figure 1. Random serum glucose was significantly elevated compared to controls. Although fasting serum glucose levels were similar in both groups, fasting serum insulin levels were significantly higher in HFD mice, indicating insulin resistance. Glucose tolerance tests showed significantly increased serum glucose in the HFD mice compared with the control as follows: 566±20 versus 375±24 mg/dL at 30 minutes, 595±6.1 versus 256±15 mg/dL at 60 minutes, 597±3.7 versus 229±23 mg/dL at 90 minutes, and 509±42 versus 249±4.4 mg/dL at 120 minutes (N=5 in control, N=7 in HFD) following intraperitoneal glucose administration. These results demonstrate that HFD mice developed metabolic alterations similar to metabolic syndrome and type 2 DM.
Table 1.
Metabolic Characteristics of HFD Mice
| Control | HFD | P Value | |
|---|---|---|---|
| Diet intake, g/day | 4.5±0.7 | 4.0±0.4 | 0.53 |
| Body weight, g | 27.5±0.5 | 31±0.6 | <0.01† |
| Body surface area, cm2 | 89±1 | 93±1 | 0.03* |
| Random serum glucose, mg/dL | 223±25 | 357±23 | <0.01† |
| Fasting serum glucose, mg/dL | 203±30 | 239±9 | 0.16 |
| Fasting serum insulin, ng/mL | 1.2±0.1 | 1.9±0.1 | <0.01† |
Data represent mean±SEM. HFD indicates high‐fat diet.
P value note, *P<0.05; † P<0.01. N=8 in each group.
Figure 1.
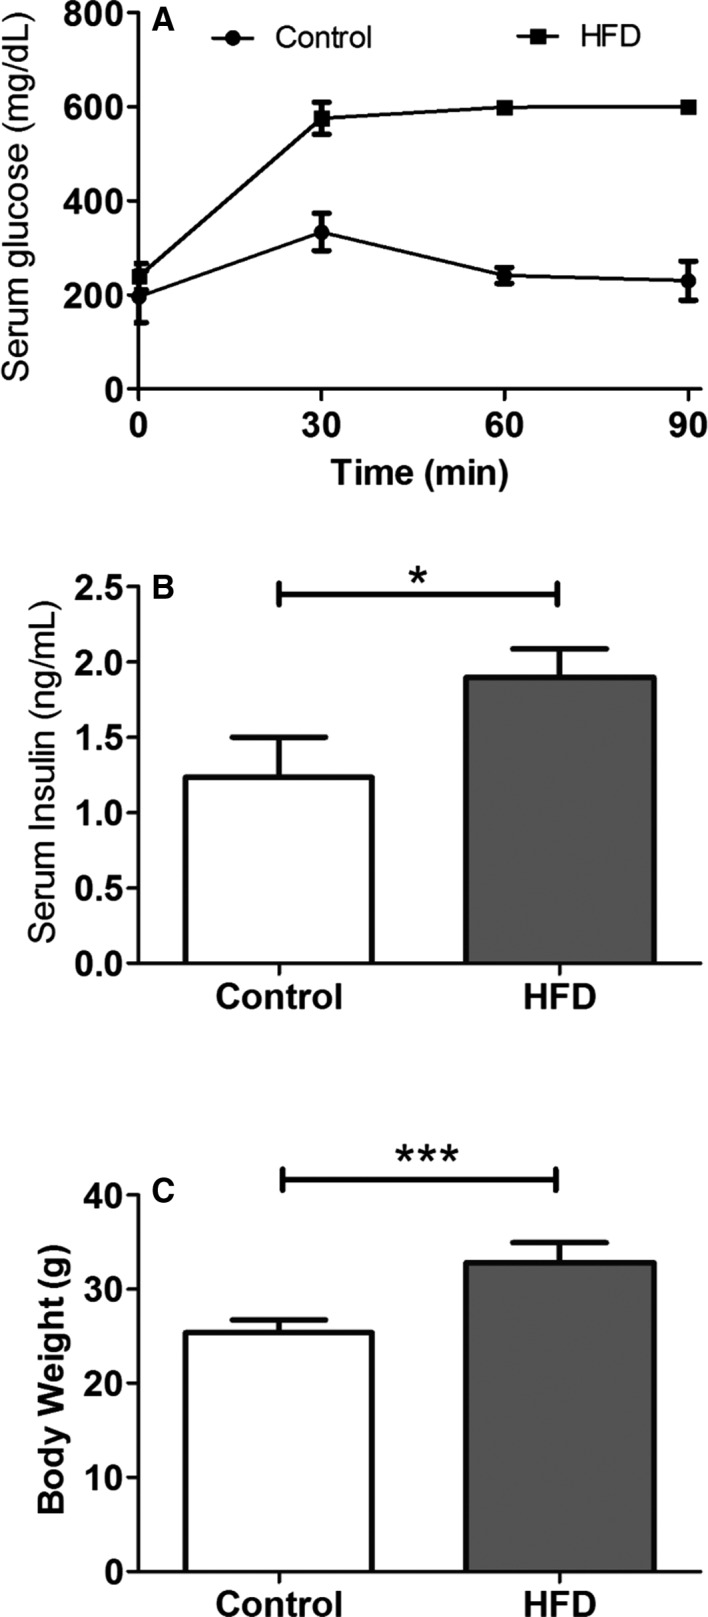
Intraperitoneal glucose tolerance test and insulin level in HFD mice. A, Serial measurements of serum glucose level following intraperitoneal challenge of glucose at 2 g/kg of body weight. B, Random serum insulin level at 8 weeks of HFD (N=5 in control, N=7 in the HFD group). C, Body weight. (N=9 in each group; Data are mean±SD). *P<0.05, and ***P<0.001 using the Mann–Whitney test. HFD indicates high‐fat diet.
HFD Induced Diastolic Dysfunction
To evaluate the effect of these metabolic alterations on cardiac structure and function, myocardial tagged CMR was performed following 8 weeks of a HFD. HFD mice showed significant left ventricular hypertrophy (LVH) compared with controls (Table 2) despite comparable systolic blood pressure. Systolic function was preserved as shown by similar ejection fractions in both groups. In addition, cardiac output and cardiac index were also similar in both groups. These results show that HFD mice developed concentric LVH with preserved systolic function compared with controls.
Table 2.
Cardiovascular Characteristics
| Control | HFD | P Value | |
|---|---|---|---|
| Systolic blood pressure, mm Hg | 101±3 | 107±3 | 0.2 |
| Diastolic blood pressure, mm Hg | 73±3 | 75±2 | 0.5 |
| Heart rate, bpm | 518±14 | 555±8 | 0.02* |
| End‐diastolic volume, mm3 | 35.1±1.4 | 30.3±1.1 | <0.01† |
| End‐systolic volume, mm3 | 11.2±0.5 | 10.5±0.3 | 0.26 |
| Stroke volume, mm3 | 23.1±1.2 | 20.1±1.0 | <0.01† |
| Ejection fraction (%) | 67±1 | 67±0.8 | 0.93 |
| Cardiac output, mL/min | 11.2±0.4 | 12±0.3 | 0.62 |
| Cardiac index, mL/min per m2 | 1.3±0.05 | 1.3±0.04 | 0.76 |
| LV mass, g | 32.5±1.2 | 39.3±1 | <0.01† |
| LV mass index, g/m2 | 3.6±0.1 | 4.2±0.1 | <0.01† |
Data represent mean±SEM. HFD indicates high‐fat diet; LV, left ventricle.
P value note, *P<0.05; † P<0.01. N=8 in each group.
Diastolic function was assessed using 3 different modalities as demonstrated in Figures 2 and 3. CMR enabled direct measurement of myocardial strain during diastole (Figure 2A). Ecc rate was significantly reduced during diastole in HFD mice (4.85±0.15 1/s) compared with controls (7.02±0.59 1/s, P<0.05), indicating significant relaxation impairment in HFD mice. During HFD feeding, longitudinal assessment of diastolic function by myocardial tagged CMR revealed progression of diastolic dysfunction (Figure 2C). LVH also progressed similarly in the HFD group (Figure 2D). Echocardiography showed E/E′ was significantly increased in the HFD group compared with controls (42±1.4 versus 8.6±3.3, P<0.01, Figure 3A through 3D). Finally, invasive hemodynamic assessment revealed that the slope of end‐diastolic pressure volume relationship was significantly higher in the HFD mice (0.37±0.04) compared with the control (0.21±0.03, P<0.05; Figure 3E). Ecc rate was highly correlated with invasive hemodynamics (Figure 3F) and echocardiographic tissue Doppler imaging by nonparametric Spearman correlation (Figure 3G). All 3 modalities indicated that HFD mice developed significant diastolic dysfunction compared with control animals.
Figure 2.
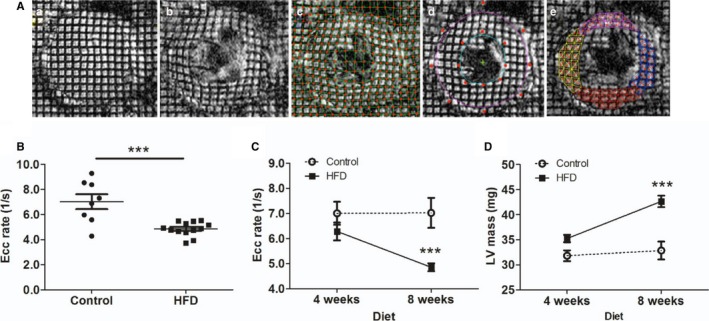
Measurement of diastolic function in HFD mice by CMR imaging. A, Myocardial tagging CMR imaging. Tagged images were obtained from end‐systole (a) to end‐diastole (b) at 5‐ms intervals. Intersections of tagging‐grid lines were traced manually (c). Endocardium and epicardium were contoured by the B‐spline method (d). Triangulation of grid lines enabled harmonic phase analyses for circumferential and radial strain calculations (e). B, Circumferential strain (Ecc) rate during the rapid filling phase in control and HFD mice (8 weeks; N=8 in control, N=13 in the HFD group). C, Longitudinal assessment of Ecc rate at 4 and 8 weeks (N=10 in control, N=13 in the HFD group). D, Longitudinal assessment of LV mass. N=10 to 13 in each group. ***P<0.001. CMR indicates cardiac magnetic resonance; Ecc, circumferential strain rate; HFD, high‐fat diet; LV, left ventricular.
Figure 3.
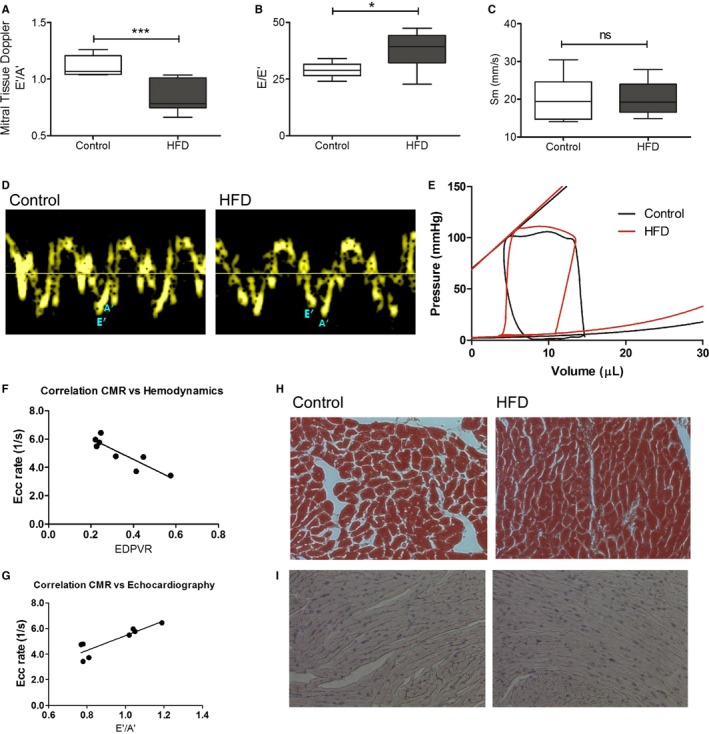
Echocardiography and hemodynamics in the HFD mice. A through D, Noninvasive transthoracic echocardiography. Tissue Doppler imaging and pulse‐wave Doppler measured mitral inflow from the apical four‐chamber view. A, E′/A′ ratio. B, E/E′ ratio. C, peak systolic velocity of the myocardial segment, Sm. D, Representative tissue Doppler images in control and HFD mice. *P<0.05. ***P<0.001 using an unpaired Student t test (N=6–10). E, Invasive hemodynamic measurement of multiple loops of EDPVR (N=5 in control, N=6 in the HFD group). F, Spearman correlation of CMR imaging strain rate, Ecc rate, and hemodynamics, EDPVR (N=8). G, Spearman correlation of CMR imaging strain rate, Ecc rate, and echocardiography, E′/A′ ratio (N=8). H, Trichrome staining (N=4 each). I, Advanced glycosylation end products immunohistochemistry staining. (N=4 each). CMR indicates cardiac magnetic resonance; Ecc, circumferential strain rate; EDPVR, end‐diastolic pressure‐volume relationship; HFD, high‐fat diet; Sm, peak systolic motion of the myocardial segment; ns,not significant.
A Mitochondrial‐Targeted Antioxidant Improved Glucose Tolerance and Insulin Resistance
The MitoTEMPO‐treated HFD group had similar body weight to the controls (Figure 4A). Glucose tolerance tests revealed significantly reduced serum glucose levels in the MitoTEMPO‐treated HFD group at 60 minutes after intraperitoneal glucose challenge when compared with the nontreated HFD group (Figure 4B). Despite differences in glucose tolerance, 6‐hour fasting serum glucose levels were not significantly different between groups (Figure 4C). Nevertheless, the 6‐hour fasting serum insulin levels were significantly elevated in the HFD group and significantly reduced in the MitoTEMPO‐treated group (Figure 4D).
Figure 4.
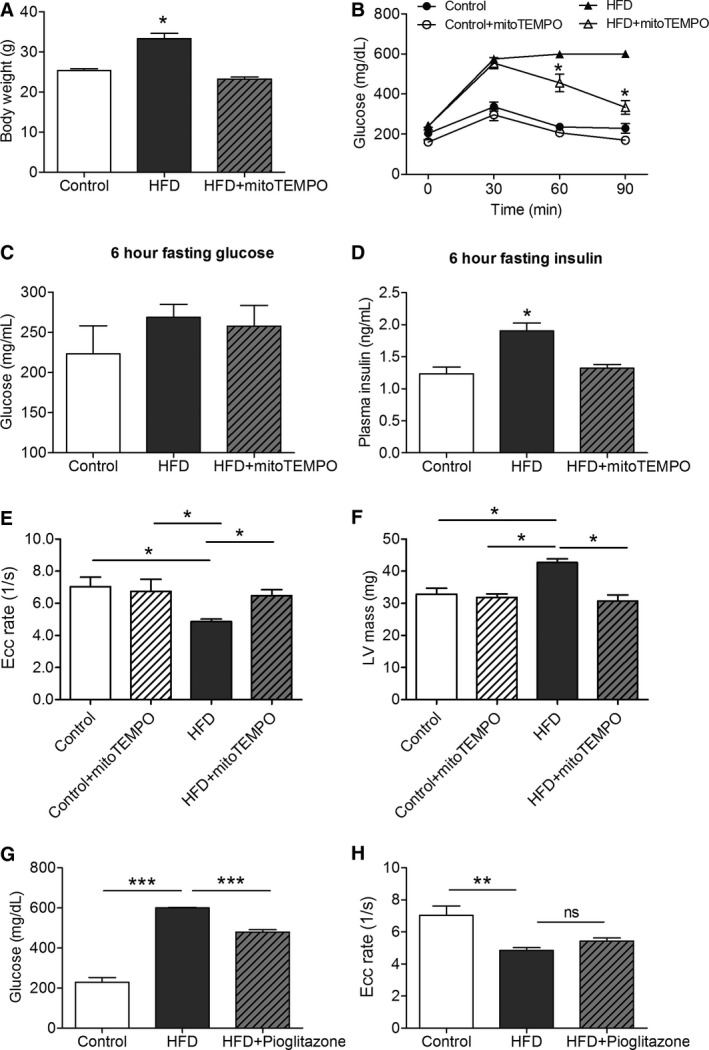
MitoTEMPO effect on insulin resistance and diastolic function. A, Body weight. B, Glucose tolerance test. C, Serum glucose after 6 hours fasting. D, Serum insulin after 6 hours fasting. E, CMR strain rate. F, LV mass measured by CMR. G, Effect of pioglitazone on serum glucose 90 min after challenge. H, Pioglitazone effect on Ecc strain rate. (N=4 in control, N=9 in the HFD and mitoTEMPO groups). *P<0.05, **P<0.01, ***P<0.001. CMR indicates cardiac magnetic resonance; Ecc, circumferential strain rate; HFD, high‐fat diet; LV, left ventricular; MitoTEMPO, 2‐(2,2,6,6‐tetramethyl‐piperidin‐1‐oxyl‐4‐ylamino)‐2‐oxoethyl‐triphenylphosphonium chloride); ns, not significant.
MitoTEMPO Prevented Diastolic Dysfunction
MitoTEMPO‐treated HFD mice showed an Ecc rate (6.4±0.4 1/s) that was similar to controls (7.0±0.6 1/s, P=0.35; Figure 4E). MitoTEMPO‐treated HFD mice also showed a LV mass (30.7±1.9 mg) comparable to controls (32.7±1.8 mg, P=0.35; Figure 4F). Glucose lowering alone did not affect diastolic dysfunction. Although pioglitazone lowered blood glucose level in HFD mice at 90 minutes after glucose challenge (600.4±2.6 mg/dL HFD versus 478.8±12.97 mg/dL pioglitazone‐treated HFD, P<0.05; Figure 4G), diastolic dysfunction was similar in both groups (HFD Ecc rate 4.8±0.1 1/s, N=13 versus pioglitazone‐treated HFD Ecc rate 5.4±0.1 1/s, N=6, P=0.71; Figure 4H).
To assess diastolic dysfunction at the cellular level, sarcomeric contraction and relaxation was measured. Averaged sarcomere length was normalized and compared in control versus HFD mice (Figure 5A) and HFD mice versus mitoTEMPO‐treated HFD mice (Figure 5B). Diastolic sarcomere length was significantly shortened in the HFD mice (1.73±0.01 μm) compared with controls (1.80±0.01 μm, P<0.01). MitoTEMPO‐treated mice showed comparable diastolic sarcomere length (1.81±0.01 μm) to the HFD mice (Figure 5C). Relaxation τ was also significantly increased in the HFD mice compared to controls (0.13±0.01 versus 0.10±0.01, P<0.05) and restored to the level of the controls by MitoTEMPO treatment (0.08±0.01, P=0.22 versus control; Figure 5D). Time to 50% relaxation was significantly increased in the HFD mice (267±18 ms), compared with the controls (197±15 ms, P<0.01). MitoTEMPO‐treated mice showed similar time to 50% relaxation (195±11 ms) to the controls (P=0.9; Figure 5E). Fractional shortening was similar throughout all these groups, indicating preserved systolic function in all groups (Figure 5F). These results suggested that HFD mice developed diastolic dysfunction without systolic impairment at the cellular level, consistent with the in vivo CMR and echocardiographic findings.
Figure 5.
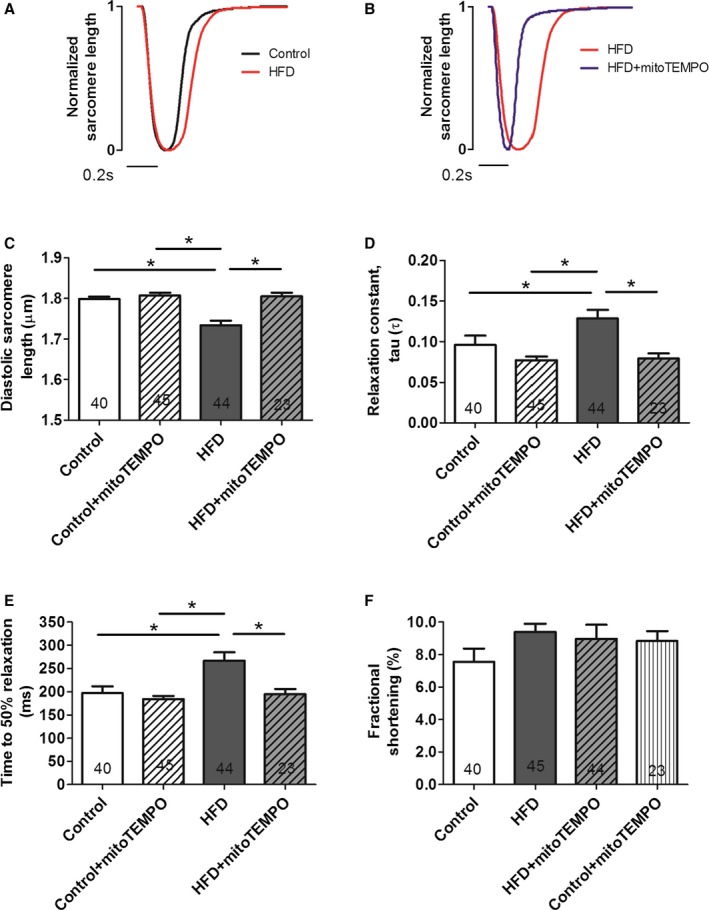
MitoTEMPO effects on relaxation in isolated cardiomyocytes. A and B, Representative normalized sarcomere contraction and relaxation traces in control (black) vs HFD mice (red) (A); HFD mice vs mitoTEMPO‐treated mice (blue) (B). Bar represents 0.2 seconds. C, Basal diastolic sarcomere length. D, Relaxation constant, τ. E, time to 50% relaxation. F, Fractional shortening. N=4 mice in control, N=6 mice in the HFD and mitoTEMPO groups. Five to 10 myocytes were studied from each mouse. Total cardiomyocytes are indicated in each bar graph. *P<0.05. HFD indicates high‐fat diet; MitoTEMPO, 2‐(2,2,6,6‐tetramethyl‐piperidin‐1‐oxyl‐4‐ylamino)‐2‐oxoethyl‐triphenylphosphonium chloride).
Ca2+ transient data were measured in isolated cardiomyocytes (Figure 6). Although Ca2+ amplitude was modestly reduced in HFD mice compared to the control group, Ca2+ decay rate and baseline cytosolic resting Ca2+ were not significantly changed when compared to untreated controls. Moreover, MitoTEMPO treatment in HFD mice did not significantly change these measures, suggesting that changes in Ca2+ handling were not the main mechanism whereby mitoTEMPO improved diastolic dysfunction.
Figure 6.
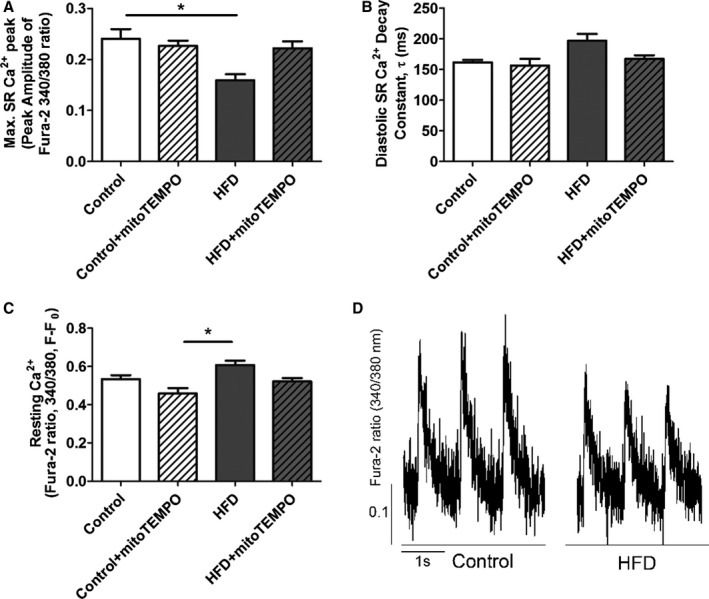
Ca2+ transient data from isolated cardiomyocytes. A, Amplitude of the Ca2+ transient. B, Diastolic Ca2+ decay constant τ (ms). C, Resting Ca2+ (F/F0) in each group. D, Representative Ca2+ transients from HFD and control myocytes. Isolated cardiomyocytes were loaded with Fura‐2AM and paced at 1.0 Hz. *P<0.05. N=18 to 21 cells in each group. N=4 mice in each group. HFD indicates high‐fat diet; SR, sarcoplasmic reticulum.
MitoTEMPO Reduced Reactive Oxygen Species (ROS), Preserved Mitochondrial Ultrastructure, Prevented MnSOD Acetylation, and Altered NOS
Confocal microscopy and flow cytometry indicate that HFD mice have significantly increased mitochondrial and cytosolic reactive oxygen species (ROS) compared to controls without significant changes in mitochondrial mass as measured by MitoTracker (Figure 7). Mitochondrial superoxide was measured by MitoSOX, and general cytosolic hydrogen peroxide (H2O2) was measured by H2DCF‐DA. Quantitative assessment of the corresponding flow cytometry data showed a significant increase in the MitoSOX signal from the HFD mice (137±7) compared with the controls (91±3, P<0.01) or the MitoTEMPO‐treated group (100±6, P<0.01; Figure 7B). General cellular ROS levels were measured using H2DCF‐DA and were significantly elevated in HFD hearts (HFD, 3473±200 a.u. versus control 1562±37 a.u., P<0.001, Figure 8). MitoTEMPO‐treated HFD mice had a reduced ROS level (1985±145, P<0.001). The major ROS source was detected using each scavenger, including mitoTEMPO for mitochondrial ROS, BH4 for NOS uncoupling, allopurinol for xanthine oxidase, and apocynin for NADPH oxidase. The rates of hydrogen peroxide accumulation were significantly inhibited by mitoTEMPO and BH4, indicating mitochondria and uncoupled NOS are the major ROS sources. To further verify the mitochondrial ROS effect, we measured the NADH level. The ratio of [NADH]/[NAD+] was increased in HFD mice (3.60±0.78 HFD versus 2.02±0.23 control, P<0.05), consistent with increased mitochondrial oxidative stress (Figure 9).18 Consistent with a general increase in cellular oxidation, total protein 3‐nitrotyrosine level was increased with HFD and decreased by mitoTEMPO treatment (Figure 10).
Figure 7.
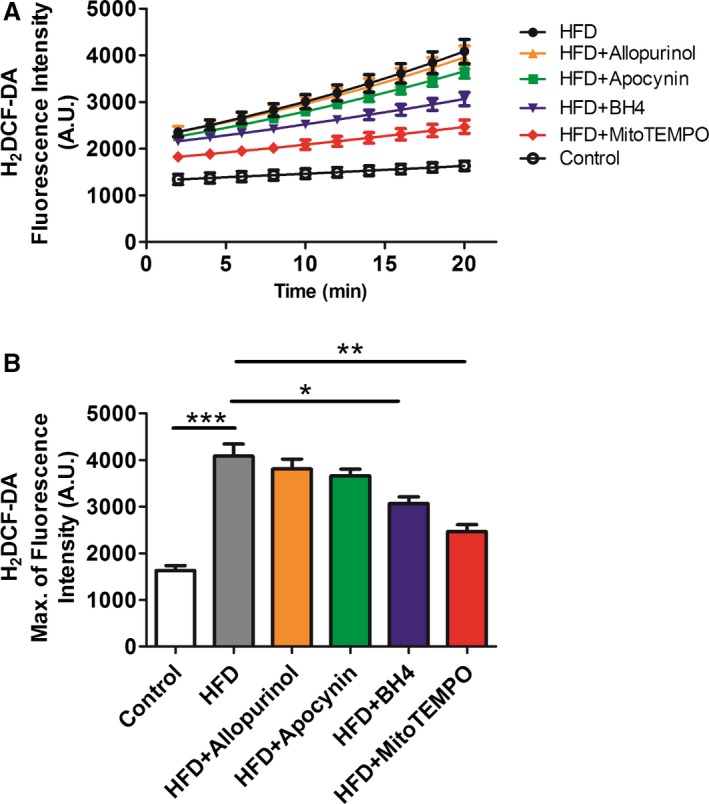
Cytoplasmic ROS measured by H2 DCF‐DA. A and B, Isolated cardiomyocytes from HFD and matched controls with or without in vivo treatment with mitoTEMPO, BH 4, apocynin, or allopurinol to inhibit mitochondrial, uncoupled nitric oxide synthase, NADPH oxidase, or xanthine oxidase‐dependent ROS. Data were represent as mean±SEM. *P<0.05,**P<0.01, ***P<0.001. N=5 for each treatment. DCF‐DA indicates 2',7'‐dichlorofluorescin diacetate; HFD, high‐fat diet; ROS, reactive oxygen species; MitoTEMPO, 2‐(2,2,6,6‐tetramethyl‐piperidin‐1‐oxyl‐4‐ylamino)‐2‐oxoethyl‐triphenylphosphonium chloride).
Figure 8.
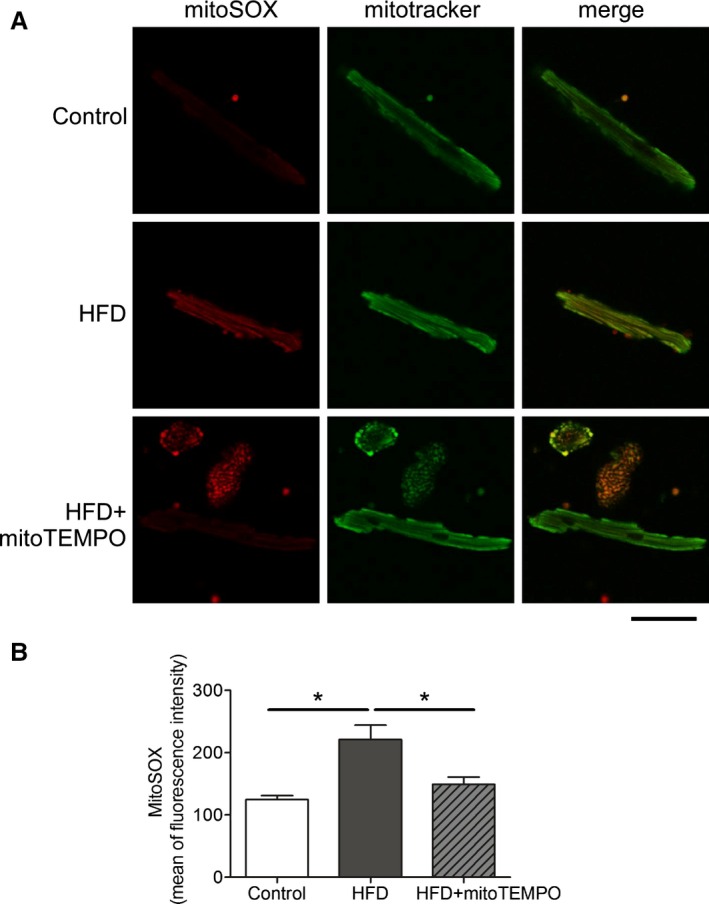
Mitochondrial ROS scavenged by mitoTEMPO. A, Confocal microscopy showing mitochondrial ROS. MitoSOX was used to probe for mitochondrial superoxide, and MitoTracker green was used to identify mitochondria. Bar represents 20 μm. B, Flow cytometry with mitoSOX staining. Mean of fluorescence intensity was recorded on the red channel. N=3 in control, N=4 in HFD and mitoTEMPO groups. *P<0.05. HFD indicates high‐fat diet; MitoTEMPO, 2‐(2,2,6,6‐tetramethyl‐piperidin‐1‐oxyl‐4‐ylamino)‐2‐oxoethyl‐triphenylphosphonium chloride); ROS, reactive oxygen species.
Figure 9.

[NADH] and [NAD +] levels in HFD hearts. A, [NADH] level. B, [NAD +] level. C, ratio of [NADH]/[NAD +]. Data represent mean±SEM. *P<0.05. N=8 in each group. HFD indicates high‐fat diet.
Figure 10.
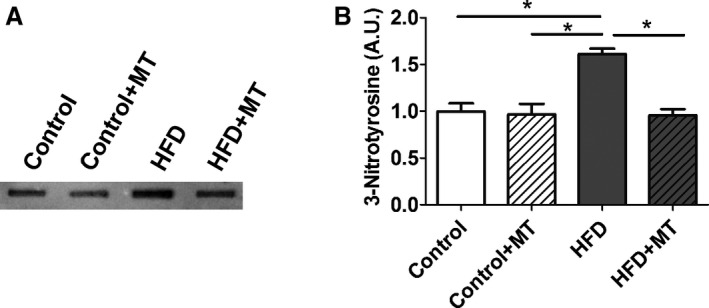
3‐Nitrotyrosine (3‐NT) level in HFD heart. A, Slot blots were performed using a 3‐ NT antibody. B, Representative densitometry analysis. Data represent mean±SEM. *P<0.05. N=6 in each group. HFD indicates high‐fat diet; MT, mitoTEMPO.
Mitochondrial ultrastructure of HFD mouse hearts from electron microscopy showed evidence of morphological abnormalities (Figure 11). MitoTEMPO treatment improved mitochondrial ultrastructure. Paralleling the ultrastructural changes, MnSOD lysine‐acetylation levels were increased significantly in the HFD group as compared to controls, and this increase was prevented by mitoTEMPO treatment (Figure 12). Since acetylation decreases MnSOD activity,19 this observation may provide an explanation for the increase in mitochondrial ROS with DM.
Figure 11.
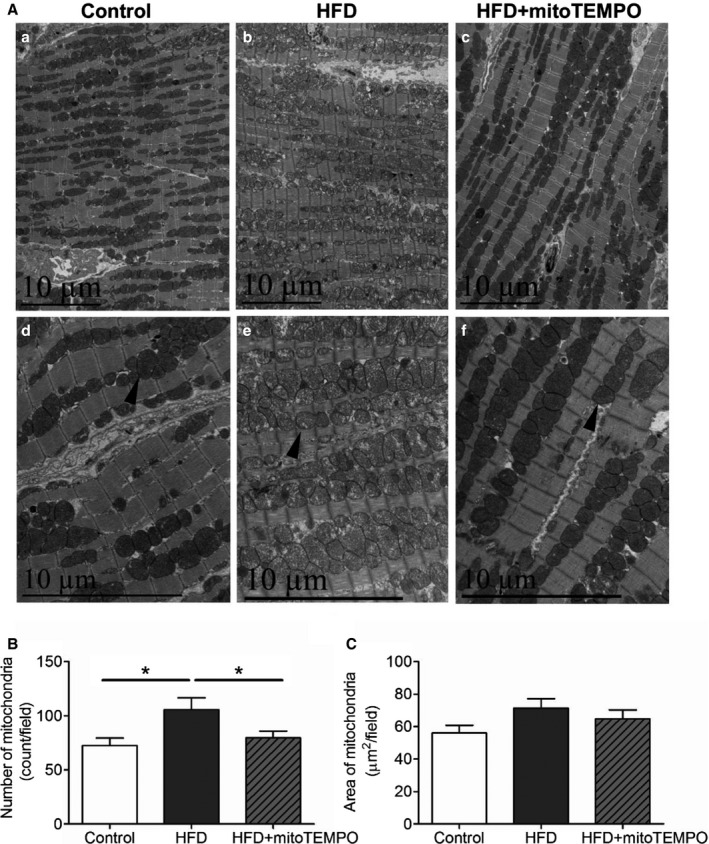
Electron microscopy of mitochondrial morphology with HFD. A, Transmission electron micrographs of hearts from control, HFD mice, and HFD mice treated with mitoTEMPO. a and d, control; b and e, HFD; c and f, mitoTEMPO‐treated HFD mice. a, b, and c, ×5780. d, e, and f, ×11 600 magnification. Arrowhead indicates typical mitochondria in each group. Bar indicates 10 μm. B, Averaged numbers of mitochondria in each field. C, Quantification of total mitochondrial areas in each field. N=3 to 5 in each group. *P<0.05. HFD indicates high‐fat diet; MitoTEMPO, 2‐(2,2,6,6‐tetramethyl‐piperidin‐1‐oxyl‐4‐ylamino)‐2‐oxoethyl‐triphenylphosphonium chloride).
Figure 12.
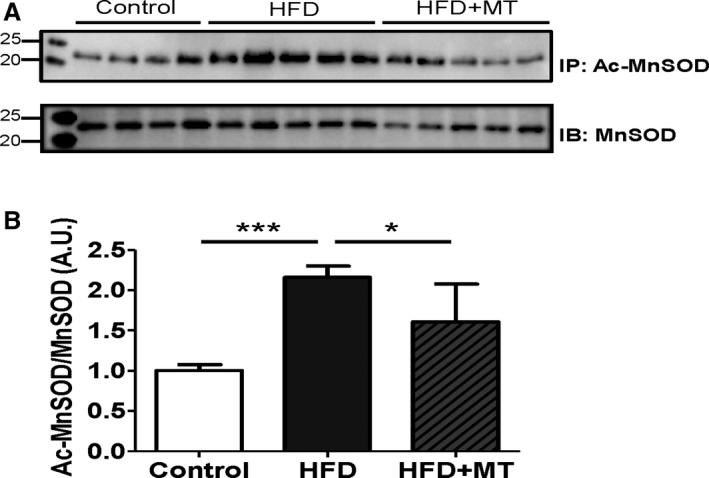
MnSOD and its acetylation in HFD heart. A, Immunoprecipitation (IP) was performed using a MnSOD antibody, and then immunoblotted (IB) with an acetylated‐lysine antibody. Acetylation of MnSOD was normalized by the total expression level of MnSOD. B, Densitometry was normalized by MnSOD. Data represent mean±SEM. *P<0.05, ***P<0.001. N=4 to 5. Ac‐MnSOD indicates acetylated manganese superoxide dismutase; HFD, high‐fat diet; MT, mitoTEMPO.
Previously, we have implicated reduced nitric oxide (NO) in the pathogenesis of diastolic dysfunction.5, 16 To evaluate the role of NO in HFD‐induced diastolic dysfunction, NOS levels and regulatory phosphorylation were assessed. Figure 13 shows that mitoTEMPO was sufficient to suppress most of the cardiac oxidative stress produced by HFD. Nevertheless, HFD did cause changes in the NOS/NO pathway. Figure 7 shows that BH4 reduced ROS to a lesser extent than MitoTEMPO. In Figure 13, HFD reduced eNOS S1177 phosphorylation without alteration in T495 phosphorylation, suggesting that eNOS activity may be downregulated with HFD. The change in eNOS 1177 was partially reversed by mitoTEMPO. There was no change in eNOS expression with HFD, but HFD reduced nNOS expression slightly. This was reversed by mitoTEMPO. These results suggested an interplay between mitochondrial ROS and the NO system. Therefore, we treated cardiomyocytes isolated from diabetic hearts with an NO donor, SNAP (S‐Nitroso‐N‐Acetyl‐D,L‐Penicillamine). SNAP increased resting sarcomere length, decreased diastolic relaxation time, and improved fractional shortening (Figure 14), suggesting that reduced NO may be part of the pathology of diastolic dysfunction in DM.
Figure 13.
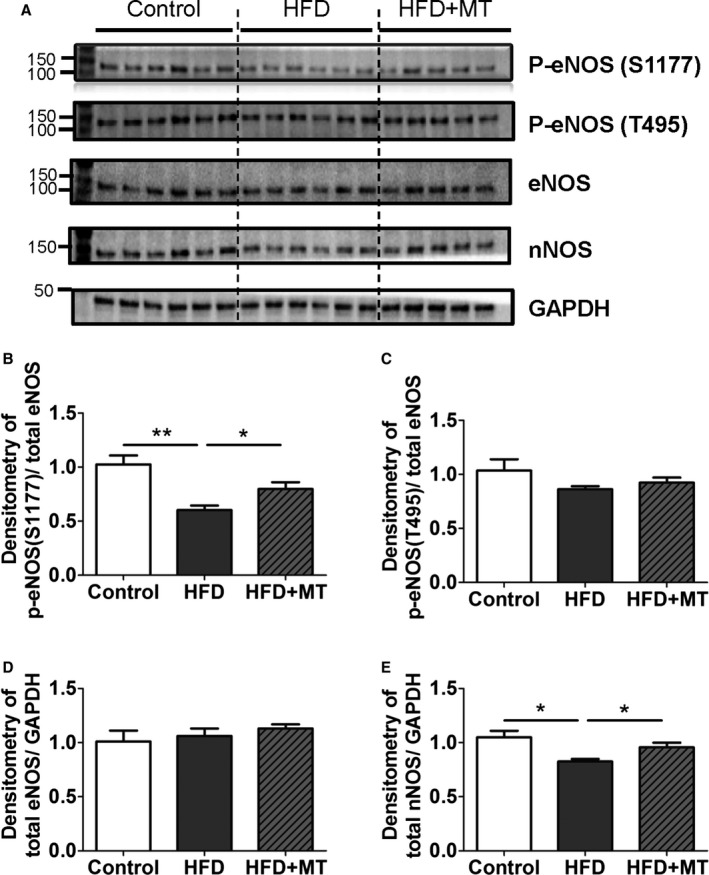
Changes in nitric oxide synthases (NOSs) with HFD. A, Immunoblot images shown as phospho‐eNOS (Ser1177), phospho‐eNOS (Thr495), total eNOS, total nNOS, and GAPDH. B and C, Densitometry data of stimulatory phospho‐eNOS (Ser1177) (B) and inhibitory phospho‐eNOS (Thr495) (C) were normalized by total eNOS, (D and E). Densitometry data of total eNOS (D) and total nNOS were normalized by GAPDH. Data represent mean±SEM. *P<0.05, **P<0.01. N=5 to 6. HFD indicates high‐fat diet; MT, mitoTEMPO.
Figure 14.
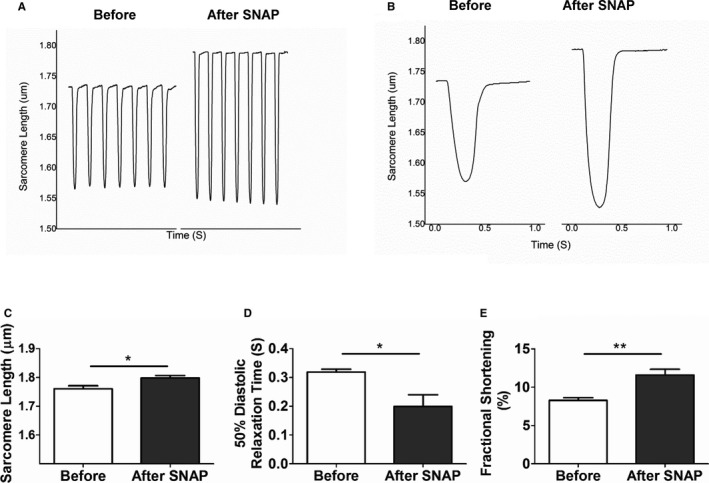
NO donor effect on diastolic impairment in HFD cardiomyocytes. Single isolated cardiomyocytes were treated with SNAP, an NO donor (1 mmol/L). A and B, Sarcomere length before and after treatment with SNAP are shown in (A) and averaged in (B). C, Resting sarcomere length; (D) 50% of diastolic relaxation time; and (E) fractional shortening as a function of SNAP. Data represent mean±SEM. *P<0.05, **P<0.01. N=8. HFD indicates high‐fat diet; SNAP, S‐Nitroso‐N‐Acetyl‐D,L‐Penicillamine.
MitoTEMPO Reduced cMyBP‐C S‐Glutathionylation
Previously, we have shown S‐glutathionylation of cMyBP‐C leads to increased myofilament calcium sensitivity and diastolic dysfunction in the hypertensive mouse model.6 Similarly, the HFD mice showed significantly increased cMyBP‐C S‐glutathionylation compared to the control group (P<0.05 in both of total cMyBP‐C and actin normalized immunoblotting, Figure 15). MitoTEMPO treatment prevented this oxidant‐mediated S‐glutathionylation. The mitochondrial ROS level was significantly and positively correlated with diastolic dysfunction (relaxation constant, slope 26.12±10.01. R 2=0.5767, P<0.05) and myofilament oxidative modification, S‐glutathionylated cMyBP‐C level (slope 0.23±0.02, R 2=0.9751, P<0.05).
Figure 15.
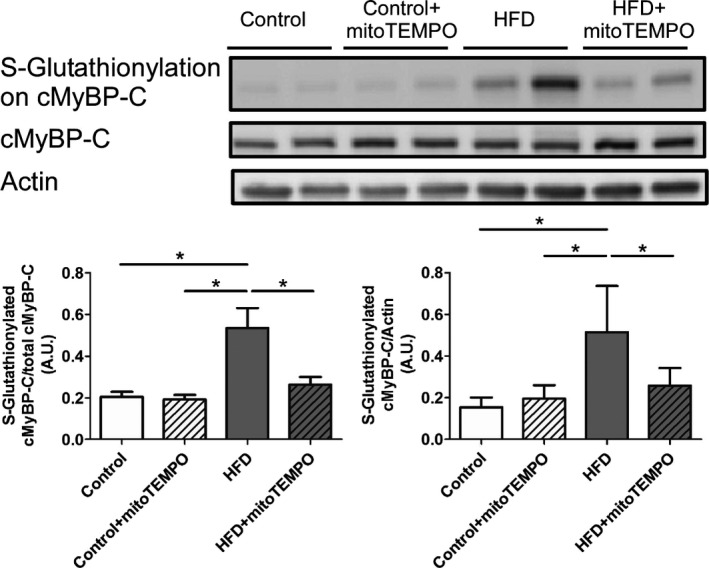
Immunoblotting for S‐glutathionylated cMyBP‐C. S‐Glutathionylation of cMyBP‐C in control, HFD, and HFD mice treated with mitoTEMPO. N=4 to 7 in each group. *P<0.05. cMyBP‐C indicates cardiac myosin binding protein‐C; HFD, high‐fat diet; MitoTEMPO, 2‐(2,2,6,6‐tetramethyl‐piperidin‐1‐oxyl‐4‐ylamino)‐2‐oxoethyl‐triphenylphosphonium chloride).
Discussion
Epidemiological risk factors for diastolic dysfunction include type 2 DM, hypertension, obesity, and age. Diastolic dysfunction is observed in 40% to 75% of asymptomatic, normoglycemic patients with type 2 DM patients.2, 20, 21 Previous reports indicate that diastolic dysfunction represents the earliest preclinical manifestation of diabetic cardiomyopathy and that this can progress to symptomatic heart failure.22 In this study, we demonstrated HFD‐induced insulin resistance results in diastolic dysfunction at the organ and cellular levels. Diastolic dysfunction was associated with mitochondrial oxidative stress, mitochondrial morphological changes, and myofilament cMyBP‐C S‐glutathionylation. Treating HFD mice with a mitochondrial antioxidant, MitoTEMPO, was able to prevent HFD‐induced diastolic dysfunction.
We have demonstrated that hypertension‐associated diastolic dysfunction is caused by uncoupled NOS‐dependent oxidative stress leading to S‐glutathionylation of cMyBP‐C, slower myofilament relaxation kinetics, and increased myofilament Ca2+ sensitivity.6 In this study, HFD‐associated diastolic dysfunction was also associated with increased oxidative stress and S‐glutathionylation of cMyBP‐C. Moreover, the oxidative stress appears to have arisen as the result of mitochondrial dysfunction. This is consistent with the known effect of HFD on mitochondrial ROS and suggests that oxidative modification of cMyBP‐C may be a final common mechanism to cause diastolic dysfunction associated with hypertension or DM.23
There has been considerable debate about the most suitable noninvasive method for evaluating diastolic function in small animals.5 Our experiments showed close correlation of both CMR and echocardiography, compared to the “gold standard” of invasive hemodynamics.
Several small studies have suggested that elevated serum glucose may not be a cause of diastolic dysfunction.24, 25, 26, 27 In this study we have shown that although pioglitazone lowered blood glucose levels, it did not improve diastolic dysfunction. On the other hand, mitoTEMPO was able to improve glucose tolerance and diastolic dysfunction, suggesting that glucose lowering alone was insufficient to prevent impaired cardiac relaxation.
Our findings suggest that HFD‐mediated diastolic dysfunction was associated with mitochondrial morphological changes and increased ROS production. Recent studies have shown that insulin resistance is accompanied by reduced mitochondrial function and enhanced mitochondrial oxidative stress.28 In addition to preserving diastolic function, our experiments showed that mitochondrial superoxide scavenging protects HFD mice from weight gain, insulin resistance, and LVH. This suggests that mitochondrial superoxide may mediate insulin resistance, glucose intolerance, weight gain, LVH, and diastolic dysfunction in response to excessive calorie intake. These results are similar to a study showing that metallothionein overexpression or resveratrol administration can prevent diabetic mice from developing diastolic dysfunction and LV hypertrophy.29, 30 Our work is consistent with that of Anderson et al, who suggest that HFD is linked to insulin resistance by mitochondrial ROS production, specifically H2O2.31 In our case, we found that HFD resulted in excess mitochondrial and cytoplasmic oxidative stress that contributed to diastolic dysfunction.
Another potential mechanism for diastolic dysfunction in the type 2 DM might be altered calcium transients. Nevertheless, it appears that changes in calcium cycling did not play a major role in diastolic dysfunction or the effect of mitoTEMPO in this HFD mouse model. This is consistent with reports by Flagg et al29, 32 Nevertheless, this mechanism cannot be entirely excluded.
In the current study, we demonstrated that MitoTEMPO also prevented the HFD mice from developing LVH. Although the LVH was not the main scope of our study, previous clinical and small animal studies have shown a significant link between diastolic dysfunction, LVH, and oxidative stress in DM.14, 33, 34, 35 The mechanism for this association is unknown.
We did not perform a detailed investigation of potential side effects of MitoTEMPO in the current study. Nevertheless, none of the MitoTEMPO‐administered HFD mice showed any signs of significant systemic toxicity, and MitoTEMPO‐treated control animals showed no changes in hemodynamic parameters, consistent with our previous use of this drug.17
Conclusions
We have shown that a HFD leads to insulin resistance, glucose intolerance, mitochondrial ROS production, modification of cMyBP‐C, and diastolic dysfunction. These changes can be prevented by a mitochondria‐targeted antioxidant. This suggests that mitochondrial ROS contributes to glucose intolerance and diastolic dysfunction. Mitochondrial antioxidants may have a role in treatment or prevention of diastolic heart failure.
Sources of Funding
This work was supported by National Institutes of Health grants P01 HL058000, R01 HL104025, R01 HL106592, Veterans Administration Merit Award, and R41 HL112355 (SCD); R37 HL49244 (EDL).
Disclosures
Dudley is the inventor on patent applications: (1) 11/895,883 Methods and Compositions for Treating Diastolic Dysfunction, (2) 13/503,812 Methods of Diagnosing Diastolic Dysfunction, (3) 13/397,622 Methods for Treating Diastolic Dysfunction and Related Conditions, (4) 13/658,943 Method of Improving Diastolic Dysfunction, (5) 13/841,843 Myosin Binding Protein‐C for Use in Methods Relating to Diastolic Heart Failure, and (6) 61/728,302 Mitochondrial Antioxidants and Diabetes.
(J Am Heart Assoc. 2016;5:e003046 doi: 10.1161/JAHA.115.003046)
This article was handled by Hossein Ardehali, MD, PhD, as a guest editor. The editors had no role in the evaluation of the manuscript or in the decision about its acceptance.
References
- 1. Schocken DD, Benjamin EJ, Fonarow GC, Krumholz HM, Levy D, Mensah GA, Narula J, Shor ES, Young JB, Hong Y. Prevention of heart failure: a scientific statement from the American Heart Association Councils on Epidemiology and Prevention, Clinical Cardiology, Cardiovascular Nursing, and High Blood Pressure Research; Quality of Care and Outcomes Research Interdisciplinary Working Group; and Functional Genomics and Translational Biology Interdisciplinary Working Group. Circulation. 2008;117:2544–2565. [DOI] [PubMed] [Google Scholar]
- 2. Owan TE, Hodge DO, Herges RM, Jacobsen SJ, Roger VL, Redfield MM. Trends in prevalence and outcome of heart failure with preserved ejection fraction. N Engl J Med. 2006;355:251–259. [DOI] [PubMed] [Google Scholar]
- 3. Redfield MM, Jacobsen SJ, Burnett JC Jr, Mahoney DW, Bailey KR, Rodeheffer RJ. Burden of systolic and diastolic ventricular dysfunction in the community: appreciating the scope of the heart failure epidemic. JAMA. 2003;289:194–202. [DOI] [PubMed] [Google Scholar]
- 4. Patil VC, Patil HV, Shah KB, Vasani JD, Shetty P. Diastolic dysfunction in asymptomatic type 2 diabetes mellitus with normal systolic function. J Cardiovasc Dis Res. 2011;2:213–222. [DOI] [PMC free article] [PubMed] [Google Scholar]
- 5. Silberman GA, Fan TH, Liu H, Jiao Z, Xiao HD, Lovelock JD, Boulden BM, Widder J, Fredd S, Bernstein KE, Wolska BM, Dikalov S, Harrison DG, Dudley SC Jr. Uncoupled cardiac nitric oxide synthase mediates diastolic dysfunction. Circulation. 2010;121:519–528. [DOI] [PMC free article] [PubMed] [Google Scholar]
- 6. Jeong EM, Monasky MM, Gu L, Taglieri DM, Patel BG, Liu H, Wang Q, Greener I, Dudley SC Jr, Solaro RJ. Tetrahydrobiopterin improves diastolic dysfunction by reversing changes in myofilament properties. J Mol Cell Cardiol. 2013;56:44–54. [DOI] [PMC free article] [PubMed] [Google Scholar]
- 7. Baynes JW. Role of oxidative stress in development of complications in diabetes. Diabetes. 1991;40:405–412. [DOI] [PubMed] [Google Scholar]
- 8. Baynes JW, Thorpe SR. Role of oxidative stress in diabetic complications: a new perspective on an old paradigm. Diabetes. 1999;48:1–9. [DOI] [PubMed] [Google Scholar]
- 9. Saxena AK, Srivastava P, Kale RK, Baquer NZ. Impaired antioxidant status in diabetic rat liver. Effect of vanadate. Biochem Pharmacol. 1993;45:539–542. [DOI] [PubMed] [Google Scholar]
- 10. Hankiewicz JH, Goldspink PH, Buttrick PM, Lewandowski ED. Principal strain changes precede ventricular wall thinning during transition to heart failure in a mouse model of dilated cardiomyopathy. Am J Physiol Heart Circ Physiol. 2008;294:H330–H336. [DOI] [PubMed] [Google Scholar]
- 11. Hankiewicz JH, Banke NH, Farjah M, Lewandowski ED. Early impairment of transmural principal strains in the left ventricular wall after short‐term, high‐fat feeding of mice predisposed to cardiac steatosis. Circ Cardiovasc Imaging. 2010;3:710–717. [DOI] [PMC free article] [PubMed] [Google Scholar]
- 12. Fogel MA, Weinberg PM, Hubbard A, Haselgrove J. Diastolic biomechanics in normal infants utilizing MRI tissue tagging. Circulation. 2000;102:218–224. [DOI] [PubMed] [Google Scholar]
- 13. Liu W, Chen J, Ji S, Allen JS, Bayly PV, Wickline SA, Yu X. Harmonic phase MR tagging for direct quantification of Lagrangian strain in rat hearts after myocardial infarction. Magn Reson Med. 2004;52:1282–1290. [DOI] [PubMed] [Google Scholar]
- 14. Edvardsen T, Rosen BD, Pan L, Jerosch‐Herold M, Lai S, Hundley WG, Sinha S, Kronmal RA, Bluemke DA, Lima JA. Regional diastolic dysfunction in individuals with left ventricular hypertrophy measured by tagged magnetic resonance imaging—the Multi‐Ethnic Study of Atherosclerosis (MESA). Am Heart J. 2006;151:109–114. [DOI] [PubMed] [Google Scholar]
- 15. Osman NF, Kerwin WS, McVeigh ER, Prince JL. Cardiac motion tracking using CINE harmonic phase (HARP) magnetic resonance imaging. Magn Reson Med. 1999;42:1048–1060. [DOI] [PMC free article] [PubMed] [Google Scholar]
- 16. Lovelock JD, Monasky MM, Jeong EM, Lardin HA, Liu H, Patel BG, Taglieri DM, Gu L, Kumar P, Pokhrel N, Zeng D, Belardinelli L, Sorescu D, Solaro RJ, Dudley SC Jr. Ranolazine improves cardiac diastolic dysfunction through modulation of myofilament calcium sensitivity. Circ Res. 2012;110:841–850. [DOI] [PMC free article] [PubMed] [Google Scholar]
- 17. Sovari AA, Rutledge CA, Jeong EM, Dolmatova E, Arasu D, Liu H, Vahdani N, Gu L, Zandieh S, Xiao L, Bonini MG, Duffy HS, Dudley SC Jr. Mitochondria oxidative stress, connexin43 remodeling, and sudden arrhythmic death. Circ Arrhythm Electrophysiol. 2013;6:623–631. [DOI] [PMC free article] [PubMed] [Google Scholar]
- 18. Liu M, Gu L, Sulkin MS, Liu H, Jeong EM, Greener I, Xie A, Efimov IR, Dudley SC Jr. Mitochondrial dysfunction causing cardiac sodium channel downregulation in cardiomyopathy. J Mol Cell Cardiol. 2013;54:25–34. [DOI] [PMC free article] [PubMed] [Google Scholar]
- 19. Ozden O, Park SH, Kim HS, Jiang H, Coleman MC, Spitz DR, Gius D. Acetylation of MnSOD directs enzymatic activity responding to cellular nutrient status or oxidative stress. Aging (Albany NY). 2011;3:102–107. [DOI] [PMC free article] [PubMed] [Google Scholar]
- 20. Boyer JK, Thanigaraj S, Schechtman KB, Perez JE. Prevalence of ventricular diastolic dysfunction in asymptomatic, normotensive patients with diabetes mellitus. Am J Cardiol. 2004;93:870–875. [DOI] [PubMed] [Google Scholar]
- 21. Zabalgoitia M, Ismaeil MF, Anderson L, Maklady FA. Prevalence of diastolic dysfunction in normotensive, asymptomatic patients with well‐controlled type 2 diabetes mellitus. Am J Cardiol. 2001;87:320–323. [DOI] [PubMed] [Google Scholar]
- 22. Dandamudi S, Slusser J, Mahoney DW, Redfield MM, Rodeheffer RJ, Chen HH. The prevalence of diabetic cardiomyopathy: a population based study in Olmsted County, MN. J Card Fail. 2014;20:304–309. [DOI] [PMC free article] [PubMed] [Google Scholar]
- 23. Kim JA, Wei Y, Sowers JR. Role of mitochondrial dysfunction in insulin resistance. Circ Res. 2008;102:401–414. [DOI] [PMC free article] [PubMed] [Google Scholar]
- 24. von Bibra BH, Diamant M, Scheffer PG, Siegmund T, Schumm‐Draeger PM. Rosiglitazone, but not glimepiride, improves myocardial diastolic function in association with reduction in oxidative stress in type 2 diabetic patients without overt heart disease. Diab Vasc Dis Res. 2008;5:310–318. [DOI] [PubMed] [Google Scholar]
- 25. St John SM, Rendell M, Dandona P, Dole JF, Murphy K, Patwardhan R, Patel J, Freed M. A comparison of the effects of rosiglitazone and glyburide on cardiovascular function and glycemic control in patients with type 2 diabetes. Diabetes Care. 2002;25:2058–2064. [DOI] [PubMed] [Google Scholar]
- 26. Lautamaki R, Airaksinen KE, Seppanen M, Toikka J, Luotolahti M, Ball E, Borra R, Harkonen R, Iozzo P, Stewart M, Knuuti J, Nuutila P. Rosiglitazone improves myocardial glucose uptake in patients with type 2 diabetes and coronary artery disease: a 16‐week randomized, double‐blind, placebo‐controlled study. Diabetes. 2005;54:2787–2794. [DOI] [PubMed] [Google Scholar]
- 27. van der Meer RW, Rijzewijk LJ, de Jong HW, Lamb HJ, Lubberink M, Romijn JA, Bax JJ, de Roos A, Kamp O, Paulus WJ, Heine RJ, Lammertsma AA, Smit JW, Diamant M. Pioglitazone improves cardiac function and alters myocardial substrate metabolism without affecting cardiac triglyceride accumulation and high‐energy phosphate metabolism in patients with well‐controlled type 2 diabetes mellitus. Circulation. 2009;119:2069–2077. [DOI] [PubMed] [Google Scholar]
- 28. Hoehn KL, Salmon AB, Hohnen‐Behrens C, Turner N, Hoy AJ, Maghzal GJ, Stocker R, Van RH, Kraegen EW, Cooney GJ, Richardson AR, James DE. Insulin resistance is a cellular antioxidant defense mechanism. Proc Natl Acad Sci USA. 2009;106:17787–17792. [DOI] [PMC free article] [PubMed] [Google Scholar]
- 29. Qin F, Siwik DA, Luptak I, Hou X, Wang L, Higuchi A, Weisbrod RM, Ouchi N, Tu VH, Calamaras TD, Miller EJ, Verbeuren TJ, Walsh K, Cohen RA, Colucci WS. The polyphenols resveratrol and S17834 prevent the structural and functional sequelae of diet‐induced metabolic heart disease in mice. Circulation. 2012;125:1757–1764. [DOI] [PMC free article] [PubMed] [Google Scholar]
- 30. Zhou G, Li X, Hein DW, Xiang X, Marshall JP, Prabhu SD, Cai L. Metallothionein suppresses angiotensin II‐induced nicotinamide adenine dinucleotide phosphate oxidase activation, nitrosative stress, apoptosis, and pathological remodeling in the diabetic heart. J Am Coll Cardiol. 2008;52:655–666. [DOI] [PubMed] [Google Scholar]
- 31. Anderson EJ, Lustig ME, Boyle KE, Woodlief TL, Kane DA, Lin CT, Price JW III, Kang L, Rabinovitch PS, Szeto HH, Houmard JA, Cortright RN, Wasserman DH, Neufer PD. Mitochondrial H2O2 emission and cellular redox state link excess fat intake to insulin resistance in both rodents and humans. J Clin Invest. 2009;119:573–581. [DOI] [PMC free article] [PubMed] [Google Scholar]
- 32. Flagg TP, Cazorla O, Remedi MS, Haim TE, Tones MA, Bahinski A, Numann RE, Kovacs A, Schaffer JE, Nichols CG, Nerbonne JM. Ca2+‐independent alterations in diastolic sarcomere length and relaxation kinetics in a mouse model of lipotoxic diabetic cardiomyopathy. Circ Res. 2009;104:95–103. [DOI] [PubMed] [Google Scholar]
- 33. Dolinsky VW, Chan AY, Robillard Frayne I, Light PE, Des Rosiers C, Dyck JR. Resveratrol prevents the prohypertrophic effects of oxidative stress on LKB1. Circulation. 2009;119:1643–1652. [DOI] [PubMed] [Google Scholar]
- 34. Velagaleti RS, Gona P, Chuang ML, Salton CJ, Fox CS, Blease SJ, Yeon SB, Manning WJ, O'Donnell CJ. Relations of insulin resistance and glycemic abnormalities to cardiovascular magnetic resonance measures of cardiac structure and function: the Framingham Heart Study. Circ Cardiovasc Imaging. 2010;3:257–263. [DOI] [PMC free article] [PubMed] [Google Scholar]
- 35. Szwejkowski BR, Gandy SJ, Rekhraj S, Houston JG, Lang CC, Morris AD, George J, Struthers AD. Allopurinol reduces left ventricular mass in patients with type 2 diabetes and left ventricular hypertrophy. J Am Coll Cardiol. 2013;62:2284–2293. [DOI] [PubMed] [Google Scholar]


