

Abstract
Background
Improvements in hospital‐based care have reduced early mortality in congenital heart disease. Later adverse outcomes may be reducible by focusing on care at or after discharge. We aimed to identify risk factors for such events within 1 year of discharge after intervention in infancy and, separately, to identify subgroups that might benefit from different forms of intervention.
Methods and Results
Cardiac procedures performed in infants between 2005 and 2010 in England and Wales from the UK National Congenital Heart Disease Audit were linked to intensive care records. Among 7976 infants, 333 (4.2%) died before discharge. Of 7643 infants discharged alive, 246 (3.2%) died outside the hospital or after an unplanned readmission to intensive care (risk factors were age, weight‐for‐age, cardiac procedure, cardiac diagnosis, congenital anomaly, preprocedural clinical deterioration, prematurity, ethnicity, and duration of initial admission; c‐statistic 0.78 [0.75–0.82]). Of the 7643, 514 (6.7%) died outside the hospital or had an unplanned intensive care readmission (same risk factors but with neurodevelopmental condition and acquired cardiac diagnosis and without preprocedural deterioration; c‐statistic 0.78 [0.75–0.80]). Classification and regression tree analysis were used to identify 6 subgroups stratified by the level (3–24%) and nature of risk for death outside the hospital or unplanned intensive care readmission based on neurodevelopmental condition, cardiac diagnosis, congenital anomaly, and duration of initial admission. An additional 115 patients died after planned intensive care admission (typically following elective surgery).
Conclusions
Adverse outcomes in the year after discharge are of similar magnitude to in‐hospital mortality, warrant service improvements, and are not confined to diagnostic groups currently targeted with enhanced monitoring.
Keywords: congenital heart defects, health policy and outcomes research, pediatrics, risk model, risk stratification
Subject Categories: Quality and Outcomes, Congenital Heart Disease, Mortality/Survival
Introduction
The main focus in the audit of pediatric cardiac surgery has been operative mortality, expressed as either 30‐day mortality1 or mortality at hospital discharge.2 These very early outcomes have improved significantly over time,3, 4 but while relevant to quality assurance, they cannot inform service improvements outside the hospital setting. There remains a significant risk of death or clinical deterioration following discharge after “successful” surgery. For instance, “interstage mortality” for infants with hypoplastic left heart syndrome (HLHS) was 12% within a recent multicenter trial.5 Single‐center reports indicate that home monitoring programs of enhanced postdischarge surveillance for HLHS reduce interstage mortality,6, 7, 8, 9 but this practice is not universally implemented5 and local protocols vary.10 Studies of postdischarge outcomes for congenital heart disease (CHD) other than HLHS are sparse,11 and a greater understanding of the risk of adverse outcomes after discharge among the broader patient population could usefully inform quality improvement efforts.
To this end, we undertook a national study of outcomes in the first year after discharge from hospital among infants undergoing intervention for CHD. Our first aim was to measure the rates of adverse outcomes at 1 year among this population and then identify patient‐level factors independently associated with these outcomes. Our second, complementary aim was to identify groups of patients who might benefit from different interventions because of the differing nature and scale of risk that they face. The adverse events of interest to us were deaths in the community and any unplanned readmissions to intensive care, regardless of outcome, in the first year after discharge, because these are potentially avoidable through improved care at or after discharge. Deaths in the first year postdischarge that occurred after a planned readmission to intensive care (typically for elective surgery as part of a prospectively planned, staged treatment pathway) were not a focus of this work because they are less likely to be remediable through improvements to care at or after discharge.
This national study was possible because of the United Kingdom's unique combination of mandatory national audit data sets for pediatric cardiac procedures (the National Congenital Heart Disease Audit [NCHDA]12) and pediatric intensive care unit (PICU) admissions (the Paediatric Intensive Care Audit Network [PICANet]13), which is augmented in England and Wales with independently ascertained life status tracking.
Methods
Ethics
Approval was obtained from the London Central Research Ethics Committee (reference No. 12/LO/1398) and the National Health Service (NHS) Health Research Authority Confidentiality Advisory Group (reference No. ECC 6‐02 (FT5)/2012). Requirement for consent was waived.
Constructing the Data Set for Analyses
Data sources and patient population
Two national audit data sets were used: NCHDA12 and PICANet.13 Data submission to each audit is mandatory, subject to external data validation,14, 15 and each audit has approval from the relevant regulatory authorities for use of patient identifiable data. The survival status of patients in NCHDA is independently verified for patients of English and Welsh centers by the UK Health and Social Care Information Centre by using their patients’ unique identifier (NHS number).
All children who underwent their first interventional catheterization or cardiac surgery when younger than 1 year in the United Kingdom between January 1, 2005 and December 31, 2010 were identified in NCHDA (overseas patients without an NHS number were removed at this stage; patients treated in Northern Ireland and Scotland were later identified and excluded). Records within PICANet for these patients were then identified by a trusted third party using patient NHS number, and patients with record(s) in NHCDA but not in PICANet were removed and analyzed separately. Separate data extracts from each audit were provided to the study team, each with the same patient‐level identifier (pseudonymized NHS number). A single patient potentially had multiple procedure‐based records in the NCHDA extract and multiple admission‐based records in the PICANet extract. The study team constructed a single patient‐based analysis data set by linking events for the same patient using the patient‐level identifier, including cardiac‐related details and life status (NCHDA) and rich comorbidity and emergency PICU admission information (PICANet).
Defining the index admission and index procedure
The index admission for each child was defined as the continuous period as an inpatient within the pediatric cardiac center, including admission(s) to PICU, that included their first surgical procedure or their first definitive or initial staging interventional catheter procedure (see Data S1 for included catheterizations). This period defined the index length of stay (LOS). Within the NCHDA data set, each procedure is described based on up to 8 individual procedural International Paediatric and Congenital Cardiac Codes (IPCCCs).16 An algorithm developed by the NCHDA Steering Committee defines the specific procedure undertaken, based on the combinations of IPCCCs recorded. These defined “specific procedures” are listed in hierarchical order with the Norwood operation at the top and, for surgery, ligation of patent ductus arteriosus (PDA) at the bottom, with interventional catheter procedures appearing below surgeries in the hierarchy (see Data S1 for further details). For children who underwent >1 procedure during their index admission, their index intervention was chosen to be the most complex according to this hierarchy.
Exclusions
Children who underwent only catheter procedure(s) listed as exclusions in Data S1, premature babies who had ligation of PDA only, and cardiac transplant patients were excluded from our analysis because they have their own discharge and follow‐up care pathways. Patients treated in Northern Ireland and Scotland were also removed because they do not have verified life status.
Candidate Patient Risk Factors
Candidate nonmedical, preoperative and postoperative risk factors available in the patient‐based analysis data set that would be known at the point of discharge were identified: these are provided in Table 1 (with further details regarding the definitions in Data S1 and Tables S1–S4). Each child's primary cardiac diagnosis was identified based on a hierarchical IPCCC coding map,21 which also identified records where there was a concurrent acquired cardiac diagnosis. Other clinical information, including the presence of comorbid conditions and postoperative complications, was based on a mapping of Read codes.22 Where both audits contained information on a particular risk factor, the most complete source was used. Clinical variables with multiple parameters were necessarily collapsed into broad groups before statistical analyses to reduce the degrees of freedom and, hence, the risk of overfitting.23 Table 2 lists the diagnostic categories within each of the 4 primary cardiac groups used in the analyses.
Table 1.
Candidate Patient Risk Factors
| Candidate Factors | Categories (or Examples) |
|---|---|
| Nonmedical factors | |
| Deprivation | English index of multiple deprivation17 |
| Ethnicity | White, Mixed, Asian, Black, Chinese, “Other”, not stated18, 19 |
| Preprocedural risk factors | |
| Primary cardiac diagnosis group | Hypoplastic left heart syndrome (HLHS), functionally univentricular heart (UVH) or pulmonary atresia with intact ventricular septum (PA+IVS), isolated ventricular septal defect (VSD) (a recognizable biventricular comparator group), “other” (all remaining primary diagnoses consisting of a broad range of biventricular conditions) |
| Presence of an acquired cardiac diagnosis | For example, acquired atrioventricular block, cardiomyopathy, myocardial ischemia, endocardial fibroelastosis |
| Index procedure group | Initial staged, definitive repair, “ungrouped” |
| Presence of a congenital anomaly | For example, Downs syndrome, DiGeorge syndrome (22q11 deletion), urogenital/renal malformations, tracheal/tracheaoesophageal malformations, vision/hearing deficits and exomphalos/gastrointestinal malformations |
| Presence of a neurodevelopmental condition | For example, epilepsy/seizures, developmental delay, sleep apnea, hydrocephalus, retinopathy of prematurity, stroke, hemiparesis/hemiplegia, anoxic encephalopathy, cerebral venous sinus thrombosis and cerebral palsy |
| Prematurity | <37 completed weeks’ gestation |
| Sex | Male, female |
| Age at procedure | Age at index procedure |
| Weight‐for‐age at procedure | Calculated using World Health Organization reference standards20 |
| Antenatal diagnosis | Antenatal diagnosis of congenital heart defect |
| Clinical deterioration prior to index intervention | Emergency admission to intensive care involving retrieval by specialist team |
| Postprocedural risk factors | |
| Index admission length of stay | Continuous period as an inpatient within a specialist paediatric cardiac hospital or PICU that surrounds a child's first interventional cardiac procedure in infancy |
| Receipt of renal support or extracorporeal life support during index admission | Including dialysis and hemofiltration |
| Any adverse PICU events during index admission | For example, collapse or cardiac arrest, acquired injury or complications, a noncardiac operation |
| Postprocedural morbidity during index admission | For example, postprocedural pneumothorax, mediastinitis, chylothorax, cardiac arrest after procedure |
| Acquired comorbidities during index admission | For example, meconium aspiration syndrome, gastritis, liver failure, pneumonia, Clostridium difficile infection |
| Any catheter or surgical procedures performed in addition to index procedure | Either before or after the index procedure and within the index admission |
The candidate nonmedical, preoperative, and postoperative risk factors used in the analyses. These were all available in the patient‐based analysis data set and would be known at the point of discharge. See Data S1 and Tables S1–S4 for further details. PICU indicates pediatric intensive care unit.
Table 2.
Primary Cardiac Diagnosis Categories
| Cardiac Diagnosis Group | Primary Cardiac Diagnosis Category |
|---|---|
| Hypoplastic left heart syndrome (HLHS) | HLHS |
| Functionally univentricular heart (UVH) or pulmonary atresia (PA) with an intact ventricular septum (IVS) | UVH; PA+IVS |
| Isolated ventricular septal defect (VSD) | Isolated VSD±interatrial communication (atrioventricular septal defect [ASD])±patent ductus arteriosus (PDA) |
| Other | Common arterial trunk (truncus arteriosus); transposition of the great arteries (TGA)+VSD/double outlet right ventricle (DORV)‐TGA type; interrupted aortic arch; TGA (concordant atrioventricular and discordant ventriculoatrial connections) and intact ventricular septum; PA+VSD (including Fallot type); miscellaneous congenital primary diagnoses; ASD; Fallot/DORV‐Fallot type; aortic valve stenosis (isolated); tricuspid valve abnormality (including Ebstein); mitral valve abnormality (including supravalvar, subvalvar); totally anomalous pulmonary venous connection; aortic arch obstruction±VSD/ASD; pulmonary stenosis; subaortic stenosis (isolated); aortic regurgitation; interatrial communication (ASD); PDA; acquired noncongenital heart disease; arrhythmia; miscellaneous congenital terms; noncardiac or uncoded diagnosis |
The 4 primary cardiac diagnosis groups used in the analyses, which aggregate a set of 26 primary cardiac diagnosis categories, thereby reducing the degrees of freedom and, hence, the risk of overfitting.23 The primary cardiac diagnosis categories themselves are based on a hierarchical IPCCC coding map21 (see Table S2).
Missing data
Where ethnic group was not available from PICANet, the NCHDA ethnic code was used to assign White, Asian, or Black ethnicity (which showed strong concordance across the 2 audits); sensitivity analyses were performed excluding records without PICANet‐derived ethnicity. Weight‐for‐age outside the range ±5 z‐scores was assumed to be erroneous and treated as missing.
Outcomes
For the majority of our analyses, an adverse event was defined as either death outside a PICU admission (ie, “in the community”) or any emergency unplanned readmission to PICU, regardless of outcome, within 1 year after discharge from the index admission. We note the inclusion of nonfatal unplanned readmissions to PICU as these were considered “near misses” of relevance to informing service improvement. However, for the purposes of comparison with in‐hospital mortality rates and risk modeling, some analyses were restricted to fatal adverse events only (deaths outside a planned admission)—where this was the case, we state this clearly in the text. Note that this research was designed to inform improvements in services at discharge and in the community; therefore, we did not consider death within 1 year of discharge from the index admission that occurred during a planned readmission to intensive care (typically for elective surgery as part of a staged treatment pathway) as an adverse outcome. Such patients were important to include in the analysis, however, as the period before the second elective surgery in a staged treatment pathway is known to be particularly high risk for many patients.5 Age at death (if applicable) and life status were available in NCHDA, while emergency unplanned admissions to PICU were extracted from PICANet.
Statistical Methods
Descriptive and univariate analyses
Descriptive analyses were performed to characterize the data set, and univariate logistic regression analysis on complete case data was used to assess the relation of each candidate predictor with each outcome by using fractional polynomials to investigate departure from linearity. This informed which variables were considered in two additional, complementary strands of analysis: first, the development of a risk model for adverse event and, separately, for fatal adverse events only, to generate generalizable knowledge about the individual underlying risk factors; and second, the identification of patient groups differentiated by risk of adverse event to inform potential interventions that might benefit certain subgroups of the population.
Developing risk models for adverse events and for fatal adverse events only
The significant variables from the univariate analysis (P<0.10) were investigated in a multivariable model for each outcome in turn. Initially, models were developed in which the continuous predictors were used and, where appropriate, suitable transformations were included. For the final model presentation, continuous predictors were categorized based on considerations of model interpretability as well as statistical performance.
Multiple imputation (assuming data were missing at random) was used to account for missing data when fitting the multivariable models. The imputation models included all risk factors considered in the univariate analysis (which we assume includes all predictors of missingness). We generated 20 data sets and ran a full logistic regression, using the whole data set and implementing a bootstrap (200 samples) for each imputed data set to correct for overfitting. Significant predictors were selected based on the inclusion frequency of each predictor over the imputed data sets (ie, the proportion of times that the factor appeared in the model24; see Data S2 for further details). The final models were derived by fitting a logistic regression model for all significant predictors, and estimates were combined by using Rubin rules.25 Model performance was assessed in terms of discrimination and calibration. The c‐statistic (area under the receiver operator curve), corrected for overfitting by using the bootstrap, was used to summarize the discrimination of the models.26 The Hosmer–Lemeshow statistic was used to test calibration (goodness‐of‐fit), and the range of P‐values obtained over the 20 imputed data sets is presented.
Sensitivity of the results to adjustment for clustering at both the hospital level and the regional level (English Primary Care Trusts27) was assessed for each model by using the complete case data. All analyses were performed in Stata 13,28 and a value of P<0.05 was considered statistically significant unless otherwise stated.
Identifying patient groups differentiated by risk of adverse event
Classification and regression tree (CART) analysis was used to identify patient groups with different “profiles of risk” that could usefully inform the development of interventions targeted at different groups. For other examples of CART applications in health care, see references 29, 30, 31. The CART algorithm recursively partitioned the data into subsets that were as homogeneous as possible with respect to adverse event (ie, into subsets of increasing “purity”).32 All variables significantly associated with adverse event in univariate analysis were included in the CART analysis, with continuous variables entered in their categorized form as per final risk model development. To prevent overfitting, the CART groups were developed in a random 60% of the data and, for reasons of statistical robustness and potential usability, we restricted the tree depth to 4 and required a minimum of 100 cases for branching to continue, with at least 50 cases in either branch. The resulting classification tree was applied to the remaining 40% of the data set and the occurrence of adverse events among patients at each node was compared with the corresponding group in the development set to assess model stability. For both data sets, the c‐statistic was calculated by assessing the final group characterizations obtained in the derivation data set as a predictor for adverse event. All analysis was performed in SPSS 22.33
Results
Data Set
A total of 12 390 infants meeting the inclusion criteria and with a valid patient identifier were identified in NCHDA, of whom 9385 (76%) were linked to ≥1 record in PICANet. Of these, 115 children who had an excluded catheter procedure only, 765 premature babies who had ligation of PDA only, 24 cardiac transplant patients, and 505 patients from Scotland or Northern Ireland were removed. Of 3005 patients who had no linked PICANet record, 1225 would not have been included in our study as they were either from Scotland or Northern Ireland or were premature and undergoing a PDA procedure only. The remaining 1780 demonstrated a greater prevalence of minor forms of CHD than did patients in the study data set.
Of the 7976 patients included in our study, 333 (4.2%) died during their index admission and were excluded from our analyses, leaving a final analysis data set of 7643 infants who were discharged alive from their index admission. Of these, 246 (3.2%) died within 1 year after discharge from the index admission and not during a planned admission (fatal adverse events), and 514 (6.7%) either died or had an emergency unplanned readmission to PICU within 1 year (all adverse events). Finally, 115 (1.5%) children died during a planned admission to PICU within 1 year after discharge from the index admission (not considered an outcome in our analysis), giving an overall mortality within the year after discharge from index admission of 4.7%.
Descriptive and Univariate Analyses
A summary of the descriptive and univariate logistic regression analyses is presented in the Data S2. There was no association identified with either outcome (fatal adverse events or all adverse events) and with either sex or the performance of additional cardiac catheterizations during the index procedure.
Developing Risk Models for Adverse Events and for Fatal Adverse Events Only
In the multivariable analysis in which continuous variables were treated as such, the significant risk factors for both outcomes were age at procedure, weight‐for‐age z‐score, index procedure group, cardiac diagnosis group, noncardiac congenital anomaly, prematurity, ethnicity, and LOS in a specialist center. Preprocedural clinical deterioration was additionally significant to fatal adverse events only, while neurodevelopmental condition and acquired cardiac diagnoses were additionally significant to all adverse events. Details of these continuous regression models are presented in the Data S2. In the final model development, the continuous predictors were categorized as follows: age at index procedure (>3 months old, 1–2 months old, 10–30 days, 0–10 days old); weight‐for‐age z‐score (>−2 SDs, −2 to −4 SDs, <−4 SDs); and length of stay (0–7 days, 7–30 days, >1 month). Details of the final regression models for fatal adverse events and all adverse events are shown in Tables 3 and 4. For all models, adjusting for clustering at either the hospital or regional level had no statistically significant impact on results when comparing models using Akaike criteria (we present the unadjusted results).
Table 3.
Final Logistic Regression Model for Fatal Adverse Events Only
| Patient Variable | Overall No. (%) | No. of (%) Fatal Adverse Events | Odds Ratio | SE | 95% CI |
|---|---|---|---|---|---|
| Ethnicity | |||||
| White | 5728 (75.0) | 166 (2.9) | Reference category | ||
| Mixed | 196 (2.6) | 4 (2.0) | 0.68 | 0.35 | 0.25–1.88 |
| Asian | 867 (11.3) | 38 (4.4) | 1.38 | 0.26 | 0.95–2.01 |
| Black | 345 (4.5) | 12 (3.5) | 1.00 | 0.31 | 0.54–1.85 |
| Chinese | 28 (0.4) | 3 (3.6) | 1.46 | 1.53 | 0.19–11.43 |
| Other | 133 (1.7) | 12 (9.0) | 2.82 | 0.94 | 1.46–5.44 |
| Not stated | 346 (4.5) | 13 (3.8) | 1.53 | 0.47 | 0.85–2.78 |
| Cardiac diagnosis group | |||||
| VSD | 1348 (17.6) | 25 (1.9) | Reference category | ||
| HLHS | 390 (5.1) | 48 (12.3) | 3.07 | 0.97 | 1.65–5.71 |
| UVH or PA+IVS | 531 (7.0) | 41 (7.7) | 2.31 | 0.69 | 1.29–4.15 |
| Other | 5374 (70.3) | 132 (2.5) | 1.12 | 0.26 | 0.70–1.77 |
| Specific procedure group | |||||
| Corrective | 4973 (65.1) | 86 (1.7) | Reference category | ||
| Palliative | 1629 (21.3) | 119 (7.3) | 2.14 | 0.38 | 1.50–3.04 |
| Ungrouped | 1041 (13.6) | 41 (3.9) | 1.77 | 0.36 | 1.20–2.63 |
| Congenital anomaly | |||||
| No | 6035 (79.0) | 156 (2.6) | Reference category | ||
| Yes | 1608 (21.0) | 90 (5.6) | 2.43 | 0.37 | 1.81–3.27 |
| Prematurity | |||||
| No | 4714 (61.7) | 161 (3.4) | Reference category | ||
| Yes | 828 (10.8) | 44 (5.3) | 1.64 | 0.30 | 1.16–2.34 |
| Clinical deterioration | |||||
| No | 6174 (80.8) | 161 (2.6) | Reference category | ||
| Yes | 1469 (19.2) | 85 (5.8) | 1.66 | 0.24 | 1.25–2.22 |
| Age at index procedure | |||||
| >3 mo | 3202 (41.9) | 55 (1.7) | Reference category | ||
| 1–2 mo | 1427 (18.7) | 45 (3.2) | 1.32 | 0.28 | 0.87–2.01 |
| 10–30 d | 1114 (14.6) | 43 (3.9) | 1.89 | 0.45 | 1.19–3.02 |
| 0–10 d | 1900 (24.9) | 103 (5.4) | 2.54 | 0.60 | 1.61–4.03 |
| Weight‐for‐age z‐score | |||||
| >−2 SDs | 4064 (53.2) | 128 (3.1) | Reference category | ||
| −2 to −4 SDs | 2467 (32.3) | 71 (2.9) | 1.59 | 0.28 | 1.12–2.26 |
| <−4 SDs | 584 (7.6) | 19 (3.3) | 2.28 | 0.61 | 1.34–3.87 |
| Index length of stay | |||||
| 0–7 d | 2564 (33.5) | 35 (1.4) | Reference category | ||
| 7–30 d | 4327 (56.6) | 146 (3.4) | 1.56 | 0.31 | 1.06–2.31 |
| >1 mo | 752 (9.8) | 65 (8.6) | 2.70 | 0.63 | 1.71–4.26 |
Details of the final regression model for fatal adverse events (death within a year after discharge from the index admission and not during a planned admission). For each patient variable the number (percentage) of fatal adverse events, multivariable odds ratios, standard errors and 95% confidence intervals are presented and the reference category indicated. The overall number (percentage) of patients within each category for a given patient variable is also noted. HLHS indicates hypoplastic left heart syndrome; PA+IVS, pulmonary atresia with an intact ventricular septum; PICU, pediatric intensive care unit; UVH, functionally univentricular heart; VSD, ventricular septal defect.
Table 4.
Final Logistic Regression Model for Adverse Event
| Patient Variable | Overall Number (%) | Number (%) Adverse Events | OR | SE | 95% CI |
|---|---|---|---|---|---|
| Ethnicity | |||||
| White | 5728 (75.0) | 348 (6.1) | Reference category | ||
| Mixed | 196 (2.6) | 9 (4.6) | 0.63 | 0.23 | 0.31–1.29 |
| Asian | 867 (11.3) | 73 (8.4) | 1.21 | 0.17 | 0.92–1.61 |
| Black | 345 (4.5) | 34 (9.9) | 1.43 | 0.29 | 0.96–2.12 |
| Chinese | 28 (0.4) | 1 (3.6) | 0.65 | 0.68 | 0.09–5.02 |
| Other | 133 (1.7) | 19 (14.3) | 2.39 | 0.65 | 1.40–4.08 |
| Not stated | 346 (4.5) | 30 (8.7) | 1.76 | 0.37 | 1.16–2.65 |
| Cardiac diagnosis group | |||||
| VSD | 1348 (17.6) | 60 (4.5) | Reference category | ||
| HLHS | 390 (5.1) | 70 (18.0) | 2.46 | 0.58 | 1.55–3.90 |
| UVH or PA+IVS | 531 (7.0) | 73 (13.8) | 2.15 | 0.46 | 1.41–3.28 |
| Other | 5374 (70.3) | 311 (5.8) | 1.20 | 0.19 | 0.88–1.64 |
| Specific procedure group | |||||
| Corrective | 4973 (65.1) | 219 (4.4) | Reference category | ||
| Palliative | 1629 (21.3) | 205 (12.6) | 1.65 | 0.21 | 1.28–2.13 |
| Ungrouped | 1041 (13.6) | 90 (8.7) | 1.61 | 0.22 | 1.23–2.11 |
| Congenital anomaly | |||||
| No | 6035 (79.0) | 305 (5.1) | Reference category | ||
| Yes | 1608 (21.0) | 209 (13.0) | 2.71 | 0.29 | 2.19–3.35 |
| Neurodevelopment condition | |||||
| No | 7336 (96.0) | 439 (6.0) | Reference category | ||
| Yes | 307 (4.0) | 75 (24.4) | 2.81 | 0.44 | 2.06–3.82 |
| Prematurity | |||||
| No | 4714 (61.7) | 340 (7.2) | Reference category | ||
| Yes | 828 (10.8) | 93 (11.2) | 1.59 | 0.21 | 1.22–2.06 |
| Acquired diagnosis | |||||
| No | 7164 (93.7) | 457 (6.4) | Reference category | ||
| Yes | 479 (6.3) | 57 (11.9) | 1.85 | 0.30 | 1.35–2.53 |
| Age at index procedure | |||||
| >3 months old | 3202 (41.9) | 129 (4.0) | Reference category | ||
| 1–2 months old | 1427 (18.7) | 110 (7.7) | 1.59 | 0.23 | 1.20–2.10 |
| 10–30 days | 1114 (14.6) | 90 (8.1) | 2.21 | 0.37 | 1.59–3.06 |
| 0–10 days old | 1900 (24.9) | 185 (9.7) | 2.93 | 0.48 | 2.12–4.04 |
| Weight‐for‐age z‐score | |||||
| >−2SD | 4064 (53.2) | 243 (6.0) | Reference category | ||
| −2 to −4 SD | 2467 (32.3) | 168 (6.8) | 1.72 | 0.22 | 1.34–2.21 |
| <−4SD | 584 (7.6) | 50 (8.6) | 2.60 | 0.48 | 1.81 to 3.75 |
| Index length of stay | |||||
| 0–7 days | 2564 (33.5) | 84 (3.3) | Reference category | ||
| 7–30 days | 4327 (56.6) | 302 (7.0) | 1.54 | 0.21 | 1.19–2.00 |
| >1 month | 752 (9.8) | 128 (17.0) | 2.73 | 0.44 | 1.99–3.75 |
Details of the final regression model for adverse event (either death or an emergency unplanned readmission to PICU within 1 year after discharge from the index admission). For each patient variable, the number (percentage) of adverse events, the multivariable odds ratios, SEs, and 95% CIs are presented and the reference category indicated. The overall number (percentage) of patients within each category for a given patient variable is also noted. HLHS indicates hypoplastic left heart syndrome; PA+IVS, pulmonary atresia with an intact ventricular septum; PICU, pediatric intensive care unit; UVH, functionally univentricular heart; VSD, ventricular septal defect.
The c‐statistic of the final (categorical) model for fatal adverse events was 0.78 (95% CI 0.75–0.82), indicating good discrimination (and only marginally less discriminative than the continuous model, c‐statistic 0.80). The final (categorical) model for all adverse events also showed good discrimination with a combined c‐statistic of 0.78 (0.75–0.80) compared with 0.78 for the continuous model. Calibration of the final categorical and continuous models for both outcomes was also good, with Hosmer–Lemeshow P‐values ranging from 0.10 to 0.75 across the models fitted on the 20 imputed data sets, indicating no statistically significant differences between observed and expected number of deaths when calculated in deciles of predicted risk for each of the imputed data sets.
Identifying Patient Groups Differentiated by Risk of Adverse Event
The Figure depicts the final tree generated with the CART analysis including the rate of adverse events and number of patients within each of the 6 discrete patient groups that were generated (further details presented in Table 5). Of the 18 candidate risk factors entered in the analysis, CART identified presence/absence of a neurodevelopmental condition (24% risk among 307 patients) as the best single discriminator between patients experiencing an adverse event or not. For those without a neurodevelopmental condition, the next best discriminator was whether the cardiac diagnosis was HLHS or (functionally univentricular heart/pulmonary atresia with an intact ventricular septum) (15.2% risk among 868 patients). For patients with neither of the first 2 risk factors, the next best discriminator was presence/absence of a congenital anomaly followed by the LOS (threshold 1 month) (8.6% risk in patients with a congenital anomaly and LOS of <1 month, 24% in patients with congenital anomaly and LOS of >1 month, and 9.3% in patients with no congenital anomaly and LOS of >1 month). The remaining 4778 low‐risk patients with none of the above factors had an adverse event rate of 2.8%. The development and test sets had c‐statistics of 0.73 and 0.74, respectively.
Figure 1.
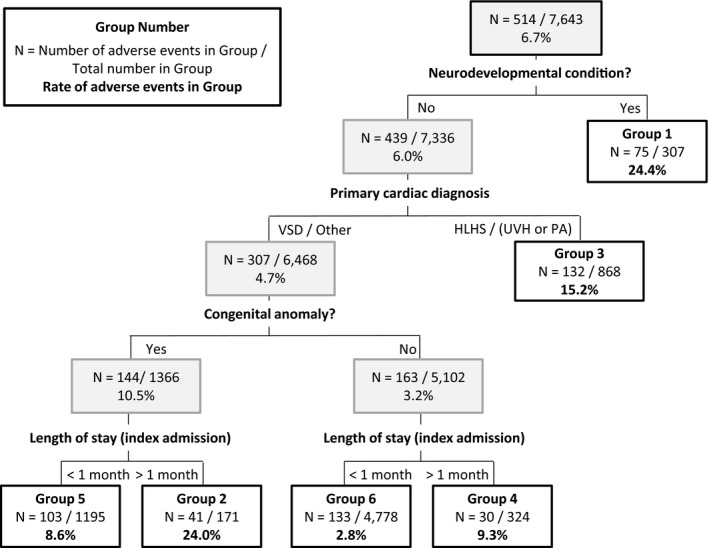
Classification and regression tree (CART) analysis. The stratification tree generated by the CART analysis and evaluated across the entire data set (see Table 5 for a breakdown by development and test set). The number and rate of adverse events and the total number of patients are given for each node. HLHS indicates hypoplastic left heart syndrome; PA, pulmonary atresia; UVH, functionally univentricular heart; VSD, ventricular septal defect.
Table 5.
Patient Groups Identified by Using CART Analysis
| Patient Group | Group Characteristics | Possible Additional Risk Factors [% Patient Group] | No. of Patients | No. (%) of Adverse Events | ||||
|---|---|---|---|---|---|---|---|---|
| Development Set | Test Set | Entire Dataset | Development Set | Test Set | Entire Dataset | |||
| 1 | Neurodevelopmental condition(s) |
May also have: Congenital anomalies [52%] HLHS, UVH/PA+IVS [17%] LOS >1 mo [26%] |
192 | 115 | 307 | 53 (28%) | 22 (19%) | 75 (24%) |
| 2 |
No neurodev. conditions VSD/other Congenital anomalies LOS >1 mo |
— | 95 | 76 | 171 | 20 (21%) | 21 (28%) | 41 (24%) |
| 3 |
No neurodev. conditions HLHS, UVH/PA+IVS |
May also have: congenital anomalies [10%] LOS >1 mo [20%] |
524 HLHS=219 UVH/PA+IVS=305 |
344 HLHS=147 UVH/PA+IVS=197 |
868 HLHS=366 UVH/PA+IVS=502 |
82 (16%) HLHS=37 (17%) UVH/PA+IVS=45 (15%) |
50 (15%) HLHS=28 (19%) UVH/PA+IVS=22 (11%) |
132 (15%) HLHS=65 (18%) UVH/PA+IVS=67 (13%) |
| 4 |
No neurodev. conditions VSD/other No congenital anomalies LOS >1 mo |
— | 189 | 135 | 324 | 20 (11%) | 10 (7%) | 30 (9%) |
| 5 |
No neurodev. conditions VSD/other Congenital anomalies LOS <1 mo |
— | 701 | 494 | 1195 | 60 (9%) | 43 (9%) | 103 (9%) |
| 6 |
No neurodev. conditions VSD/other No congenital anomalies LOS <1 mo |
— | 2898 | 1880 | 4778 | 88 (3%) | 45 (2%) | 133 (3%) |
We list the patient characteristics that define each group in terms of combinations of ≥1 of the following: absence/presence of neurodevelopmental (neurodev.) condition; absence/presence of congenital anomaly; low‐risk/high‐risk primary cardiac diagnosis; index length of stay >1 or <1 month. For each group, the number of patients and occurrence of adverse events in the development, test, and overall data set are provided. For patient group 3, figures are also provided for the 2 subcategories of primary cardiac diagnosis within the high‐risk group, namely hypoplastic left heart syndrome (HLHS) or functionally univentricular heart (UVH)/pulmonary atresia with intact ventricular septum (PA+IVS). CART indicates classification and regression tree; LOS, length of stay (index admission).
Discussion
Outcomes and Risk Factors
The causes of attrition after hospital discharge are poorly understood compared with adverse events occurring in hospital, yet as in‐hospital care improves, these postdischarge deaths are becoming increasingly numerically significant. Of 7976 patients who had undergone an intervention for CHD in infancy, representing the caseload for England and Wales over a 6‐year period, 333 (4.2%) died during their index admission. Of those discharged alive, 246 (3.2%) died either outside the specialist hospital or after an emergency unplanned PICU readmission within 1 year (fatal adverse events). An additional 268 patients (3.6%) experienced unplanned urgent readmission to an intensive care unit but subsequently survived (“near misses”), giving a combined total of 514 (6.7%) adverse events. The data set was generated by linking 2 national audits, each documenting variables potentially associated with these postdischarge outcomes.
The following risk factors have previously been linked to adverse postdischarge outcomes: primary diagnosis (in particular, HLHS and other diagnoses requiring an initial palliative [staged] procedure34, 35), noncardiac congenital anomalies35, 36, prematurity37, prolonged LOS35, 36 (indicating greater complexity and perhaps a surrogate for postprocedural complications38), and ethnicity.5 The risk models in our study further identified lower weight‐for‐age at procedure (which may correlate with feeding difficulties in infancy, a known risk factor39); additional acquired cardiac diagnoses and preoperative clinical deterioration (which may relate to studies indicating that severer forms of a given type of CHD are at risk of poor postdischarge outcome5, 40); neurodevelopmental conditions (which may overlap with noncardiac anomalies); and younger age at surgery (which, in contrast to studies specifically relating to HLHS that indicate older age at surgery increases risk of interstage death,41, 42 may reflect a broader effect such as young neonates being at higher risk than older infants34, 35).
Informing Quality Improvement
The data presented reflect outcomes within the context of recent historical provision of services for infants with major CHD and are potentially insightful for ongoing quality improvement initiatives. To this end, we used CART analysis to identify patient groups with different “profiles of risk” (ie, defined by both their level of risk and the nature of that risk) who might benefit from specific interventions. The 6 groups that were identified have levels of risk of adverse event between 3% and 24%, which is informative when considering which groups may be a priority for intervention, while the clinical characteristics underlying the risk of each patient group (defined in terms of neurodevelopmental conditions; cardiac diagnosis of HLHS, functionally univentricular heart, or pulmonary atresia with an intact ventricular septum; congenital anomalies; LOS >1 month) can inform the type of intervention that might be most appropriate. For example, group 3 consists of those patients most widely recognized as vulnerable to late death and offered enhanced surveillance, namely patients with cardiac diagnoses of HLHS and other functionally univentricular heart conditions.43 For example, single‐center studies from the United States7, 8, 43 and Germany9 suggest that postdischarge packages for HLHS (home monitoring programs) reduce interstage mortality. However, groups 1 and 2 have a higher occurrence of adverse events, suggesting that it may also be important to mitigate risks arising from patient factors beyond cardiac diagnosis, in particular clinically significant neurodevelopmental conditions and congenital anomalies. The type of intervention appropriate for these typically complex and lifelong comorbidities may be very different from those currently aimed at mitigating the cardiac risk of functionally single‐ventricle and shunt‐dependent infants.
Strengths and Weaknesses
The national audit data underpinning this study offer a unique opportunity for a population‐based analysis of surgically treated infants with CHD. First, the data are of high quality as demonstrated by the results of a regular systematic independent validation process.14, 15 Second, the NHS number enabled late deaths outside treatment centers to be reliably ascertained by using life status tracking and enabled linkage between the two national audit data sets allowing their respective, and complementary, content to be used. Third, mandatory data submission means that all procedures for CHD are captured, the only exclusions being patients who traveled from overseas specifically for treatment (since these do not have an NHS number and would not form part of the follow‐up program for UK specialist centers); patients in NCHDA who could not be linked to any records in PICANet (which includes those cared for only in neonatal units, those with a missing NHS number in PICANet, and those who did not require intensive care admission in either a neonatal unit or PICU for the procedure), and who represent predominantly more minor forms of CHD including a large proportion of PDA‐only procedures and patients who are provided with follow‐up by other specialist teams (eg, transplant recipients, premature infants without CHD). Our findings may therefore be considered more generalizable than those based on single‐center studies or those from a more limited geographical area.
There are inherent limitations to using registry‐based data, including the inevitable reliance on the data items that were routinely captured, which did not incorporate every potential variable of interest. Examples of important data that we could not access include the presence of residual lesions such as atrioventricular valve regurgitation, which is a known risk factor for late death in HLHS,5 and information that is available later in the patient journey from outside the hospital such as weight gain, which is linked to late outcome.39 There was a need to form tractable groupings from the vast range of diagnostic and procedure codes available to reduce the degrees of freedom for statistical analyses. Given our primary objective to inform quality improvement initiatives directed against late deterioration and death, we prioritized identification of diagnoses known to be high risk, namely HLHS and functionally single‐ventricle patients.
Our study outcomes inevitably reflect recent health services specific to the United Kingdom as provided by the NHS and, further, relate to the English and Welsh populations in terms of ethnicity, which has known links to the distribution of congenital anomalies.44 Evidence from North American studies suggests higher mortality for infants with CHD from Black and Hispanic ethnic groups, this being linked to reduced access to care45, 46, 47, 48; however, these ethnic groupings are not representative of our study population. The ethnicity category “Other” in our data set was found to be at greater multivariable risk of adverse late outcome, whereas the more prevalent Asian and Black ethnic groups were not. Information from the UK Census suggests this category is largely comprised of individuals born in the Far East (Philippines, Japan, Thailand, and Vietnam), Middle East, and North Africa.49 Infants with CHD from these ethnic groups could be in newly immigrant families where treatment may occur later in the disease process or access to care may be compromised for cultural or linguistic reasons. Interestingly, in our analysis, socioeconomic status (English index of multiple deprivation17) was not associated with outcome, in contrast to related data from North America.5, 37
Conclusion
Our findings demonstrate that later unexpected deaths are comparable in scale to early deaths after major intervention for CHD and that, while further improvements in early mortality are possible and important, there may arguably be a diminishing return to improvement initiatives in the perioperative period compared with the postdischarge period because of the relative lack of attention to the latter to date. We note that guidelines for the entire discharge process in “high‐risk infants” (not including CHD) have been proposed by the American Academy of Pediatrics with the aim of reducing variability and maintaining predetermined levels of care,50 and our study suggests that something similar is warranted for CHD. This would require the development of appropriate intervention packages for patients with different needs, and our findings provide a valuable starting point in designing these. In particular, they show that adverse late outcomes are not confined to diagnostic groups currently targeted with enhanced monitoring in some services (ie, HLHS patients) and that subgroups of patients with neurodevelopmental conditions or congenital anomalies could also benefit from targeted intervention. Finally, to stimulate improvement initiatives aimed at reducing late adverse outcomes and to align activity across organizations responsible for the care of these patients, 1‐year outcome after intervention for CHD in infancy may be a useful quality metric for pediatric cardiac surgery programs to complement the current focus on early mortality rates of surgery at 30 days or hospital discharge.
Sources of Funding
This project was funded by the National Institute for Health Research (NIHR) Health Services and Delivery Research (HS&DR) Programme (Project No: 10/2002/29). The views and opinions expressed therein are those of the authors and do not necessarily reflect those of the NIHR HS&DR Programme or the Department of Health. Further information about the Infant Heart Study can be found on the following NIHR website: http://www.nets.nihr.ac.uk/projects/hsdr/10200229. Additional support was provided by the Health Foundation, an independent charity working to continuously improve the quality of health care in the United Kingdom. The National Congenital Heart Disease Audit and the Paediatric Intensive Care Audit Network are funded by the National Clinical Audit & Patient Outcomes Programme, administered by the Healthcare Quality Improvement Partnership. PICANet is also funded by Welsh Health Specialised Services Committee; National Health Service (NHS) Lothian/National Service Division NHS Scotland, the Royal Belfast Hospital for Sick Children, National Office of Clinical Audit Ireland, and HCA International. Dr Utley was in part supported by the National Institute for Health Research (NIHR) Collaboration for Leadership in Applied Health Research and Care North Thames at Bart's Health NHS Trust. The views expressed are those of the author(s) and not necessarily those of the NHS, the NIHR, or the Department of Health.
Disclosures
None.
Supporting information
Data S1. Supplemental methods.
Table S1. Summary of Candidate Patient Risk Factors
Table S2. Primary Cardiac Diagnosis Hierarchy and Collapsed Groupings
Table S3. Coding Scheme for Noncardiac Diagnoses and Comorbidities
Table S4. Postprocedural Morbidities
Data S2. Supplemental results.
(J Am Heart Assoc. 2016;5:e003369 doi: 10.1161/JAHA.116.003369)
References
- 1. Crowe S, Brown KL, Pagel C, Muthialu N, Cunningham D, Gibbs J, Bull C, Franklin R, Utley M, Tsang VT. Development of a diagnosis‐ and procedure‐based risk model for 30‐day outcome after pediatric cardiac surgery. J Thorac Cardiovasc Surg. 2013;145:1270–1278. [DOI] [PubMed] [Google Scholar]
- 2. Jacobs JP, O'Brien SM, Pasquali SK, Jacobs ML, Lacour‐Gayet FG, Tchervenkov CI, Austin EH, Pizarro C, Pourmoghadam KK, Scholl FG, Welke KF, Mavroudis C. Variation in outcomes for benchmark operations: an analysis of the Society of Thoracic Surgeons Congenital Heart Surgery Database. Ann Thorac Surg. 2012;92:2184–2192. [DOI] [PMC free article] [PubMed] [Google Scholar]
- 3. Vinocur JM, Menk JS, Connett J, Moller JH, Kochilas LK. Surgical volume and center effects on early mortality after pediatric cardiac surgery: 25‐year North American experience from a multi‐institutional registry. Pediatr Cardiol. 2013;34:1226–1236. [DOI] [PMC free article] [PubMed] [Google Scholar]
- 4. Brown K, Crowe S, Franklin R, McLean A, Cunningham D, Barron D, Tsang V, Pagel C, Utley M. Trends in 30‐day mortality rate and case mix for paediatric cardiac surgery in the UK between 2000 and 2010. Open Heart. 2015;2:e000157. [DOI] [PMC free article] [PubMed] [Google Scholar]
- 5. Ghanayem NS, Allen KR, Tabbutt S, Atz AM, Clabby ML, Cooper DS, Eghtesady P, Frommelt PC, Gruber PJ, Hill KD, Kaltman JR, Laussen PC, Lewis AB, Lurito KJ, Minich LL, Ohye RG, Schonbeck JV, Schwartz SM, Singh RK, Goldberg CS; Pediatric Heart Network Investigators . Interstage mortality after the Norwood procedure: results of the multicenter Single Ventricle Reconstruction trial. J Thorac Cardiovasc Surg. 2012;144:896–906. [DOI] [PMC free article] [PubMed] [Google Scholar]
- 6. Ghanayem NS, Hoffman GM, Mussatto KA, Cava JR, Frommelt PC, Rudd NA, Steltzer MM, Bevandic SM, Frisbee SS, Jaquiss RDB, Litwin SB, Tweddell JS. Home surveillance program prevents interstage mortality after the Norwood procedure. J Thorac Cardiovasc Surg. 2003;126:1367–1377. [DOI] [PubMed] [Google Scholar]
- 7. Ghanayem NS, Cava JR, Jaquiss RDB, Tweddell JS. Home monitoring of infants after stage one palliation for hypoplastic left heart syndrome. Semin Thorac Cardiovasc Surg Pediatr Card Surg Annu. 2004;7:32–38. [DOI] [PubMed] [Google Scholar]
- 8. Dobrolet NC, Nieves JA, Welch EM, Khan D, Rossi AF, Burke RP, Zahn EM. New approach to interstage care for palliated high‐risk patients with congenital heart disease. J Thorac Cardiovasc Surg. 2011;142:855–860. [DOI] [PubMed] [Google Scholar]
- 9. Hansen JH, Furck AK, Petko C, Buchholz‐Berdau R, Voges I, Scheewe J, Rickers C, Kramer H‐H. Use of surveillance criteria reduces interstage mortality after the Norwood operation for hypoplastic left heart syndrome. Eur J Cardiothorac Surg. 2012;41:1013–1018. [DOI] [PubMed] [Google Scholar]
- 10. Tregay J, Wray J, Crowe S, Knowles R, Daubeney P, Franklin R, Barron D, Hull S, Barnes N, Bull C, Brown KL. Going home after infant cardiac surgery: a UK qualitative study. Arch Dis Child. 2016;101:320–325. doi: 10.1136/archdischild‐2015‐308827. [DOI] [PMC free article] [PubMed] [Google Scholar]
- 11. Tregay J, Wray J, Bull C, Franklin RC, Daubeney P, Barron DJ, Brown K, Knowles RL. Unexpected deaths and unplanned re‐admissions in infants discharged home after cardiac surgery: a systematic review of potential risk factors. Cardiol Young. 2015;25:839–852. [DOI] [PubMed] [Google Scholar]
- 12. National Institute for Cardiovascular Outcomes Research (NICOR), University College London . NICOR congenital heart disease audit website [Internet]. 2015. Available at: https://nicor4.nicor.org.uk/CHD/an_paeds.nsf/vwContent/home?Opendocument. Accessed February 13, 2015.
- 13. University of Leicester, University of Leeds . Paediatric Intensive Care Audit Network (PICANet) website [Internet]. 2015. Available at: http://www.picanet.org.uk/. Accessed February 13, 2015.
- 14. Clarke DR, Breen LS, Jacobs ML, Franklin RCG, Tobota Z, Maruszewski B, Jacobs JP. Verification of data in congenital cardiac surgery. Cardiol Young. 2008;18:177–187. [DOI] [PubMed] [Google Scholar]
- 15. Annual report of the Paediatric Intensive Care Audit Network 2014—Tables and Figures [Internet]. Available at: http://www.picanet.org.uk/Documentation/Annual-Reports. Accessed December 13, 2014.
- 16. IPCCC . International Paediatric and Congenital Cardiac Code (IPCCC) Home Page [Internet]. 2012. Available at: www.ipccc.net. Accessed April 12, 2012.
- 17. LHO . English Indices of Deprivation 2010—deprivation category lookups and average scores for higher geographies [Internet]. 2011. Available at: http://www.apho.org.uk/resource/view.aspx?RID=111277. Accessed February 13, 2015.
- 18. Office for National Statistics . Guidance and methodology: Ethnic group [Internet]. 2011. Available at: http://ons.gov.uk/ons/guide-method/measuring-equality/equality/ethnic-nat-identity-religion/ethnic-group/index.html#1. Accessed February 13, 2015.
- 19. Brown K, Wray J, Knowles R, Crowe S, Tregay J, Ridout D, Barron D, Cunningham D, Parslow RC, Franklin R, Barns N, Hull S, Bull C. Project grant report: infant deaths in the UK community following successful cardiac surgery—building the evidence base for optimal surveillance. Under review; 2015. [PubMed]
- 20. WHO Multicentre Growth Reference Study Group . WHO Child Growth Standards: Length/Height‐for‐age, Weight‐for‐age, Weight‐for‐length, Weight‐for‐height and Body Mass Index‐for age. Methods and Development. 2006. ISBN 92 4 154693 X. [Google Scholar]
- 21. Brown KL, Crowe S, Pagel C, Bull C, Muthialu N, Gibbs J, Cunningham D, Utley M, Tsang VT, Franklin R. Use of diagnostic information submitted to the United Kingdom Central Cardiac Audit Database: development of categorisation and allocation algorithms. Cardiol Young. 2013;23:491–498. [DOI] [PubMed] [Google Scholar]
- 22. Health and Social Care Information Centre . Read codes [Internet]. Available at: https://isd.hscic.gov.uk/trud3/user/guest/group/0/home. Accessed December 18, 2014.
- 23. Harrell FE, Lee KL, Califf RM, Pryor DB, Rosati RA. Regression modelling strategies for improved prognostic prediction. Stat Med. 1984;3:143–152. [DOI] [PubMed] [Google Scholar]
- 24. Heymans MW, van Buuren S, Knol DL, van Mechelen W, de Vet HC. Variable selection under multiple imputation using the bootstrap in a prognostic study. BMC Med Res Methodol. 2007;7:33. [DOI] [PMC free article] [PubMed] [Google Scholar]
- 25. Rubin DB. Multiple imputation for nonresponse in surveys [Internet]. John Wiley & Sons, Inc.; 1987. Available at: http://onlinelibrary.wiley.com/doi/10.1002/9780470316696.fmatter/summary. Accessed February 13, 2015. [Google Scholar]
- 26. Harrell FE, Lee KL, Mark DB. Multivariable prognostic models: issues in developing models, evaluating assumptions and adequacy, and measuring and reducing errors. Stat Med. 1996;15:361–387. [DOI] [PubMed] [Google Scholar]
- 27. Department of Health . The NHS Plan: a plan for investment, a plan for reform [Internet]. 2000. Available at: http://webarchive.nationalarchives.gov.uk/+/www.dh.gov.uk/en/publicationsandstatistics/publications/publicationspolicyandguidance/dh_4002960. Accessed February 13, 2015.
- 28. Stata Statistical Software. College Station, TX: StataCorp LP.; 2011. [Google Scholar]
- 29. Harper PR. A review and comparison of classification algorithms for medical decision making. Health Policy. 2005;71:315–331. [DOI] [PubMed] [Google Scholar]
- 30. Garbe C, Büttner P, Bertz J, Burg G, d'Hoedt B, Drepper H, Guggenmoos‐Holzmann I, Lechner W, Lippold A, Orfanos CE, Peters A, Rassner G, Stadler R, Stroebel W. Primary cutaneous melanoma. Identification of prognostic groups and estimation of individual prognosis for 5093 patients. Cancer. 1995;75:2484–2491. [DOI] [PubMed] [Google Scholar]
- 31. Fonarow GC, Adams KF, Abraham WT, Yancy CW, Boscardin W; ADHERE Scientific Advisory Committee, Study Group, and Investigators f . Risk stratification for in‐hospital mortality in acutely decompensated heart failure: classification and regression tree analysis. JAMA. 2005;293:572–580. [DOI] [PubMed] [Google Scholar]
- 32. Breiman L, Friedman J, Olshen R, Stone C, Steinberg D, Colla P. CART: Classification and Regression Trees. Belmont, CA: Wadsworth; 1983:156. [Google Scholar]
- 33. IBM SPSS Statistics. Armonk, NY: IBM Corp; 2013. [Google Scholar]
- 34. Chang R‐KR, Rodriguez S, Lee M, Klitzner TS. Risk factors for deaths occurring within 30 days and 1 year after hospital discharge for cardiac surgery among pediatric patients. Am Heart J. 2006;152:386–393. [DOI] [PubMed] [Google Scholar]
- 35. Kogon B, Jain A, Oster M, Woodall K, Kanter K, Kirshbom P. Risk factors associated with readmission after pediatric cardiothoracic surgery. Ann Thorac Surg. 2012;94:865–873. [DOI] [PubMed] [Google Scholar]
- 36. Mackie AS, Gauvreau K, Newburger JW, Mayer JE, Erickson LC. Risk factors for readmission after neonatal cardiac surgery. Ann Thorac Surg. 2004;78:1972–1978; discussion 1978. [DOI] [PubMed] [Google Scholar]
- 37. Fixler DE, Nembhard WN, Xu P, Ethen MK, Canfield MA. Effect of acculturation and distance from cardiac center on congenital heart disease mortality. Pediatrics. 2012;129:1118–1124. [DOI] [PubMed] [Google Scholar]
- 38. Brown KL, Ridout DA, Goldman AP, Hoskote A, Penny DJ. Risk factors for long intensive care unit stay after cardiopulmonary bypass in children. Crit Care Med. 2003;31:28–33. [DOI] [PubMed] [Google Scholar]
- 39. Hebson CL, Oster ME, Kirshbom PM, Clabby ML, Wulkan ML, Simsic JM. Association of feeding modality with interstage mortality after single‐ventricle palliation. J Thorac Cardiovasc Surg. 2012;144:173–177. [DOI] [PubMed] [Google Scholar]
- 40. Hehir DA, Rudd N, Slicker J, Mussatto KA, Simpson P, Li S‐H, Frommelt MA, Tweddell JS, Ghanayem NS. Normal interstage growth after the norwood operation associated with interstage home monitoring. Pediatr Cardiol. 2012;33:1315–1322. [DOI] [PMC free article] [PubMed] [Google Scholar]
- 41. Ashburn DA, McCrindle BW, Tchervenkov CI, Jacobs ML, Lofland GK, Bove EL, Spray TL, Williams WG, Blackstone EH. Outcomes after the Norwood operation in neonates with critical aortic stenosis or aortic valve atresia. J Thorac Cardiovasc Surg. 2003;125:1070–1082. [DOI] [PubMed] [Google Scholar]
- 42. Hehir DA, Dominguez TE, Ballweg JA, Ravishankar C, Marino BS, Bird GL, Nicolson SC, Spray TL, Gaynor JW, Tabbutt S.Risk factors for interstage death after stage 1 reconstruction of hypoplastic left heart syndrome and variants. J Thorac Cardiovasc Surg. 2008;136:94–99, 99.e1–3. [DOI] [PubMed] [Google Scholar]
- 43. Petit CJ, Fraser CD, Mattamal R, Slesnick TC, Cephus CE, Ocampo EC. The impact of a dedicated single‐ventricle home‐monitoring program on interstage somatic growth, interstage attrition, and 1‐year survival. J Thorac Cardiovasc Surg. 2011;142:1358–1366. [DOI] [PubMed] [Google Scholar]
- 44. Sheridan E, Wright J, Small N, Corry PC, Oddie S, Whibley C, Petherick ES, Malik T, Pawson N, McKinney PA, Parslow RC. Risk factors for congenital anomaly in a multiethnic birth cohort: an analysis of the Born in Bradford study. Lancet. 2013;382:1350–1359. [DOI] [PubMed] [Google Scholar]
- 45. Boneva RS, Botto LD, Moore CA, Yang Q, Correa A, Erickson JD. Mortality associated with congenital heart defects in the United States trends and racial disparities, 1979–1997. Circulation. 2001;103:2376–2381. [DOI] [PubMed] [Google Scholar]
- 46. DiBardino DJ, Pasquali SK, Hirsch JC, Benjamin DK, Kleeman KC, Salazar JD, Jacobs ML, Mayer JE, Jacobs JP. Effect of sex and race on outcome in patients undergoing congenital heart surgery: an analysis of the society of thoracic surgeons congenital heart surgery database. Ann Thorac Surg [Internet]. 2012;94 Available at: http://www.ncbi.nlm.nih.gov/pmc/articles/PMC3838919/. Accessed April 4, 2015. [DOI] [PMC free article] [PubMed] [Google Scholar]
- 47. Benavidez OJ, Gauvreau K, Jenkins KJ. Racial and ethnic disparities in mortality following congenital heart surgery. Pediatr Cardiol. 2006;27:321–328. [DOI] [PubMed] [Google Scholar]
- 48. Gilboa SM, Salemi JL, Nembhard WN, Fixler DE, Correa A. Mortality resulting from congenital heart disease among children and adults in the United States, 1999 to 2006. Circulation. 2010;122:2254–2263. [DOI] [PMC free article] [PubMed] [Google Scholar]
- 49. Gardener D, Connolly H. Who are the “Other” Ethnic Groups. London: Office of National Statistics; 2005. [Google Scholar]
- 50. Committee on Fetus and Newborn . Hospital discharge of the high‐risk neonate. Pediatrics. 2008;122:1119–1126. [DOI] [PubMed] [Google Scholar]
Associated Data
This section collects any data citations, data availability statements, or supplementary materials included in this article.
Supplementary Materials
Data S1. Supplemental methods.
Table S1. Summary of Candidate Patient Risk Factors
Table S2. Primary Cardiac Diagnosis Hierarchy and Collapsed Groupings
Table S3. Coding Scheme for Noncardiac Diagnoses and Comorbidities
Table S4. Postprocedural Morbidities
Data S2. Supplemental results.