

Abstract
Nanodiamonds (NDs) are an emerging class of engineered nanomaterials that hold great promise for the next generation of bionanotechnological products to be used for drug and gene delivery, or for bio-imaging and biosensing. Previous studies have shown that upon their cellular uptake, NDs exhibit high biocompatibility in various in vitro and in vivo set-ups. Herein we hypothesized that the increased NDs biocompatibility is a result of minimum membrane perturbations and their reduced ability to induce disruption or damage during cellular translocation. Using multi-scale combinatorial approaches that simulate ND-membrane interactions, we correlated NDs real-time cellular uptake and kinetics with the ND-induced membrane fluctuations to derive energy requirements for the uptake to occur. Our discrete and real-time analyses showed that the majority of NDs internalization occurs within 2 h of cellular exposure, however, with no effects on cellular viability, proliferation or cellular behavior. Furthermore, our simulation analyses using coarse-grained models identified key changes in the energy profile, membrane deformation and recovery time, all functions of the average ND or ND-based agglomerate size. Understanding the mechanisms responsible for ND-cell membrane interactions could possibly advance their implementation in various biomedical applications.
Keywords: nanodiamonds, course grained simulation, cell-based sensing
Introduction
Nanodiamonds (NDs) are an emerging class of engineered carbon-based nanomaterials known for their narrow size distribution and high surface area, light weight, high adsorption capability, chemical and thermal stability, as well as biocompatibility [1, 2]. Their ability to allow multi-surface functionalization by bio-conjugation with nucleic acids, proteins and therapeutic agents [3, 4] make NDs viable candidates for a variety of applications in the biomedical, pharmaceutical, and industrial fields [5]. In particular, the inexpensive and large-scale production of NDs through detonation of carbon-containing explosives could lead to the formation of the next generation of smart systems to be used as drug delivery platforms in cancer treatment, as carriers of genetic material and proteins, or as bio-imaging probes [6]. However, before such large-scale implementation could be achieved, ND uptake, internalization, interactions and ultimately induced cellular fate need to be fully assessed.
Previous studies have showed that NDs have minimum toxicity when exposed to different cellular systems; for instance, Liu et al showed that exposure of human lung epithelial cells A549 and HFL-1 normal fibroblasts to ND concentrations between 0.1 and 100 μg ml−1 did not affect cellular viability nor altered protein expression profiles [7]. Complementarily, studies of cellular morphological changes and DNA fragmentation in macrophages and HT-29 human colorectal adenocarcinoma cells respectively did not show cell transformation [8] nor significant reactive oxygen species generation [7, 9]. Additionally, Schrand et al showed that toxicity of NDs was significantly lower when compared to the toxicity of other carbon-based nanomaterials, with the order of toxicity decreasing from single-walled (SW) to multi-walled carbon nanotubes (MWCNTs), to carbon black and NDs [9] respectively. Furthermore, in vivo investigations using animal models complemented in vitro analyses, with histopathological and ultrastructural images of biological tissues showing that NDs did not induce pulmonary toxicity when administered to mice by intratracheal instillation [8]. Similarly, subcutaneous exposure, intraperitoneal injection or oral administration for different periods (from 10 d up to 3 months) in both mice and rats did not lead to inflammatory or adverse immune reactions [10] nor weight changes of mice and rats, nor of their offsprings internal organ (e.g., lungs, kidneys, and heart) [8, 11]. While the majority of studies reported high biocompatibility of NDs in vivo, some concentration and functionalities of the NDs were shown to induce thromboembolism in mice [12].
Although these results show that the toxicity of NDs has been extensively investigated, there is limited available information that revealed NDs dynamics upon cellular uptake or translocation. For instance, previous research indicated that NDs are uptaken through an energy-dependent clathrin-mediated endocytotic pathway [13, 14] at a higher cellular uptake rate than the rate of other carbon-based nanomaterials (i.e., SW-, MWCNTs or graphene for instance) [15]; however, such studies failed to demonstrate why the proposed pathway was the preferred mechanism. Given that the realtime uptake and internalization of NDs rely on the average particle size as well as on ND interaction with the proteins in cellular media [16, 17], understanding the mechanisms responsible for ND-cell membrane interactions as well as possible ND-induced membrane damage will provide fundamental knowledge to help explain their observed biocompatibility and thus ensure further implementation as smart drug delivery nanovehicles [16].
Herein, we hypothesize that the increased biocompatibility of NDs is due to minimum membrane damage induced by their uptake. Using combinatorial platforms that simulate ND interactions with the cellular membrane and cells as primary transducers, we unravel NDs' real-time uptake, translocation, as well as induced-cellular fate in model cellular systems [18] to provide novel scientific insights that help advance their implementation in biomedical applications.
Materials and methods
ND preparation
Detonation NDs powder was purchased from Plasmachem (GmbH, Germany) and grinded using a planetary ball mill (Fritsch Pulverisette 7 premium line, Germany) and zirconia oxide balls (100 μm of diameter, Germany) at 7000 U min−1, two times for 30 min each, with a 10 min break in between. The resulting grinded powder was suspended in Milli-Q water to obtain a 1 wt% solution; subsequently, the solution was sonicated in pulsed mode in an ultrasonic homogenizer (Bandelin Sonoplus HD 2200; control unit GM 2200, Germany) at a cycle rate of 50% and the pH was adjusted to 7.4.
Chemical and physical characterization of NDs
Fourier transform infrared spectroscopy was performed on a Smart OMNI-Transmission module (Thermo Scientific, Nicolet IZ10, Germany); at least 32 scans per sample in the range of 400–4000 cm−1 and at a resolution of 4 cm−1 were acquired and analyzed using the manufacturer software (Omnic, Germany). The size and morphology of the NDs were evaluated using scanning (SEM) and transmission electron (TEM) microscopy. SEM investigations were performed on a Carl Zeiss 1.500stes Gemini SEM (GmbH, Germany); for this, a droplet of a 0.1 wt% NDs suspension was dispersed in water and dried on a silicon wafer. TEM images were obtained on a Carl Zeiss LIBRA® 200 (GmbH, Germany) by placing small amounts of a 1 wt% NDs suspension on a clean copper-grid with a carbon-film with holes (400 mesh, Plano Germany). Analyses of NDs aggregation and zeta potential were performed using dynamic light scattering (DLS) (Delsa™ Nano Particle Analyzer Beckman Coulter, Germany). In each experiment, suspensions of NDs (100 μg ml−1) were prepared in Milli-Q water or Dulbecco's Modified Eagle Medium (DMEM, Invitrogen, USA) supplemented with 5% Fetal Bovine Serum (FBS, Invitrogen, USA). For each analysis, four replicates were performed for a total of 150 measurements, at 20 °C and considering a 1.33 refractive index for water and a 1.34 for DMEM respectively [19].
Cell culture
Immortalized human bronchial epithelial cells (BEAS-2B) were purchased from American Type Culture Collection (ATCC, USA) and cultured in DMEM media with 5% FBS, 0.1% L-glutamine and 1% penicillin/streptomycin (Invitrogen, USA). Cells were passaged regularly using 0.25% trypsin (Invitrogen, USA) and maintained in a humidified atmosphere at 37 °C and 5% CO2 respectively.
Uptake of NDs
BEAS-2B cells were seeded overnight in a 12-well plate (Fisher, USA) at a density of 2.5 × 10⁵ cell ml−1. The cells were subsequently treated with 400, 200, 100, 50, and 25 μg ml−1 ND suspensions in DMEM media with 5% FBS for 1 h, 2 h, 3 h or 24 h respectively. Following the NDs treatment, the cells were washed with phosphate buffer saline (PBS, Lonza, USA), trypsinized, resuspended in DMEM, centrifuged at room temperature and 1200 rpm for 5 min. The samples were further washed with PBS, fixed with 4% paraformaldehyde (Fisher Scientific, USA) for 15 min at room temperature, and then washed again with PBS several times to remove any of the fixative.
Fluorescence activated cell sorting (FACS) was performed on a BD LSR fortessa flow cell analyzer (BD Biosciences, USA); the forward scatter (FSC) and side scatter (SSC) were used to gate the live cells population and at least 10 000 events were recorded for each sample. Data was analyzed and plotted using FlowJo v7.2.5 software and NDs uptake was determined by averaging the FITC signal of the exposed cells at 488 nm excitation and 515 nm emission.
Electric cell impedance sensing (ECIS)
Real-time analysis of the BEAS-2B cellular behavior before and after exposure to NDs was performed using an (ECIS 96W, Applied Biophysics) platform. In each experiment, 96W10+ array (Applied Biophysics, USA) with 20 gold electrodes in inter-digited finger configuration was employed to provide concomitant measurements of 2000–4000 cells per well in real-time and at multiple frequencies. For this, the array holder was placed in a humidified incubator at 37 °C and 5% CO2 to ensure optimal conditions for cell growth. Prior to any experiment, the electrodes were stabilized for 3 h in 200 μl serum free DMEM; subsequently, BEAS-2B cells were added at a density of 2.5 × 10⁵ cell ml−1 in a volume of 200 μl/well. Cells were allowed to settle and grow over the electrodes until a confluent monolayer was formed [20]. Upon monolayer formation, the cells were treated with 400, 200, 100, 50, and 25 μg ml−1 NDs suspended in DMEM media with 5% FBS and their cellular behavior was subsequently monitored for 48 h.
Cell viability
To determine the effect of NDs on cellular viability, BEAS-2B cells were seeded overnight in a 96-well plate (Fisher,USA) at a density of 1 × 10⁵ cell ml−1 and treated with 400, 200, 100, 50, and 25 μg ml−1 ND suspensions for 24 h. Subsequently, 10 μl of tetrazolium salt 2- (4-iodophenyl)–3-(4-nitrophenyl)–5-(2,4-disulfophenyl) -2H-tetrazolium, known as WST-1 (Roche, USA), was added to each well and incubated for 2 h. Changes in cell viability were based on the cellular ability to cleave WST-1 salt to farmazan by enzyme dehydrogenase [21]. The amount of farmazan dye formed was assessed using a BioTek 96 plate reader (BioTek, USA) and measuring the absorbance of the sample at 450 nm. Relative cellular viability was calculated as the ratio of absorbance signal as derived from the NDs exposed cells to the absorbance signal of control (i.e., untreated cells).
Cell cycle analysis
To study the effects of different ND doses on cell cycle progression, BEAS-2B cells were seeded overnight in 12 well plate at a density of 2.5 × 10⁵ cells/well, and exposed to 400, 200, 100, 50 and 25 μg ml−1 NDs suspended in DMEM media with 5% FBS for 24 h. Subsequently, the cells were trypsinized, collected, washed twice with PBS, centrifuged at 1500 rpm for 6 min and fixed overnight at −20 °C in 2 ml 70% ethanol (Sigma, USA). Upon time elapsed, the cells were again washed in PBS, resuspended in 0.2% tween 20 (Sigma, USA) for 15 min, treated with 10 μl 0.05% RNase (Sigma, USA) for 15 min and, lastly, stained with 30 μl propidium iodide (Sigma, USA). The DNA content was determined using BD LSR Fortessa Flow cell analyzer. FSC and SSC were used for gating to include the majority of live cell population; 20 000 events were collected for each sample using the BD FACS Diva software (Verity Software House, USA) and analyzed using FlowJo software V10.0.7 (Tree Star Inc., USA) to measure their DNA content.
Simulation setup
To evaluate the uptake of NDs, we used coarse-grained (CG) representation and the GROMACS software package (v4.5.5) [22]. The CG representation was developed using the MARTINI four-to-one mapping scheme [23]. Atomistic models of NDs (3, 5, and 7 nm in diameter) were generated using the diamond lattice (with Fd3m space group and face-centered cubic lattice) in CrystalMaker software. Coarse grained ND beads were given standard C1 bead type and a zero net surface charge. Subsequently, the constructed ND was energy minimized and equilibrated with explicit MARTINI water (isobaric-isothermal ensemble at 300 K and 1 atm pressure).
The CG lipid bilayer used for the analysis was made up of neutral distearoylphosphatidyl choline (DSPC) molecules and negatively charged distearoylphosphatidyl glycerol (DSPG) lipid molecules. The DSPC:DSPG ratio was maintained at 3:1 to resemble a net negative charge of mammalian cell membranes [24]. The electroneutrality of the total system was achieved by adding the required number of sodium counterions as determined by the number of DSPG lipid molecules being available. The bilayer was allowed to self-assemble without any constraints in a user-designed simulation box with a size of 16.0 × 16.0 × 30 nm3. In all simulations the center-of-mass (COM) of the ND was placed 7.0 nm along the +z-axis above the lipid bilayer as the starting structure for the simulation; the entire simulation box was solvated with CG water beads of which 10% were anti-freeze type.
All initial systems were energy minimized using the steepest descent algorithm followed by isochoric–isothermal (NVT) and isobaric–isothermal (NPT) equilibration simulations for 100 ns each at 300 K. The production run simulations were performed using the Berendsen barostat [25] and temperature coupling at 300 K. The equilibrated systems were subsequently subjected to umbrella sampling pull simulations for 3.6 ns and over a distance of approximately 13 nm by applying a constant force of 1000 kJ mol−1 nm−2 to the COM of the ND to pull it through the lipid bilayer. In each case, the geometries of the system were saved at regular time intervals to generate over 174 configuration windows with each window being analyzed to determine the distance between the COM of the ND and the mid-plane of the lipid bilayer. Out of the initial set of configurations, uniformly separated windows with 0.2 nm spacing were selected. For each of the selected windows, NPT equilibration was performed for 5 ns followed by 100 ns of production run with no geometric constraints. At the end of the production run the potential of mean force (PMF) values were obtained for the translocation process by using the weighted histogram analysis method [26]. The activation barrier for each translocation simulation was calculated by taking a difference between the maximum and the minimum energy points of the PMF curve. The rate constants were calculated by using the first order transition state theory; subsequently, the rate constant was used to calculate the half-lives and characteristic lifetime of the translocation process [17].
To mimic the experimental serum protein in medium, bovine serum albumin (BSA), (PDB:4F5S) protein [27] was used. High resolution BSA crystal structure was obtained from the protein data bank and CG using the available MARTINI scripts. The secondary structure of the protein and the bead assignment were based on standard MARTINI coarse grained methods [23]. The interactions between coarse grained BSA and NDs of sizes 3, 5, and 7 nm were investigated in three separate simulations. In each case, the NDs were introduced in a well-equilibrated system of BSA molecules with explicit water and positively charged counter ions (Na+) at 300 K. The counter ions were added to maintain the electroneutrality of the simulation system because BSA is a negatively charged protein under the physiological conditions.
Statistical analysis
All results are presented as mean ± standard deviation. Uptake, cellular viability and cell cycle experiments were performed in duplicates and repeated at least three times, for a total minimum of six replicates per each concentration and each time point being investigated. ECIS experiments were performed in duplicates and repeated at least four times per each dose being tested. Two-way analysis of variance and unpaired two-tailed student's T-test were performed using SigmaPlot 10.0 (Systat Software Inc.); differences were considered significant for p* < 0.05. Each CG simulation was repeated two times to sample over the starting configurations and the initial conditions of the system. The random number generator was initialized with different seeds in each simulation. The statistical errors in the PMF curves were estimated using the bootstrap analysis available in GROMACS. The size analysis of equilibrated ND particle after BSA corona formation was performed by averaging over a multiple interparticle distances of farthest, diametrically opposite CG beads of BSA proteins. The average values of the diameter and standard deviation are reported.
Results
Physico-chemical characterization of NDs
Comprehensive analyses of NDs physico-chemical properties were performed using infrared spectroscopy and TEM. Spectroscopy results identified O-related groups (i.e., OH, COOH, and O–CH groups respectively) on the NDs surface (figure 1(a)) as resulted from their manufacturing process and oxidation of sp2 carbon during detonation soot purification [28]. Specifically, the peak at 3350 cm−1 was attributed to the O–H stretching vibration, while the peak at around 1750 cm−1 was associated with the CO stretching vibration [18]. In addition, the small peak observed at around 1600 cm−1 was a result of the O–H bending vibration, with the peaks between 1000 and 1250 cm−1 being associated with the C–O stretching vibrations [29]. Electron microscopy investigations showed that NDs had planar structures that ranged from 3 to 7 nm in size, with an average of 5 nm (figure 1(b)). Furthermore, the NDs formed primary agglomerates (conglomerates of individual NDs; figure 1(b) insert) which ranged from 30 to 100 nm and were comparable to previous studies [30, 31].
Figure 1.

Physico-chemical characterization of detonation nanodiamonds (NDs), (a) Fourier transform infrared spectra indicating the presence of O-rich groups. (b) Transmission and scanning electron microscope images (TEM and SEM in insert respectively) showing the planner structure and the primary agglomerates formed from NDs. (c) Dynamic light scattering (DLS) intensity distribution showing the average agglomerate diameter of NDs in water and cellular media.
Dispersity analyses performed using DLS (figure 1(c)) showed that NDs dispersed in water had an average size of about 63.6 ± 10.3 nm while the ones dispersed in cellular media reached 89.6 ± 12.8 nm. Their agglomeration is a result of the O-balance present at their synthesis as demonstrated by the negative zeta potential (−28.2 ± 2.4 mV). The larger size of NDs in media was presumably due to additional serum proteins adsorbed onto their surfaces and the formation of protein corona as demonstrated by the change in zeta potential (−93.35 ± 5.5 mV).
To explain the agglomeration and the changes in dispersity, we performed computational analyses (figure 1(d)). We considered neutral NDs and subsequently evaluated their agglomeration in the presence of serum proteins, with BSA being the dominant one. The consideration for neutral NDs as compared to anionic ones come from previous studies that showed that larger protein concentrations in the media would lead to overall minor variations in zeta potentials to influence particle cellular uptake [32, 33]. Complementarily, the consideration for BSA was based on previous studies showing that concentrations of up to 27 mg ml−1 BSA are present in certified FBS, resulting in an approximate 1.35 mg ml−1 in DMEM media containing 5% FBS (v/v) [34]. Our approach also took into account that most cellular membranes are negatively charged thus further influencing the local environment of NDs and their uptake.
The BSA protein being aspherical and with cross-sectional lengths of 9.1 nm, 6.4 nm and 5.1 nm respectively, is comparable with or larger than individual NDs used in this work. Analysis showed that when the BSA was interacted with the neutral NDs, an individual BSA-ND complex was formed, all within 200 ns of the simulation, with the complex formation being mainly driven by van der Waals and hydrophobic interactions between the neutral ND and negatively charged BSA molecules respectively. Results also showed that only a fraction of the BSA surface could contribute to the formation of the complex. As such, a stable nonuniform monolayer of BSA molecules would be observed for all ND sizes being tested with the monolayer leading to an increase in the hydrodynamic radius of the NDs or resulting complexes (figure 1(d)). For instance, the snapshot of 3 nm ND showed a non-uniform protein corona being formed onto its surface, with about three BSA molecules being adsorbed as blobs with pockets to lead to a complex of a 8.6 ± 2.1 nm diameter. Non-uniform protein coronas were also observed for both 5 and 7 nm ND sizes resulting in 13.1 ± 3.2 and 15.7 ± 4.9 nm diameters, respectively. In control, analyses with negatively charged particles (supporting information; S1) also led to a non-uniform protein corona formation as resulted from a maximum adsorption of about four BSA molecules onto larger particles. Taking into account that the stoichiometry of the BSA-ND complex is sensitive to several physico-chemical properties such as NDs size, ND surface charge, protein–protein interactions, charge on the protein, as well as the pH of the medium, the variation in protein corona stoichiometry is minimal relative to the protein corona formed for the neutral particle and represents the result of the continuous physical exchange at ND interfaces [35].
ND uptake and induced cellular biocompatibility
We confirmed the uptake of NDs using their intrinsic photoluminescence and standard in vitro FACS analysis. Briefly, human lung epithelial cells (BEAS-2B) were exposed to NDs dispersed in cellular media containing BSA for 1 h, 2h, 3 h and 24 h respectively; BEAS-2B previously served as a suitable model system for in vitro testing of uptake of carbon nanotubes [18], titanium dioxide [36], and silver nanoparticles [37] just to name a few. Figure 2(a) shows that NDs cellular uptake was function of both the concentration and the exposure time, with analyses revealing that cells exposed to concentrations of 400, 200 and 100 μg ml−1 NDs had significantly higher fluorescence intensity relative to their control counterparts (i.e., unexposed cells). Fluorescent signals of cells exposed to 50 and 25 μg ml−1 NDs were however not significantly different from their control counterparts. Control experiments did not identify large conglomerates or particles thus confirming that the NDs uptake was in its majority.
Figure 2.
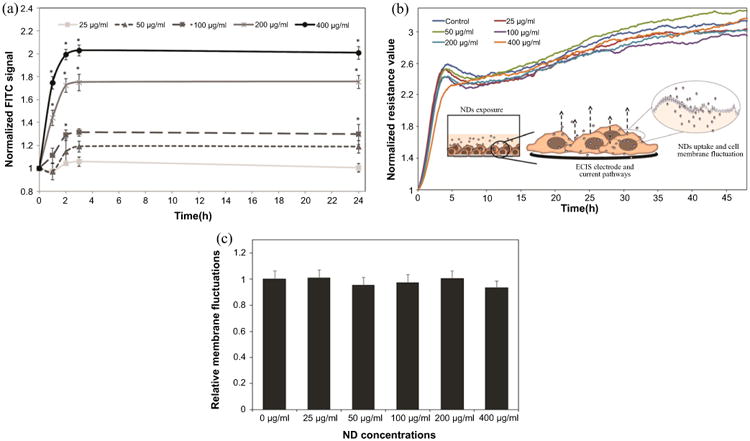
ND uptake and induced cellular biocompatibility following NDs exposure. (a) Normalized FITC signal of cells exposed to (25, 50, 100, 200, 400 μg ml−1) NDs for 1 h, 2 h, 3 h and 24 h respectively. (b) Representative normalized resistance measurements of BEAS-2B cells upon their exposure to different concentrations of NDs, (c) quantifications of membrane fluctuations of cells exposed to NDs relative to unexposed cells. Differences were considered statistically significant for p* < 0.05.
The uptake did not influence the cell structure or morphology; this was confirmed experimentatlly using realtime non-invasive ECIS experiments. Specifically, we used the insulating nature of the plasma membrane and ECIS to provide sensitive analysis of membrane fluctuations or cytoskeleton reorganization [38–41]. The ECIS was previously employed to study cellular viability, proliferation [42], motion [40], morphology [39] and attachment [20] post exposure to different toxins [42], therapeutic agents or viral vectors [42], and nanomaterials of carbon [43]. Figure 2(b) shows representative ECIS measurements of the normalized resistance values for control and NDs exposed cells performed for 48 h at 4 kHz frequency; the selected operational frequency was previously shown to allow for optimal measurement of the cellular membrane integrity, cellular adhesion and cell-cell interactions over gold electrodes [38, 41].
Our results revealed that the resistance curves of the NDs-exposed cells were similar to those of the control cells and showed no changes in the morphology or integrity of the cellular monolayer. Furthermore, analyses showed that there were no quantifiable differences in the fluctuations of the resistance curves, which confirmed that the uptake of NDs did not lead with observable membrane changes or cellular-induced micromotion onto electrodes [40, 44] (figure 2(c)).
Upon confirming NDs uptake, we validated their induced biocompatibility through analysis of cellular activity and cell cycle progression respectively. Cellular activity is regulated by different organelles such as the mitochondria, plasma membrane, as well as by cell–cell interactions and is a reflection of the overall cell fate [45]. Cell cycle controls proliferation, differentiation, and apoptosis processes [46], with changes in the cell cycle phases being associated with cyto- and/or genotoxic effects observed upon exposure to different analytes, as well as cellular transformation to a malignant phenotype [47].
Cellular activity analyses at discrete time points using colorimetric detection based on WST-1 assay [21] showed that 24 h exposure to different concentrations of NDs did not induce significant effects on cell viability (figure 3(a)), thus confirming previous studies [13, 48]. Complementary, cell cycle analyses performed by measuring the percentage of the DNA content showed that NDs exposure did not alter cell cycle progression nor interfered with cellular proliferation (figure 3(b)).
Figure 3.

(a) Viability analysis following exposure to NDs for 24 h relative to control (unexposed) cells. (b) Cell cycle analysis following 24 h exposure to NDs. All differences were considered statistically significant for p* < 0.05.
Discussion
We used experimentally validated multiscale modeling and a cell-based sensing platform to evaluate real-time uptake of detonation NDs. The consideration for NDs came from their potential applicability for the delivery of genes and drugs as resulted from their ease of biomolecular functionalization and slow release capabilities [5, 30]. Our multi-scale strategy involved first characterizing the physico-chemical properties of user-produced NDs, secondly validating their uptake in model cellular systems, and thirdly providing our hypothesis to explain their increased biocompatibility in such systems.
Our analyses showed that even though a narrow size distribution for the synthesized NDs was recorded, upon their dispersion in cellular media their agglomeration state has changed. The change in the agglomeration state was presumably due to the attachment of the proteins present in the media. Specifically, previous studies showed that the composition and size of such proteins could lead to protein corona formation, with the size of the corona being dependent on the concentration, the affinity, as well as the interaction of these proteins with the interfaces they are exposed to [49, 50].
The detailed analysis of the interactions between the ND and a representative protein present in the media, namely BSA, showed non-specific binding of its amino acid residues onto the ND surface. Furthermore, the asymmetry of the protein sterically seemed to hinder the addition of other protein molecules in exposed NDs pockets. As such, the remaining BSA surface area would presumably be available to facilitate the agglomeration of the NDs as evident from the experimental DLS data. In particular, using the value ratios of individual NDs and their average size with and without the protein corona, the packing density would be function of the dispersion media, i.e. water or media respectively, with the number of NDs being packed in the media presumably being due to the formation of thin electric dipole layers of the protein corona that will affect the hydrodynamic diameter of the NDs [51].
Our analysis showed that the majority of the NDs uptake occurred within the first 2 h of exposure, with cells subsequently reaching a ‘saturation’ plateau. In particular, mathematical modeling of the fluorescent signal of cells exposed to NDs at concentrations above 200 μg ml−1 showed that uptake followed a three-parameters exponential curve according to the following equation:
where I (t) represents the mean fluorescence intensity at the particular time, A is the saturation value of mean fluorescence intensity, k is the rate constant, and tc is the lag in particle diffusion and targeting. The model also showed that about 95% of the NDs where internalized within the 1.71 h of incubation (R2 = 0.95) with such analysis being consistent with previously published results investigating NDs uptake in a serum-rich medium [52].
While a clear discrepancy was recorded in the literature on the uptake and induced cellular fate upon other carbon-based nanomaterials such as SW-, and MWCNTs, with the conflicting data being attributed to the differences in the preparation procedures, intrinsic purities and activities of such nanomaterials, our study confirms the high cellular biocompatibility observed upon NDs uptake [53]. Specifically, previous studies showed that NDs functionalized with O-containing groups (either -OH or -CO2H groups) might lead to complex membrane–particle interactions [54] and their non-specific binding or clustering on the cationic sites of the plasma membrane, with subsequent endocytosis through a temperature-, energy-, and clathrin-dependent pathway [54–57]. The uptake of NDs is in contrast with both the uptake of SW- and MWCNTs respectively shown to lead to membrane damage, association with cytoskeleton structures and increased disruption of cellular integrity and organelles upon their translocation [18, 58].
Since our results showed that the NDs uptake did not change cell activity nor affect its cycle, we hypothesized that the observed biocompatibility is a result of minimal membrane damage induced upon their uptake. Our hypothesis takes into account the role of the cellular membrane to serve as a ‘gate’ that regulates cell activity and structure through direct association with cellular organelles and cytoskeletal components. In particular, if the NDs would have had disrupted the membrane, such disruption would have had resulted in ‘membrane pinches’ possibly accompanied by cytoskeletal reorganization to affect the overall integrity of the cell and lead to apoptosis or necrosis [24, 34, 45]. Indeed, previous membrane passive penetration mechanisms were shown to affect the cell fate by leading to the formation of holes and a significant membrane disruption. [59, 60]. In contrast, energy-dependent cellular uptake was not shown lead to such effects.
To validate our hypothesis we performed additional CG computational analyses. Our results showed that the size of the NDs or induced conglomerates played a critical role in the internalization process, with the maxima and minima in their energy profiles providing direct evidence of the lack of membrane disruption. Specifically, the PMF profiles for the three representative sizes of NDs showed that key features such as the distance between the COM of ND and membrane mid-plane were reduced. Further, we found that as the 3 nm NDs get closer to the cellular membrane, the uptake energy increases as less favorable interactions between the uncharged NDs and the negatively charged polar head groups of the lipid membrane would take place (figure 4(a)). However, past the lipid heads and as the NDs get embedded in the membrane, the hydrophobic lipid tails interact favorably to stabilize the individual particles leading to energies as high as 60 kJ mol−1. In contrast, the simulations showed that the 5 nm NDs had no minima when embedded in the lipid chains since the hydrophobic thickness of the membrane was smaller than the diameter of the ND (figure 4(b)). A further increase in diameter to 7 nm respectively would have led to pronounced deformations of the membrane structure causing an increase of about 14-fold in the energy barrier relative to the 5 nm ND (figure 4(c)). However, the lack of membrane fluctuations recorded by ECIS confirmed that there were no changes on the membrane integrity thus validating our above proposed hypothesis.
Figure 4.
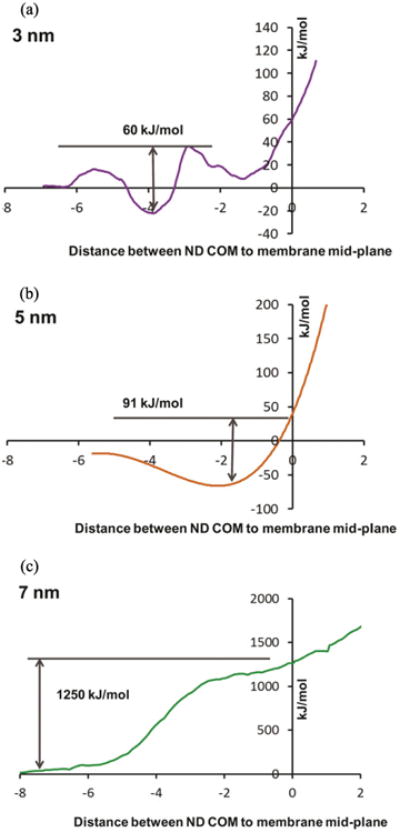
Coarse-grained (CG) computational analysis of the potential of mean force (PMF) profiles for the 3 nm (b), 5 nm (c) and 7 nm (d) NDs as function of the distance between the center-of-mass (COM) of NDs and membrane mid-plane.
Snapshots further showed that if the uptake process would have occurred via only translocation a clear deformation in the cell membrane would have been observed (figure 5). The membrane recovery time would have had correlated directly with the damage caused by the ND translocation, with the membrane lipid self-assembling into a stable bilayer within 50 ns of the simulations for both the 3 and 5 nm NDs while the rate constant of the translocation was appreciable resulting in a half-life of 1.4 h for the 5 nm diameter particle (table 1).
Figure 5.

Snapshots revealing the translocation of NDs with different diameter (i.e., 3, 5 and 7 nm respectively) through the membrane lipid bilayer. The images showed the membrane disruption in response to the NDs.
Table 1.
Calculated barrier heights, rate constants and half-lives for cellular uptake of NDs without BSA protein corona.
| ND diameter (nm) | Barrier height (kJ mol−1) | k (h−1), | t1/2 (h) |
|---|---|---|---|
| 3 | 60 ± 1 | 6.5 × 10⁵ | 1.5 × 10⁻⁶ |
| 5 | 91 ± 3 | 4.9 × 10⁻¹ | 1.4 |
| 7 | 1250 ± 12 | NAa | NAa |
NA—Not applicable. There appears to be a change in the cellular uptake mechanism for NDs with size greater than 5 nm.
Our study demonstrates that the lack of membrane disruption can be recorded through multi-scale combinatorial, non-destructive and high throughput velocity analyses, all performed in real-time and in contrast with previously destructive cellular endpoint assays. By unraveling the cellular biocompatibility on the basis of limited membrane and cellular disruption the current study has the potential to advance the implementation of NDs for the next generation of nanovehicles used for drug or gene delivery.
Conclusions
Our results correlate the free-energy barrier, half time and rate constant of NDs uptake with the average size of the NDs in order to explain their increased cellular biocompatibility. Furthermore, our discrete and real-time analyses of the cellular viability, proliferation and overall cellular behavior upon NDs uptake help explain the lack of membrane disruption and allow for high-throughput evaluation of the cell fate through meaningful combinatorial approach with potential to expand testing of other nanomaterial's biocompatibility.
Supplementary Material
Acknowledgments
Support for this research was provided through the National Science Foundation (NSF 1434503, 1300757 and EPS-1003907). Flow cytometry experiments were performed in the Flow Cytometry Core Facility at WVU; the Core Facility is in part supported by the National Institute of Health equipment grant number S10OD016165 and the Institutional Development Award (IDeA) from the National Institute of General Medical Sciences of the National Institutes of Health under grant numbers P30GM103488 (CoBRE) and P20GM103434 (INBRE). SEM measurements were performed by Yvonne Standke at IKTS; DLS measurements were performed at the Physical Chemistry Department of the TU Dresden. The computational work used the Extreme Science and Engineering Discovery Environment (XSEDE), which is supported by National Science Foundation grant number ACI-1053575. The financial support for the computational studies was provided by Syracuse University.
Footnotes
Online supplementary data available from stacks.iop.org/NANO/27/085107/mmedia
Contributor Information
Shikha Nangia, Email: snangia@syr.edu.
Cerasela Zoica Dinu, Email: cerasela-zoica.dinu@mail.wvu.edu.
References
- 1.Shenderova OA. Production of nanodiamond particles. In: Sarin VK, editor. Comprehensive Hard Materials. Oxford: Elsevier; 2014. pp. 143–71. [Google Scholar]
- 2.Schrand AM, Hens SAC, Shenderova OA. Nanodiamond particles: properties and perspectives for bioapplications. Crit Rev Solid State Mater Sci. 2009;34:18–74. [Google Scholar]
- 3.Mansoorianfar M, et al. Nanodiamonds for surface engineering of orthopedic implants: enhanced biocompatibility in human osteosarcoma cell culture. Diam Relat Mater. 2013;40:107–14. [Google Scholar]
- 4.Perevedentseva E, et al. Characterizing protein activities on the lysozyme and nanodiamond complex prepared for bio applications. Langmuir. 2010;27:1085–91. doi: 10.1021/la103155c. [DOI] [PubMed] [Google Scholar]
- 5.Grichko VP, Shenderova OA. Nanodiamond: designing the bio-platform. In: Gruen OASM, editor. Ultrananocrystalline Diamond. Norwich, NY: William Andrew; 2006. pp. 529–57. [Google Scholar]
- 6.Perevedentseva E, et al. Biomedical applications of nanodiamonds in imaging and therapy. Nanomedicine. 2013;8:2041–60. doi: 10.2217/nnm.13.183. [DOI] [PubMed] [Google Scholar]
- 7.Kuang-Kai L, et al. Biocompatible and detectable carboxylated nanodiamond on human cell. Nanotechnology. 2007;18:325102. [Google Scholar]
- 8.Zhu Y, et al. The biocompatibility of nanodiamonds and their application in drug delivery systems. Theranostics. 2012;2:302–12. doi: 10.7150/thno.3627. [DOI] [PMC free article] [PubMed] [Google Scholar]
- 9.Schrand AM, et al. Differential biocompatibility of carbon nanotubes and nanodiamonds. Diam Relat Mater. 2007;16:2118–23. [Google Scholar]
- 10.Yuan Y, et al. Pulmonary toxicity and translocation of nanodiamonds in mice. Diam Relat Mater. 2010;19:291. [Google Scholar]
- 11.Puzyr AP, et al. Nanodiamonds with novel properties: a biological study. Diam Relat Mater. 2007;16:2124–8. [Google Scholar]
- 12.Kumari S, et al. Nanodiamonds activate blood platelets and induce thromboembolism. Nanomedicine. 2014;9:427–40. doi: 10.2217/nnm.13.23. [DOI] [PubMed] [Google Scholar]
- 13.Vairakkannu V, et al. The biocompatibility of fluorescent nanodiamonds and their mechanism of cellular uptake. Nanotechnology. 2009;20:425103. doi: 10.1088/0957-4484/20/42/425103. [DOI] [PubMed] [Google Scholar]
- 14.Perevedentseva E, et al. Nanodiamond internalization in cells and the cell uptake mechanism. J Nanopart Res. 2013;15:1–12. [Google Scholar]
- 15.Zhang X, et al. A comparative study of cellular uptake and cytotoxicity of multi-walled carbon nanotubes, graphene oxide, and nanodiamond. Toxicol Res. 2012;1:62–8. [Google Scholar]
- 16.Vasir JK, Labhasetwar V. Quantification of the force of nanoparticle-cell membrane interactions and its influence on intracellular trafficking of nanoparticles. Biomaterials. 2008;29:4244–52. doi: 10.1016/j.biomaterials.2008.07.020. [DOI] [PMC free article] [PubMed] [Google Scholar]
- 17.Nangia S, Sureshkumar R. Effects of nanoparticle charge and shape anisotropy on translocation through cell membranes. Langmuir. 2012;28:17666–71. doi: 10.1021/la303449d. [DOI] [PubMed] [Google Scholar]
- 18.Dong C, et al. Towards elucidating the effects of purified MWCNTs on human lung epithelial cells. Environ Sci: Nano. 2014;1:95–603. doi: 10.1039/C4EN00102H. [DOI] [PMC free article] [PubMed] [Google Scholar]
- 19.Dieguez L, et al. Effect of the refractive index of buffer solutions in evanescent optical biosensors. Sensor Lett. 2009;7:851–5. 1546-198X. [Google Scholar]
- 20.Eldawud R, et al. Real-time analysis of the effects of toxic, therapeutic and sub-therapeutic concentrations of digitoxin on lung cancer cells. Biosens Bioelectron. 2014;59:192–9. doi: 10.1016/j.bios.2014.03.030. [DOI] [PMC free article] [PubMed] [Google Scholar]
- 21.Ngamwongsatit P, et al. WST-1-based cell cytotoxicity assay as a substitute for MTT-based assay for rapid detection of toxigenic bacillus species using CHO cell line. J Microbiological Methods. 2008;73:211–5. doi: 10.1016/j.mimet.2008.03.002. [DOI] [PubMed] [Google Scholar]
- 22.Pronk S, et al. GROMACS 4.5: a high-throughput and highly parallel open source molecular simulation toolkit. Bioinformatics. 2013;29:845–54. doi: 10.1093/bioinformatics/btt055. [DOI] [PMC free article] [PubMed] [Google Scholar]
- 23.Marrink SJ, et al. The MARTINI force field: coarse grained model for biomolecular simulations. J Phys Chem B. 2007;111:7812–24. doi: 10.1021/jp071097f. [DOI] [PubMed] [Google Scholar]
- 24.van Meer G, Voelker DR, Feigenson GW. Membrane lipids: where they are and how they behave. Nat Rev Mol Cell Biol. 2008;9:112–24. doi: 10.1038/nrm2330. [DOI] [PMC free article] [PubMed] [Google Scholar]
- 25.Berendsen HJC, et al. Molecular dynamics with coupling to an external bath. J Chem Phys. 1984;81:3684–90. [Google Scholar]
- 26.Kumar S, et al. THE weighted histogram analysis method for free-energy calculations on biomolecules: I. The method. J Comput Chem. 1992;13:1011–21. [Google Scholar]
- 27.Bujacz A. Structures of bovine, equine and leporine serum albumin. Acta Crystallogr D. 2012;68:1278–89. doi: 10.1107/S0907444912027047. [DOI] [PubMed] [Google Scholar]
- 28.Kulakova II. Surface chemistry of nanodiamonds. Phys Solid State. 2004;46:636–43. [Google Scholar]
- 29.Kubicki JD, et al. Attenuated total reflectance Fourier-transform infrared spectroscopy of carboxylic acids adsorbed onto mineral surfaces. Geochim Cosmochim Acta. 1999;63:2709–25. [Google Scholar]
- 30.Krüger A. Carbon Materials and Nanotechnology. Weinheim: Wiley; 2010. [Google Scholar]
- 31.Greiner NR, Phillips DS, Johnson JD, Volk F. Diamonds in detonation soot. Nature. 1988;333:440. [Google Scholar]
- 32.Patil S, et al. Protein adsorption and cellular uptake of cerium oxide nanoparticles as a function of zeta potential. Biomaterials. 2007;28:4600–7. doi: 10.1016/j.biomaterials.2007.07.029. [DOI] [PMC free article] [PubMed] [Google Scholar]
- 33.He C, et al. Effects of particle size and surface charge on cellular uptake and biodistribution of polymeric nanoparticles. Biomaterials. 2010;31:3657–66. doi: 10.1016/j.biomaterials.2010.01.065. [DOI] [PubMed] [Google Scholar]
- 34.Boitano A, et al. The proapoptotic benzodiazepine Bz-423 affects the growth and survival of malignant B cells. Cancer Res. 2003;63:6870–6. [PubMed] [Google Scholar]
- 35.Lin CL, et al. Protein attachment on nanodiamonds. J Phys Chem A. 2015;119:7704–11. doi: 10.1021/acs.jpca.5b01031. [DOI] [PubMed] [Google Scholar]
- 36.Park EJ, et al. Oxidative stress and apoptosis induced by titanium dioxide nanoparticles in cultured BEAS-2B cells. Toxicol Lett. 2008;180:222–9. doi: 10.1016/j.toxlet.2008.06.869. [DOI] [PubMed] [Google Scholar]
- 37.Kim HR, et al. Genotoxic effects of silver nanoparticles stimulated by oxidative stress in human normal bronchial epithelial (BEAS-2B) cells. Mutation Res/Genetic Toxicol Environ Mutagenesis. 2011;726:129–35. doi: 10.1016/j.mrgentox.2011.08.008. [DOI] [PubMed] [Google Scholar]
- 38.Wegener J, Keese CR, Giaever I. Electric cell-substrate impedance sensing (ECIS) as a non-invasive means to monitor the kinetics of cell spreading to artificial surfaces. Exp Cell Res. 2000;259:158–66. doi: 10.1006/excr.2000.4919. [DOI] [PubMed] [Google Scholar]
- 39.Siddiquei HR, et al. Electrical cell-substrate impedance sensing (ECIS) based biosensor for characterization of DF-1 cells. Proc Int Conf Comput Commun Eng (ICCCE) 2010:1–4. [Google Scholar]
- 40.Kataoka N, et al. Endothelial cell micro-motion monitored by ECIS during monocytes application. Proc First Joint Engineering in Medicine and Biology, 1999 21st Annual Conf and the 1999 Annual Fall Meetring of the Biomedical Engineering Society BMES/EMBS Conf, 1999 1999 [Google Scholar]
- 41.Chen SW, et al. A computational modeling and analysis in cell biological dynamics using electric cell-substrate impedance sensing (ECIS) Biosens Bioelectron. 2012;33:196–203. doi: 10.1016/j.bios.2011.12.052. [DOI] [PubMed] [Google Scholar]
- 42.Müller J, Thirion C, Pfaffl MW. Electric cell-substrate impedance sensing (ECIS) based real-time measurement of titer dependent cytotoxicity induced by adenoviral vectors in an IPI-2I cell culture model. Biosens Bioelectron. 2011;26:2000–5. doi: 10.1016/j.bios.2010.08.075. [DOI] [PubMed] [Google Scholar]
- 43.Eldawud R, et al. Electronic platform for real-time multiparametric analysis of cellular behavior post exposure to single-walled carbon nanotubes. Biosens Bioelectron. 2015;71:269–77. doi: 10.1016/j.bios.2015.04.044. [DOI] [PMC free article] [PubMed] [Google Scholar]
- 44.Goda N, et al. Quantitative evaluation of nano-order micromotion of cultured cells using electric cell-substrate impedance sensing method. In: Tomography H, et al., editors. 13th Int Conf on Electrical Bioimpedance and the 8th Conf on Electrical Impedance. Berlin: Springer; 2007. pp. 122–5. [Google Scholar]
- 45.Shi Y, Massagué J. Mechanisms of TGF-β signaling from cell membrane to the nucleus. Cell. 2003;113:685–700. doi: 10.1016/s0092-8674(03)00432-x. [DOI] [PubMed] [Google Scholar]
- 46.Assoian RK. Anchorage-dependent cell cycle progression. J Cell Biol. 1997;136:1–4. doi: 10.1083/jcb.136.1.1. [DOI] [PMC free article] [PubMed] [Google Scholar]
- 47.Rangaswami H, Bulbule A, Kundu G. Osteopontin: role in cell signaling and cancer progression. Trends Cell Biol. 2006;16:79–87. doi: 10.1016/j.tcb.2005.12.005. [DOI] [PubMed] [Google Scholar]
- 48.Mengesha AE, Youan BBC. Nanodiamonds for drug delivery systems. In: Narayan R, editor. Diamond-Based Materials for Biomedical Applications. Cambridge: Woodhead Publishing; 2013. pp. 186–205. [Google Scholar]
- 49.Perevedentseva E, et al. Effect of surface adsorbed proteins on the photoluminescence of nanodiamond. J Appl Phys. 2011;109:034704. [Google Scholar]
- 50.Campbell AS, et al. Enzyme catalytic efficiency: a function of bio-nano interface reactions. ACS Appl Mater Interfaces. 2014;6:5393–403. doi: 10.1021/am500773g. [DOI] [PubMed] [Google Scholar]
- 51.Jiang J, Oberdörster G, Biswas P. Characterization of size, surface charge, and agglomeration state of nanoparticle dispersions for toxicological studies. J Nanopart Res. 2009;11:77–89. [Google Scholar]
- 52.Weng MF, et al. Cellular uptake and phototoxicity of surface-modified fluorescent nanodiamonds. Diam Relat Mater. 2012;22:96–104. [Google Scholar]
- 53.Schrand AM, et al. Temporal and mechanistic tracking of cellular uptake dynamics with novel surface fluorophore-bound nanodiamonds. Nanoscale. 2011;3:435–45. doi: 10.1039/c0nr00408a. [DOI] [PubMed] [Google Scholar]
- 54.Zhang B, et al. Receptor-mediated cellular uptake of folate-conjugated fluorescent nanodiamonds: a combined ensemble and single-particle study. Small. 2009;5:2716–21. doi: 10.1002/smll.200900725. [DOI] [PubMed] [Google Scholar]
- 55.Liu KK, et al. Endocytic carboxylated nanodiamond for the labeling and tracking of cell division and differentiation in cancer and stem cells. Biomaterials. 2009;30:4249–59. doi: 10.1016/j.biomaterials.2009.04.056. [DOI] [PubMed] [Google Scholar]
- 56.Chow EK, et al. Nanodiamond therapeutic delivery agents mediate enhanced chemoresistant tumor treatment. Sci Transl Med. 2011;3:73ra21. doi: 10.1126/scitranslmed.3001713. [DOI] [PubMed] [Google Scholar]
- 57.Merkel TJ, DeSimone JM. Dodging drug-resistant cancer with diamonds. Sci Transl Med. 2011;3:73ps8–s8. doi: 10.1126/scitranslmed.3002137. [DOI] [PubMed] [Google Scholar]
- 58.Snyder RJ, et al. Multiwalled carbon nanotubes induce altered morphology and loss of barrier function in human bronchial epithelium at non-cytotoxic doses. Int J Nanomed. 2014;9:4093–105. doi: 10.2147/IJN.S65567. [DOI] [PMC free article] [PubMed] [Google Scholar]
- 59.Lin J, et al. Penetration of lipid membranes by gold nanoparticles: insights into cellular uptake, cytotoxicity, and their relationship. ACS Nano. 2010;4:5421–9. doi: 10.1021/nn1010792. [DOI] [PubMed] [Google Scholar]
- 60.Verma A, et al. Surface-structure-regulated cell-membrane penetration by monolayer-protected nanoparticles. Nat Mater. 2008;7:588–95. doi: 10.1038/nmat2202. [DOI] [PMC free article] [PubMed] [Google Scholar]
Associated Data
This section collects any data citations, data availability statements, or supplementary materials included in this article.