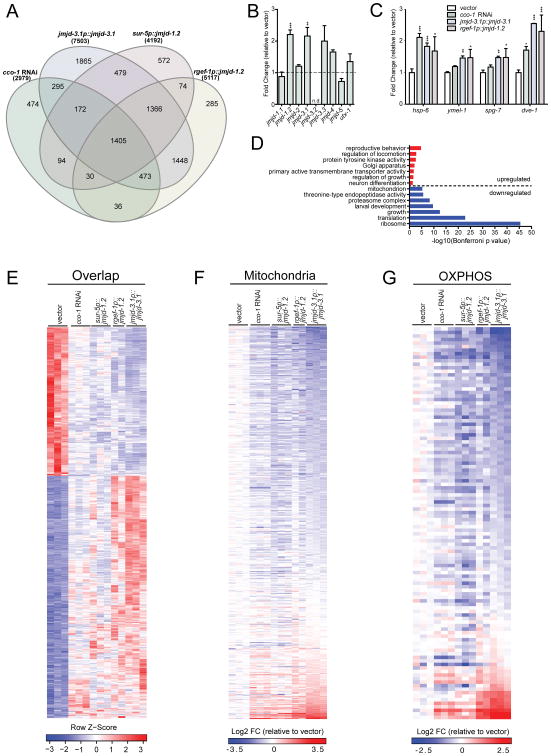
Figure 5. ETC Perturbation and JMJD Overexpression Share Common Lifespan Extension Mechanisms.
(A) Venn diagram of differentially expressed genes (DEGs) in cco-1 RNAi treated worms and transgenic overexpression lines jmjd-3.1p∷jmjd-3.1, sur-5p∷jmjd-1.2, rgef-1p∷jmjd-1.2, compared to wild type N2 worms on empty vector control, as measured by RNA-seq (Benjamini-Hochberg adjusted p value < 0.05). See Table S2 for complete list of DEGs.
(B) Transcriptional upregulation of jmjd-1.2 and jmjd-3.1 upon cco-1 RNAi. Gene expression analysis of all nine JmjC domain encoding genes in RNA-seq samples, expressed as fold change relative to wild type N2 on empty vector control. Results are expressed as mean ±SEM of normalized count values (n=3, Benjamini-Hochberg adjusted p values (padj) calculated by DESeq2, jmjd-1.2 padj=6.93E-09, jmjd-3.1 padj=0.002, jmjd-3.3 padj=0.452, jmjd-4 padj=0.085. n.d.= not detected, ** denotes p < 0.01, ***p < 0.001).
(C) UPRmt gene expression in RNA-seq samples, expressed as fold change relative to wild type N2 on empty vector control. Results are expressed as mean ±SEM of normalized count values. * denotes p < 0.05, **p < 0.01, ***p < 0.001).
(D) Representative top GO terms of upregulated and downregulated genes in the 1405 overlapping DEGs (Bonferroni adjusted p value<0.05). See also Table S2.
(E) Gene expression heatmap of 1405 overlapping DEGs in all 4 conditions described in(A). DESeq2-normalized count values were used for calculations. The indicated Row Z-scores reflect the number of standard deviations each replicate is apart from the mean gene expression value over all conditions. See also Table S2.
(F) Heatmap of 470 mitochondrial genes from GO cellular component category mitochondrion (GO:0005739). Fold change (FC) was calculated by comparing normalized count values of each condition to wild type N2 empty vector control, then transformed to log2 scale. See also Table S2.
(G) Heatmap of 111 OXPHOS genes from GO biological process category oxidative phosphorylation (GO:0006119) and manual annotation. See also Table S2.

