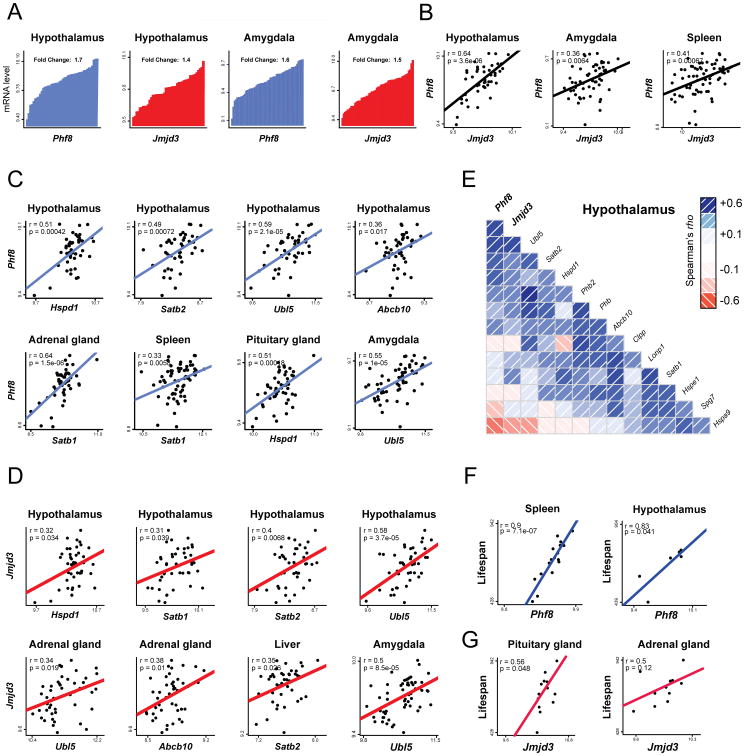
Figure 6. Positive Correlations between Phf8, Jmjd3, Lifespan and UPRmt transcripts in the BXD Mouse Genetic Reference Population.
(A) Variation of Phf8 and Jmjd3 mRNA levels in hypothalamus (n=44) and amygdala(n=56) across BXD mouse strains. Each bar represents mRNA levels from a pool of approximately five animals per strain.
(B) Positive correlations between Phf8 (y-axis) and Jmjd3 (x-axis) expression in hypothalamus (n=44), amygdala (n=56) and spleen (n=67).
(C) Positive correlations between Phf8 (y-axis) and selected UPRmt genes (x-axis) transcripts in various tissues (n=46 for adrenal gland, n=49 for pituitary gland).
(D) Positive correlations between Jmjd3 (y-axis) and selected UPRmt genes (x-axis) transcripts in various tissues (n=46 for liver).
(E) Spearman's correlation co-expression network for Phf8, Jmjd3 and UPRmt genes in hypothalamus. Blue correlations are positive, red correlations are negative – intensity of the colors corresponds to correlation coefficients.
(F) Pearson correlations of Lifespan versus Phf8 transcript levels in either spleen (left) or hypothalamus (right) of BXD mice.
(G) Pearson correlations of Lifespan versus Jmjd3 transcript levels in either pituitarygl and (left) or adrenal gland (right) of BXD mice.

