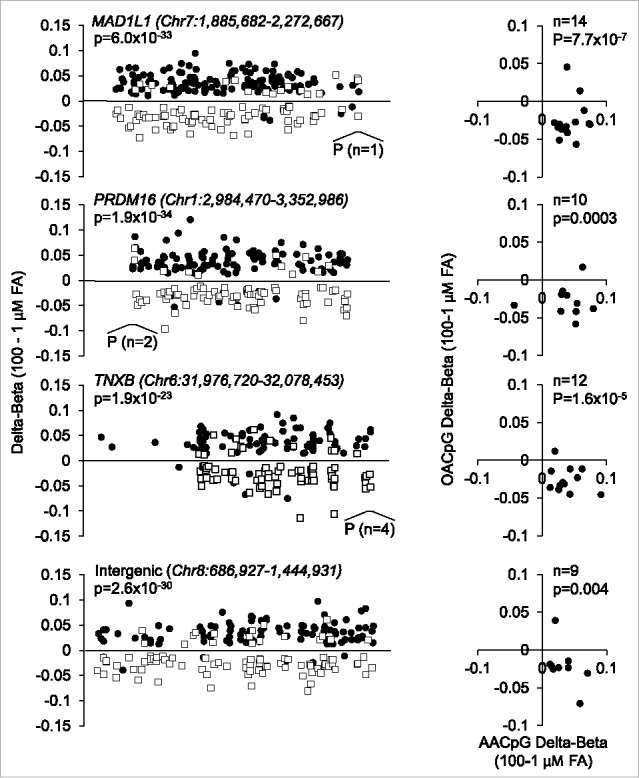
Figure 4.

Examples of locus-specific methylation profiles of AACpGs and OACpGs. Graphs on the left show the changes in DNA methylation of AACpGs (solid circles) and OACpGs (open squares). P indicates the position and number of CpGs mapping to promoters. Graphs on the right show the Δβ values of common CpGs to the AACpG and OACpG sets in each gene or intergenic region. P-values refer to unpaired (left) and paired (right) non-parametric tests (Mann-Whitney U test and Wilcoxon test, respectively).
