

ABSTRACT
Paclitaxel (taxol) is a chemotherapeutic agent frequently used in combination with other anti-neoplastic drugs. It is most effective during the M phase of the cell-cycle and tends to cause synchronization in malignant cells lines. In this study, we investigated whether timed, sequential treatment based on the cell-cycle characteristics could be exploited to enhance the cytotoxic effect of paclitaxel. We characterized the cell-cycle properties of a rapidly multiplying cell line (Sp2, mouse myeloma cells) by propidium-iodide DNA staining such as the lengths of various cell cycle phases and population duplication time. Based on this we designed a paclitaxel treatment protocol that comprised a primary and a secondary, timed treatment. We found that the first paclitaxel treatment synchronized the cells at the G2/M phase but releasing the block by stopping the treatment allowed a large number of cells to enter the next cell-cycle by a synchronized manner. The second treatment was most effective during the time when these cells approached the next G2/M phase and was least effective when it occurred after the peak time of this next G2/M phase. Moreover, we found that after mixing Sp2 cells with another, significantly slower multiplying cell type (Jurkat human T-cell leukemia) at an initial ratio of 1:1, the ratio of the two different cell types could be influenced by timed sequential paclitaxel treatment at will. Our results demonstrate that knowledge of the cell-cycle parameters of a specific malignant cell type could improve the effectivity of the chemotherapy. Implementing timed chemotherapeutic treatments could increase the cytotoxicity on the malignant cells but also decrease the side-effects since other, non-malignant cell types will have different cell-cycle characteristic and be out of synch during the treatment.
KEYWORDS: cell cycle, cell synchronization, chemotherapy, mitotic arrest, paclitaxel
Introduction
Paclitaxel (taxol) is a chemotherapeutic agent that was first isolated from the bark of the Pacific yew, Taxus brevifolia.1 It has a broad spectrum of antitumor activity. It is approved by the Food and Drug Administration in the US for the therapy of breast, ovarian, and lung cancer, as well as Kaposi's sarcoma. It is used off-label to treat endometrial, cervical, prostate, gastroesophageal, and head and neck tumors, in addition to sarcoma, lymphoma, and leukemia.2 The most frequently used doses of paclitaxel are 135 mg/m2 and 175 mg/m2 and it is administered as 3 or 24 hours lasting infusions and repeated in multiple, 21 days cycles or 7 days cycles. Taxanes are often combined with other drugs or with radiotherapy, e.g. taxane with anthracyclin, trastuzumab or cyclophosphamide or with platinum-based agents in the therapy of breast cancer.3–7
Paclitaxel's primary action is to bind to microtubules, especially β-tubulin, and prevent their depolimerization, thereby stabilizing mitotic spindle during mitosis.8 Inhibiting the transition through mitosis, it produces an arrest in the M phase of the cell cycle.1,9,10 Mitotic arrest caused by paclitaxel results in either prolonged arrest, apoptotic cell death or recovery and continued cycling if the blockade is released before the cells would initiate apoptosis. Although passage through mitosis is an absolute requirement for Taxol-induced death,11 it has been also suggested that cell death caused by taxol is not only due to mitotic arrest but it can also be the consequence of the action on interphase cells.12,13
Despite that paclitaxel had been shown to affect cell viability in other cell cycle phases,14 its cytotoxic activity is most effective during M phase.15 As low as 5 nM of paclitaxel is enough to arrest and to subsequently kill malignant cells, but the effectiveness and the required concentration is highly dependent on the length of the treatment and the cell type.15 Namely, the treatment has to accommodate the cell cycle dynamics. Thus, proposals had been put forward to exploit paclitaxel's selectivity toward mitotic cells in cancer therapy. Wang et al. showed that synchronizing ovarium cancer cell lines reverses paclitaxel resistance.9 On the other hand, cell-cycle arrest and synchronization was also found to significantly contribute to cell sensitization by paclitaxel to radiotherapy.16,17
The aim of the present study was to develop a cytotoxic treatment scheme that is tailored toward a specific cell line. Using paclitaxel as being both a cell cycle synchronizing and a cytotoxic drug, we employed a timed sequential treatment schedule that was based on the cell cycle characteristics of the Sp2 cell line. Moreover, applying the same treatment schedule, we selectively targeted this cell line in a mixture of Sp2 and an other cell line with a different cell cycle characteristic.
Results
Synchronization of Sp2 cells with paclitaxel
Our preliminary data showed that ∼0.03 – 0.1 mg/L of paclitaxel treatment for 12–15 hours was sufficient to halt Sp2 cells at the G2/M phase without causing immediate cell death (data not shown). Therefore we used 0.05 mg/L paclitaxel treatment for 14 hours to transiently block the cells in G2/M phase, and then released the blockage by vigorously washing out paclitaxel from the cell culture medium. We monitored the cell cycle distribution of Sp2 cells for 24 hours by propidium-iodide staining. As shown in Figure 1A, this experimental setup caused a complete, temporary block at the G2/M phase but once the blockade was raised, the cells entered the next cell cycle. Moreover, the cells remained relatively synchronized until the end of the monitoring; up to 24 hours after treatment.
Figure 1.
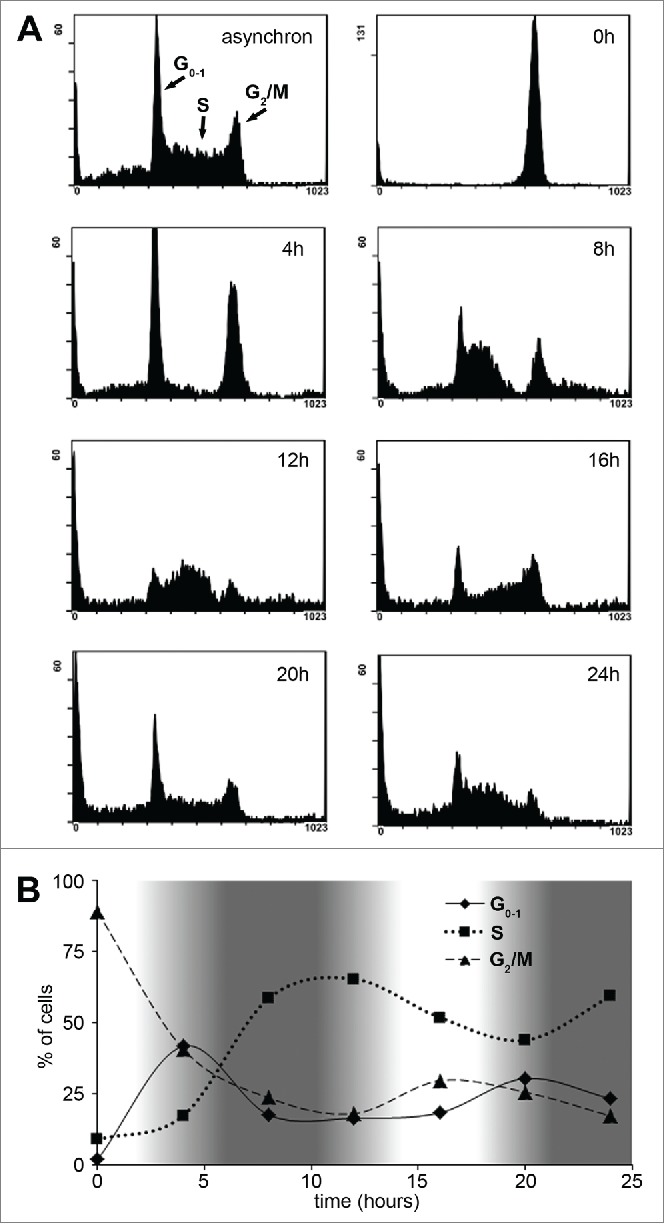
Characterization of Sp2 cells' cell cycle dynamics after synchronization with paclitaxel. (A) Sp2 cells were treated with 0.05 mg/L paclitaxel for 14 hours then allowed to recover from the blockage. Cell cycle distribution was monitored every 4 hours by flow cytometry and propidium-iodide staining after fixation of the cells. Cell cycle distributions are shown as histogram plots of the FL3 fluorescence channel. (B) The relative number of cells in G0-1, S and G2/M phase over time are shown. White areas on the graph indicate cell cycle phases when the cells are more susceptible (cells in the G2/M phase are the most abundant) while darker areas indicate intervals when cells are least susceptible to a subsequent paclitaxel treatment.
The ratio of cells in G0-1, S and G2/M phase was calculated every 4 hours and plotted (Fig. 1B). The elapsed time between 2 consecutive peaks (e.g., S –S or G2/M - G2/M) was approximately 16 hours therefore the average time of one complete cell cycle of Sp2 cells lasted 16 hours. We have also estimated the duration of each cell cycle phases based on the following equation: Td+TPhase=Ttotal Phase where Td is the delay between the first and the last cell entering a given cell cycle phase, Tphase is the average time a cell spends in that phase and Ttoal Phase is the total time between the first cell entering and the last cell exiting the phase (the latter was measured as the time between the start and the end of a peak (e.g., 0 – 8 hours for G0)). Applying this equation for each cell cycle phases resulted in the following estimations for the duration of the cell cycle phases: G0-1 ≈1.5 hours, S ≈9.5 hours, G2/M ≈5 hours and Td ≈6.5 hours.
Timing of the second treatment significantly influences paclitaxel's cytotoxicity
Since paclitaxel mainly acts during mitosis, we assumed that synchronized Sp2 cells have a “sweet spot,” a time period during their progress in the cell cycle when they are more susceptible for a subsequent treatment. These periods are shown as fading-in/fading-out white areas in Fig 1B when the largest amounts of cells are in G2/M phase. To test this hypothesis, we synchronized Sp2 cells with paclitaxel then after various delay periods, we exposed them to a second paclitaxel treatment (Fig. 2A). The duration of the second treatment – 8 hours – proved to be a good compromise: long enough to cover most of the cells entering G2/M phase but short enough that experiments with various delay periods would not overlap too much.
Figure 2.
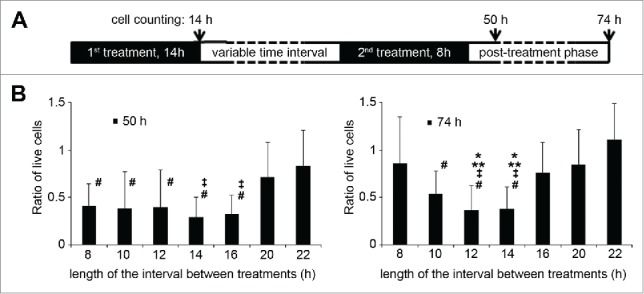
The efficiency of sequential paclitaxel treatments of Sp2 cells depends on the timing. (A) Design of the experimental protocol. Sp2 cells were treated with 0.05 mg/L of paclitaxel for 14 hours, then left to recover for various amounts of time (8–22 hours). A second, 0.05 mg/L paclitaxel treatment followed for 8 hours, then the cells were placed in paclitaxel-free, complete medium, and the number of live cells was counted by trypan-blue exclusion dye staining approx. two and three days (50 h and 74h) after the start of the experiments. (B) Ratio of live cells compared to the number of live cells counted at the 0 hour mark (end of the 1st paclitaxel treatment) at 50 and 74 hours. Bars are representing the average of a set of individual experiments where the interval times between sequential paclitaxel treatments were 8–22 hours. Data are shown as means ±SD, *P < 0.05 vs. 8 hours interval time, **P < 0.05 vs. 16 hours, ‡P < vs 20 hours, #P < vs 22 hours.
We have found that the second treatment was most effective when it occurred between ∼12-14 and 20–22 hours after the end of the first treatment. In contrast, if the second treatment occurred 22 – 30 hours after the end of the first treatment, significantly more cells survived. This difference between optimal and sub-optimal timing could be followed up to 2 days after the experiments (Fig. 2B).
Timed sequential paclitaxel treatment can favor one cell type over another
We tested whether we could apply consecutive paclitaxel treatments to discriminate between two cell lines that have different cell cycle characteristics. For this reason, we have chosen Jurkat cells to pair with Sp2 cells. Based on preliminary experiments, the Jurkat cell line we used had an approx. 24–36 hours population doubling time under the same cell culture conditions used for Sp2 cells (data not shown). The Jurkat cell line we used was expressing GFP which was necessary to distinguish between the two cell lines. First, we compared the cell cycle characteristics of the two cell lines in asynchron cultures and also after 14 hours of 0.05 mg/L paclitaxel treatment (optimal only for Sp2 cells) as shown in Figure 3.
Figure 3.
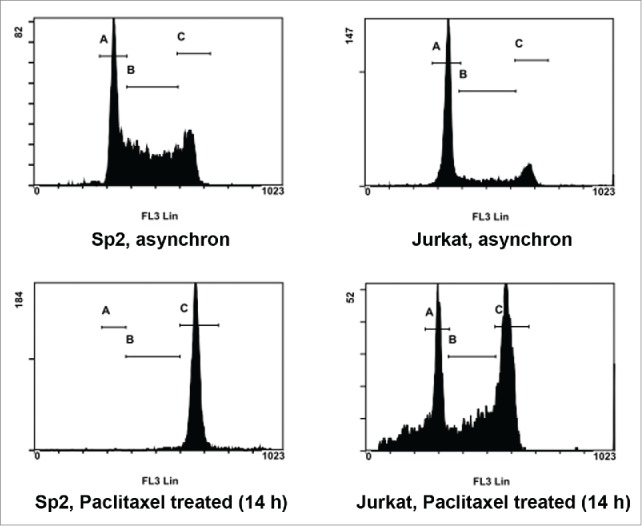
Synchronization efficiency of paclitaxel on Sp2 and Jurkat cells at a fixed duration time. Both Sp2 and Jurkat cells were exposed to the same paclitaxel treatment: 0.05 mg/L for 14 hours. Cell cycle distribution was analyzed by flow cytometry and propidium-iodide staining after fixation of the cells. Top row: histogram plot of cell cycle distribution without paclitaxel treatment. Bottom row: cell cycle distribution after 14 hours of 0.05 mg/L paclitaxel treatment. Regions indicated in all histogram plots are: G0-1 (A), S (B) and G2/M phase (C).
The ratios of cells in the cell cycle phases were the followings: asynchron Sp2 cells: 37.3(±1.4)% G0-1 phase, 40.2(±5.2)% S phase, 22.5(±3.8)% G2/M phase. Asynchron Jurkat cells: 55(±3.4)% G0-1 phase, 23.5(±4.3)% S phase, 21.5(±1.5)% G2/M phase. Sp2 cells after 14 hours of 0.05mg/L paclitaxel treatment: 2.5(±0.9)% G0-1 phase, 5(±0.8)% S phase, 92.4(±1.5)% G2/M phase. Jurkat cells after 14 hours of 0.05 mg/L paclitaxel treatment: 34.4(±3.8)% G0-1 phase, 24.3(±3.6)% S phase, 41.3(±7.4)% G2/M phase.
Next, we mixed Sp2 cells and Jurkat cells at 1:1 ratio and treated them for 14 hours with 0.05 mg/L paclitaxel, then measured the amount of cells by flow cytometry one, two or three days after the treatment. As shown in Figure 4A and Figure 4B, if no subsequent treatment followed Sp2 cells quickly overcame the number of Jurkat cells, despite that the first paclitaxel treatment was intended to be more effective on them than on Jurkat cells. Similarly, when a second treatment occurred at a sub-optimal time period, the ratio of Sp2 cells compared to Jurkat cells was almost as high as in the absence of the second treatment. On the other hand, if the first treatment was followed-up by a second, optimal timed paclitaxel treatment, the ratio of Sp2/Jurkat cells remained significantly lower.
Figure 4.
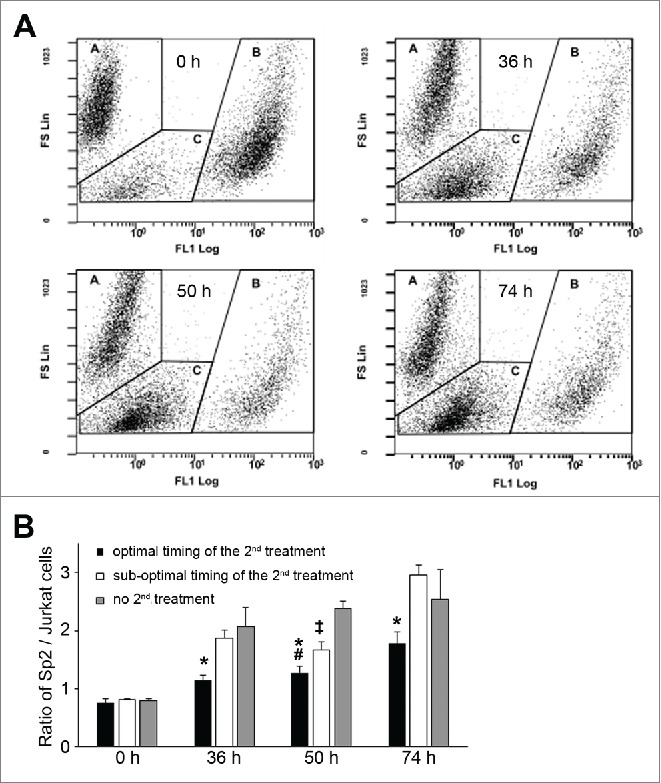
Timing of sequential paclitaxel treatment discriminates cell lines with different cell cycle properties. (A) Sp2 and GFP-expressing Jurkat cells were initially mixed at ∼1:1 ratio (0h), treated for 14 hours with 0.05 mg/L paclitaxel then left to recover until the end of the experiments. The ratio of Sp2 and Jurkat was analyzed at the indicated times after the start of the experiments by counting cells with flow cytometry, without fixation. Data points are shown as a function of forward scatter (FS, ∼cell size) and green fluorescence (FL1, GFP). In each plot, regions indicated with ‘A’ corresponds to Sp2 cells, regions indicated with ‘B’ corresponds to GFP-expressing Jurkat cells, while regions indicated with ‘C’ corresponds to cell debris. (B) Sp2 and GFP-expressing Jurkat cells were mixed at ∼1:1 ratio and exposed to sequential paclitaxel treatment. Based on previous experiments (shown in Fig. 2), ‘optimal timing’ of the second paclitaxel started 14 hours after; while ‘sub-optimal timing’ started 22 hours after the end of the first treatment. The ratio of Sp2/Jurkat cells was counted at 0 hour, 36 hours, 50 hours and 74 hours after the start of the experiments. Data are shown as means ±SD, *P < 0.05 optimal vs. sub-optimal, #P < 0.05 optimal vs no 2nd treatment, ‡P < 0.05 sub-optimal vs. no 2nd treatment.
Discussion
In the present study we demonstrated the effect of timed, sequential treatments with paclitaxel on Sp2 mouse hybridoma cell line. Based on the cell cycle data specific for Sp2, we could significantly improve the cytotoxic ability of paclitaxel. We have also shown that optimal timing of subsequent treatments could be used to differentiate between cell types with various cell cycle characteristics. In contrast to sub-optimal timing, sequential paclitaxel treatment targeted against Sp2 cells was significantly more effective than against Jurkat cells. These results suggest that analyzing the cell cycle properties of malignant cells and scheduling chemotherapeutic regimes based on this information could improve the efficacy of anti-cancer therapy.
Several parameters describing cell cycle kinetics, including potential doubling time (Tpot) and bromodeoxyuridine (BrdU) labeling index have been tried to predict therapy outcome.18,19 Our present findings also indicate that cell cycle characteristics, such as population doubling time, the proportion and transit time of cells in various cell cycle phases are important factors influencing the effectiveness of cytotoxic treatment. We think that this information should be seriously considered during differential diagnosis and before anti-tumor intervention. Unfortunately, this happens very rarely in the clinical practice. There are a number of methods available to measure cell cycle properties. In vivo administration of BrdU followed by delayed biopsy allows the estimation of potential doubling time (Tpot) of malignant tumors because BrdU incorporates in the nuclei during DNA synthesis in S phase.19 Analyzing the amount of DNA and cell cycle distribution in cells from biopsies by flow cytometry or microscopy using DNA stains such as propidium-iodide is also an option. Non-invasive techniques such as MRI has been also used to estimate the proportion of dividing cells.20 However none of these techniques are without limitations. E.g. analyzing DNA staining by flow cytometry requires individual cells to be released from the tumor mass and suspend in a buffer which might be challenging in some types of malignant tissues. In vitro culturing of isolated cells could increase the number of cells available to analyze, however in vitro cell cycle characteristics are not necessarily reflecting in vivo conditions. Probably the biggest difficulty is that cancer tissues are inhomogeneous most of the time, part of the tumor mass is necrotic, part of it is growing slower than Tpot would allow.21 Thus, collecting biopsies representative of the whole tumor or improving non-invasive imaging techniques are of utmost importance to enhance the intra-tumoral cell cycle analysis capabilities.
Some degree of cell synchronization is a long known consequence of cancer therapy and therapies specifically designed to manipulate cell cycle and to synchronize cells are dating back in the seventies.22 In more recent years, the focus in research and in development of new anti-cancer therapies shifted to cell cycle agents, many of them are cycline dependent kinase inhibitors.23,24 In these therapeutic approaches, cell differentiation agents are often used in combination with cytotoxic drugs25 or with radiotherapy.26,27 Paclitaxel was also applied and found effective in synchronizing and sensitizing malignant cell lines against radiotherapy.16 Interestingly, Wang et al. demonstrated on cell cultures that synchronization prior to paclitaxel treatment also improved paclitaxel's cytotoxic potency.9 However, to our knowledge there is no current clinical or pre-clinical application of the combined use of cell cycle analysis and subsequent therapy which incorporates these specific cell cycle data.
In our experiments, we used paclitaxel to both synchronize and to kill malignant cells at 0.05 mg/L or ∼60 nmol/L. In human therapy, the plasma concentration of paclitaxel ranges from around 80 nmol/L to 500 nmol/L, but the intracellular paclitaxel concentration was found to be much higher, up to 1–9 µmol/L.2,28 Thus the conditions in our experiments are comparable to the lower end of the therapeutic range. Sp2 cells are rapidly multiplying cells, with an average population doubling time of 16 hours. Paclitaxel has long been shown to be most effective against fast growing cells.15 Thus, Sp2 cell line is very suitable to test sequential treatment.
This technique could be proven more difficult to apply on a slower growing cell line. Cell production rate of cancers have a very wide range; population duplication can happen in a few days or in several months.29 In theory, paclitaxel could be administered to patients over a long period of time to increase the amount of malignant cells entering and subsequently arresting at G2/M phase. However, longer exposure also increases the severity of cytotoxic damage done to non-malignant cells. This major limitation for the “traditional” anti-cancer therapies also hinders sequential treatments; the success or failure of the first treatment to synchronize the cells will greatly impact the effectivity of the subsequent, timed treatments. Moreover, tumor growth is not only determined by cell cycle kinetic, but by other factors as well, such as tumor size and location, necrosis due to inaccessibility to nutrients, the anti-cancer capacity of the immune system, etc. Another limitation is that in vivo, a large percentage of the cancer cells are quiescent (G0/G1 phase) and are resistant to chemotherapy and to synchronization. To circumvent this, a number of techniques have been proposed to force quiescent cells to pass the restriction point in G1. Treatment with methioninase, telomerase-dependent adenovirus or even infection with Salmonella typhimurium A1-R have been all shown to effectively mobilize the cell cycle in malignant cell lines.30–32 Despite these limitations, we think that even a slight improvement of the traditional treatment by sequential therapy would be welcomed in oncotherapy. In the future, more extensive studies of sequential treatment could discover new strategies to overcome some of the limitations. E.g. the combination of paclitaxel with other drugs could improve or expand the applicability of this method significantly. Recombinant methioninase therapy, which is a promising tool in anti-cancer therapy could be applied in a sequential manner similar to our experimental design; instead of paclitaxel, methioninase could be used to selectively block and consequently synchronize malignant cells in S/G2 phase due to depletion of methionine.33–35 In our study, we used paclitaxel in a monotherapy model. Paclitaxel kills cells by mitotic arrest and a popular but controversial hypothesis is that the duration of mitotic arrest is predictive of cell death, thus cells being arrested for a longer time are more likely to die.2 With the use of other cytotoxic agents, the time needed for mitotic arrest to onset cell death could be significantly reduced.
In summary, our experiments demonstrated that analyzing the cell cycle properties of an individual cell type and timing the therapy based on this information could improve the effectivity of the cytotoxic treatment. We successfully used a single drug, paclitaxel in sequential treatments at therapeutically relevant concentration to synchronize and subsequently kill cells in a cell culture model. Moreover, with careful choice of treatment times we could improve the selectivity of the treatment for a particular cell type and reduce the „collateral” damage done to a different cell type.
Materials and methods
Cell line and culture conditions
Jurkat cells (ATCC TIB 152 human acute T-cell leukemia) transformed to transiently express green fluorescence protein (GFP) and Sp2 cells (ATCC CRL-1581 mouse hybridoma) were the kind gift of F. Boldizsar and P. Balogh from the Dept. of Immunology and Biotechnology of the University of Pecs. Both cell lines were grown in a 1:1 mixture of EMEM and Ham's F12 medium supplemented with 10% fetal bovine serum (FBS), 1% non-essential amino acids, penicillin (100 U/mL) and streptomycin (100 µg/mL). The cells were incubated at 37°C, 5% CO2 in a humidified incubator. Subculturing was performed in every 2–3 days and fresh medium was replaced 12–24 h prior to each experiment.
Paclitaxel treatment
6 mg/L stock solution of Paclitaxel (120X) was freshly prepared before each experiment from commercially available, 6 mg/mL paclitaxel solution used in human medicine (Teva Magyarország Ltd.). Sp2 or Jurkat cells were treated with 0.05 mg/L Paclitaxel for 14 hours, in complete media. Next, the cells were centrifuged at 500 rcf for 5 min. and washed in complete media 3 times to remove any trace amount of paclitaxel then the cells were re-suspended in complete, paclitaxel-free media and left for various time periods to recover. In some of the experiments, a second paclitaxel treatment (0.05 mg/L for 8 hours) and a second recovery time occurred (Fig. 2A). Throughout the experiments, the cells were kept at 37°C, 5% CO2 in a humidified incubator.
Cell counting
Cell numbers before and during the experiments were measured by trypan-blue exclusion dye staining in a hemocytometer. Briefly, 90 µL of homogenous cell suspension was mixed with 10 µL of 2% trypan-blue in 0.9% NaCl and immediately counted in a hemocytometer. Cells not stained by trypan-blue were considered living cells. Cell numbers were averaged from counting at least 18 separate regions of the hemocytometer and then divided by the average cell number measured at the start of the experiments.
In experiments when Jurkat and Sp2 cells were mixed in the same culture medium, we analyzed the relative number of cells by flow cytometry. Briefly, homogenous cell suspensions were prepared by vigorous pipetting and cell suspensions were subsequently measured by Cytomics FC 500 flow cytometer (Beckman Coulter). To discriminate GFP-positive Jurkat cells, Sp2 cells and cell debris, forward scatter (proportional to cell size) and fluorescence intensity at 525 nm (FL1 channel) was simultaneously detected. The same selection of regions was used and 10000 particles were counted in all experiments. The relative number of cells was expressed as the ratio of Sp2 / Jurkat cells.
Cell cycle analysis
Approximately 106 cells were washed quickly in PBS then 1 mL ice-cold ethanol was added gradually, drop by drop while thoroughly vortexing them. The ethanol-fixed cells were kept at 4ºC for at least 15 min. before washing with PBS 3X and re-suspending in Propidium-Iodide (PI) solution (PBS, 0.1% Triton-X 100, 20 μg/ml PI, 0.2 mg/ml RNase A). After 30 min. incubation in dark at room temperature, the fluorescence intensity of PI dye per cell was detected at 620 nm (FL3 channel) with Cytomics FC 500 flow cytometer. Gating and selection of regions (G0-1, S and G2/M phase) were performed on control cells and identical selections were utilized for all samples.
Data analysis
Data are presented as means ± standard deviations (SD) throughout. Comparisons were performed by One-way ANOVA plus Bonferroni's post-comparison test using Graphpad Prism software. Statistically significant differences between groups were defined as P values < 0.05 and are indicated in the legends of figures.
Abbreviations
- BrdU
bromodeoxyuridine
- GFP
green fluorescence protein
- PI
Propidium-Iodide
- Tpot
potential doubling time
Disclosure of potential conflicts of interest
No potential conflicts of interest were disclosed.
Acknowledgments
We thank Péter Balogh and Ferenc Boldizsár at the Dept. of Immunology and Biotechnology of the University of Pécs for providing the Sp2 and Jurkat cells.
Funding
This work was funded by the Research Fund of the University of Pécs, Faculty of Medicine [ÁOK-KA 2013/19] and supported by János Szentágothai Research Center.
References
- [1].Wani MC, Taylor HL, Wall ME, Coggon P, McPhail AT. Plant antitumor agents. VI. The isolation and structure of taxol, a novel antileukemic and antitumor agent from Taxus brevifolia. J Am Chem Soc 1971; 93:2325-7; PMID:5553076; http://dx.doi.org/ 10.1021/ja00738a045 [DOI] [PubMed] [Google Scholar]
- [2].Weaver BA. How Taxol/paclitaxel kills cancer cells. Mol Biol Cell 2014; 25:2677-81; PMID:25213191; http://dx.doi.org/ 10.1091/mbc.E14-04-0916 [DOI] [PMC free article] [PubMed] [Google Scholar]
- [3].Dyer M, Richardson J, Robertson J, Adam J. NICE guidance on bevacizumab in combination with paclitaxel and carboplatin for the first-line treatment of advanced ovarian cancer. Lancet Oncol 2013; 14:689-90; PMID:23706983; http://dx.doi.org/ 10.1016/S1470-2045(13)70248-1 [DOI] [PubMed] [Google Scholar]
- [4].NCCN Clinical Practice Guidelines in Oncology [Internet]. Available from: http://www.nccn.org/professionals/physician_gls/f_guidelines.asp [Google Scholar]
- [5].Markman M. Current standards of care for chemotherapy of optimally cytoreduced advanced epithelial ovarian cancer. Gynecol Oncol 2013; 131:241-5; PMID:23726888; http://dx.doi.org/ 10.1016/j.ygy-no.2013.05.029 [DOI] [PubMed] [Google Scholar]
- [6].Kumar A, Hoskins PJ, Tinker AV. Dose-dense paclitaxel in advanced ovarian cancer. Clin Oncol (R Coll Radiol) 2015; 27:40-7; PMID:25455846; http://dx.doi.org/ 10.1016/j.clon.2014.10.001 [DOI] [PubMed] [Google Scholar]
- [7].Seidman AD, Berry D, Cirrincione C, Harris L, Muss H, Marcom PK, Gipson G, Burstein H, Lake D, Shapiro CL, et al.. Randomized phase III trial of weekly compared with every-3-weeks paclitaxel for metastatic breast cancer, with trastuzumab for all HER-2 overexpressors and random assignment to trastuzumab or not in HER-2 nonoverexpressors: final results of Cancer and Leu. J Clin Oncol 2008; 26:1642-9; PMID:18375893; http://dx.doi.org/ 10.1200/JCO.2007.11.6699 [DOI] [PubMed] [Google Scholar]
- [8].Parness J, Horwitz SB. Taxol binds to polymerized tubulin in vitro. J Cell Biol 1981; 91:479-87; PMID:6118377; http://dx.doi.org/ 10.1083/jcb.91.2.479 [DOI] [PMC free article] [PubMed] [Google Scholar]
- [9].Wang X, Pan L, Mao N, Sun L, Qin X, Yin J. Cell-cycle synchronization reverses Taxol resistance of human ovarian cancer cell lines. Cancer Cell Int 2013; 13:77; PMID:23899403; http://dx.doi.org/ 10.1186/1475-2867-13-77 [DOI] [PMC free article] [PubMed] [Google Scholar]
- [10].Hornick JE, Bader JR, Tribble EK, Trimble K, Breunig JS, Halpin ES, Vaughan KT, Hinchcliffe EH. Live-cell analysis of mitotic spindle formation in taxol-treated cells. Cell Motil Cytoskeleton 2008; 65:595-613; PMID:18481305; http://dx.doi.org/ 10.1002/cm.20283 [DOI] [PMC free article] [PubMed] [Google Scholar]
- [11].Long BH, Fairchild CR. Paclitaxel inhibits progression of mitotic cells to G1 phase by interference with spindle formation without affecting other microtubule functions during anaphase and telephase. Cancer Res 1994; 54:4355-61; PMID:7913875 [PubMed] [Google Scholar]
- [12].Janssen A, Beerling E, Medema R, van Rheenen J. Intravital FRET imaging of tumor cell viability and mitosis during chemotherapy. PLoS One 2013; 8:e64029; PMID:23691140; http://dx.doi.org/ 10.1371/journal.pone.0064029 [DOI] [PMC free article] [PubMed] [Google Scholar]
- [13].Zasadil LM, Andersen KA, Yeum D, Rocque GB, Wilke LG, Tevaarwerk AJ, Raines RT, Burkard ME, Weaver BA. Cytotoxicity of paclitaxel in breast cancer is due to chromosome missegregation on multipolar spindles. Sci Transl Med 2014; 6:229ra43; PMID:24670687; http://dx.doi.org/ 10.1126/scitranslmed.3007965 [DOI] [PMC free article] [PubMed] [Google Scholar]
- [14].Geard CR, Jones JM. Radiation and taxol effects on synchronized human cervical carcinoma cells. Int J Radiat Oncol Biol Phys 1994; 29:565-9; PMID:7911795; http://dx.doi.org/ 10.1016/0360-3016(94)90457-X [DOI] [PubMed] [Google Scholar]
- [15].Liebmann JE, Cook JA, Lipschultz C, Teague D, Fisher J, Mitchell JB. Cytotoxic studies of paclitaxel (Taxol) in human tumour cell lines. Br J Cancer 1993; 68:1104-9; PMID:7903152; http://dx.doi.org/ 10.1038/bjc.1993.488 [DOI] [PMC free article] [PubMed] [Google Scholar]
- [16].Wenz F, Greiner S, Germa F, Mayer K, Latz D, Weber KJ. Radiochemotherapy with paclitaxel: synchronization effects and the role of p53. Strahlenther Onkol 1999; 175(3):2-6; PMID:10554637; http://dx.doi.org/ 10.1007/BF03215919 [DOI] [PubMed] [Google Scholar]
- [17].Supiot S, Gouard S, Charrier J, Apostolidis C, Chatal JF, Barbet J, Davodeau F, Cherel M. Mechanisms of cell sensitization to α radioimmunotherapy by doxorubicin or paclitaxel in multiple myeloma cell lines. Clin Cancer Res 2005; 11:7047s-52s; PMID:16203801; http://dx.doi.org/ 10.1158/1078-0432.CCR-1004-0021 [DOI] [PubMed] [Google Scholar]
- [18].Begg AC, Haustermans K, Hart AA, Dische S, Saunders M, Zackrisson B, Gustaffson H, Coucke P, Paschoud N, Hoyer M, et al.. The value of pretreatment cell kinetic parameters as predictors for radiotherapy outcome in head and neck cancer: a multicenter analysis. Radiother Oncol 1999; 50:13-23; PMID:10225552; http://dx.doi.org/ 10.1016/S0167-8140(98)00147-9 [DOI] [PubMed] [Google Scholar]
- [19].Bertuzzi A, Gandolfi A, Sinisgalli C, Starace G, Ubezio P. Cell loss and the concept of potential doubling time. Cytometry 1997; 29:34-40; PMID:9298809; http://dx.doi.org/ 10.1002/(SICI)1097-0320(199709-01)29:1<34::AID-CYTO3>3.0.CO;2-D [DOI] [PubMed] [Google Scholar]
- [20].Xu J, Xie J, Jourquin J, Colvin DC, Does MD, Quaranta V, Gore JC. Influence of cell cycle phase on apparent diffusion coefficient in synchronized cells detected using temporal diffusion spectroscopy. Magn Reson Med 2011; 65:920-6; PMID:21413058; http://dx.doi.org/ 10.1002/mrm.22704 [DOI] [PMC free article] [PubMed] [Google Scholar]
- [21].Yano S, Zhang Y, Miwa S, Tome Y, Hiroshima Y, Uehara F, Yamamoto M, Suetsugu A, Kishimoto H, Tazawa H, et al.. Spatial-temporal FUCCI imaging of each cell in a tumor demonstrates locational dependence of cell cycle dynamics and chemoresponsiveness. Cell Cycle 2014; 13:2110-9; PMID:24811200; http://dx.doi.org/ 10.4161/cc.29156 [DOI] [PMC free article] [PubMed] [Google Scholar]
- [22].Auersperg M, Soba E, Vraspir-Porenta O. Intravenous chemotherapy with syndronization in advanced cancer of oral cavity and oropharynx. Z Krebsforsch Klin Onkol Cancer Res Clin Oncol 1977; 90:149-59; PMID:74141; http://dx.doi.org/ 10.1007/BF00285321 [DOI] [PubMed] [Google Scholar]
- [23].Deep G, Agarwal R. New combination therapies with cell-cycle agents. Curr Opin Investig Drugs 2008; 9:591-604; PMID:18516759 [PMC free article] [PubMed] [Google Scholar]
- [24].Gelbert LM, Cai S, Lin X, Sanchez-Martinez C, del Prado M, Lallena MJ, Torres R, Ajamie RT, Wishart GN, Flack RS, et al.. Preclinical characterization of the CDK4/6 inhibitor LY2835219: in-vivo cell cycle-dependent/independent anti-tumor activities alone/in combination with gemcitabine. Invest New Drugs 2014; 32:825–37; PMID:24919854; http://dx.doi.org/17256134 10.1007/s10637-014-0120-7 [DOI] [PMC free article] [PubMed] [Google Scholar]
- [25].Verheul HMW, Qian DZ, Carducci MA, Pili R. Sequence-dependent antitumor effects of differentiation agents in combination with cell cycle-dependent cytotoxic drugs. Cancer Chemother Pharmacol 2007; 60:329-39; PMID:17256134; http://dx.doi.org/ 10.1007/s00280-006-0379-2 [DOI] [PubMed] [Google Scholar]
- [26].Pawlik TM, Keyomarsi K. Role of cell cycle in mediating sensitivity to radiotherapy. Int J Radiat Oncol Biol Phys 2004; 59:928-42; PMID:15234026; http://dx.doi.org/ 10.1016/j.ijrobp.2004.03.005 [DOI] [PubMed] [Google Scholar]
- [27].Park SS, Kim YJ, Ju EJ, Shin SH, Choi J, Park J, Lee JH, Lee KJ, Park J, Park HJ, et al.. Ibulocydine sensitizes human cancers to radiotherapy by induction of mitochondria-mediated apoptosis. Radiother Oncol 2014; 112:295-301; PMID:25082098; http://dx.doi.org/ 10.1016/j.radonc.2014.07.005 [DOI] [PubMed] [Google Scholar]
- [28].Rowinsky EK, Jiroutek M, Bonomi P, Johnson D, Baker SD. Paclitaxel steady-state plasma concentration as a determinant of disease outcome and toxicity in lung cancer patients treated with paclitaxel and cisplatin. Clin Cancer Res 1999; 5:767-74; PMID:10213211 [PubMed] [Google Scholar]
- [29].Rew DA, Wilson GD. Cell production rates in human tissues and tumours and their significance. Part II: clinical data. Eur J Surg Oncol 2000; 26:405-17; PMID:10873364; http://dx.doi.org/ 10.1053/ejso.1999.0907 [DOI] [PubMed] [Google Scholar]
- [30].Yano S, Li S, Han Q, Tan Y, Bouvet M, Fujiwara T, Hoffman RM. Selective methioninase-induced trap of cancer cells in S/G2 phase visualized by FUCCI imaging confers chemosensitivity. Oncotarget 2014; 5:8729-36; PMID:25238266; http://dx.doi.org/ 10.18632/onco-target.2369 [DOI] [PMC free article] [PubMed] [Google Scholar]
- [31].Yano S, Tazawa H, Hashimoto Y, Shirakawa Y, Kuroda S, Nishizaki M, Kishimoto H, Uno F, Nagasaka T, Urata Y, et al.. A genetically engineered oncolytic adenovirus decoys and lethally traps quiescent cancer stem-like cells in S/G2/M phases. Clin Cancer Res 2013; 19:6495-505; PMID:24081978; http://dx.doi.org/ 10.1158/1078-0432.CCR-13-0742 [DOI] [PubMed] [Google Scholar]
- [32].Yano S, Zhang Y, Zhao M, Hiroshima Y, Miwa S, Uehara F, Kishimoto H, Tazawa H, Bouvet M, Fujiwara T, et al.. Tumor-targeting Salmonella typhimurium A1-R decoys quiescent cancer cells to cycle as visualized by FUCCI imaging and become sensitive to chemotherapy. Cell Cycle 2014; 13:3958-63; PMID:25483077; http://dx.doi.org/ 10.4161/15384101.2014.964115 [DOI] [PMC free article] [PubMed] [Google Scholar]
- [33].Hoffman RM, Jacobsen SJ. Reversible growth arrest in simian virus 40-transformed human fibroblasts. Proc Natl Acad Sci U S A 1980; 77:7306-10; PMID:6261250; http://dx.doi.org/ 10.1073/pnas.77.12.7306 [DOI] [PMC free article] [PubMed] [Google Scholar]
- [34].Stern PH, Hoffman RM. Enhanced in vitro selective toxicity of chemotherapeutic agents for human cancer cells based on a metabolic defect. J Natl Cancer Inst 1986; 76:629-39; PMID:3457200 [DOI] [PubMed] [Google Scholar]
- [35].Hoffman RM. Development of recombinant methioninase to target the general cancer-specific metabolic defect of methionine dependence: a 40-year odyssey. Expert Opin Biol Ther 2015; 15:21-31; PMID:25439528; http://dx.doi.org/ 10.1517/14712598.2015.963050 [DOI] [PubMed] [Google Scholar]