

ABSTRACT
Epigenome-wide association studies of disease widely use DNA methylation measured in blood as a surrogate tissue. Cell proportions can vary between people and confound associations of exposure or outcome. An adequate reference panel for estimating cell proportions from adult whole blood for DNA methylation studies is available, but an analogous cord blood cell reference panel is not yet available. Cord blood has unique cell types and the epigenetic signatures of standard cell types may not be consistent throughout the life course. Using magnetic bead sorting, we isolated cord blood cell types (nucleated red blood cells, granulocytes, monocytes, natural killer cells, B cells, CD4+T cells, and CD8+T cells) from 17 live births at Johns Hopkins Hospital. We confirmed enrichment of the cell types using fluorescence assisted cell sorting and ran DNA from the separated cell types on the Illumina Infinium HumanMethylation450 BeadChip array. After filtering, the final analysis was on 104 samples at 429,794 probes. We compared cell type specific signatures in cord to each other and methylation at 49.2% of CpG sites on the array differed by cell type (F-test P < 10−8). Differences between nucleated red blood cells and the remainder of the cell types were most pronounced (36.9% of CpG sites at P < 10−8) and 99.5% of these sites were hypomethylated relative to the other cell types. We also compared the mean-centered sorted cord profiles to the available adult reference panel and observed high correlation between the overlapping cell types for granulocytes and monocytes (both r=0.74), and poor correlation for CD8+T cells and NK cells (both r=0.08). We further provide an algorithm for estimating cell proportions in cord blood using the newly developed cord reference panel, which estimates biologically plausible cell proportions in whole cord blood samples.
Keywords: Cellular heterogeneity, cord blood, DNA methylation, epidemiology, nucleated red blood cells
Introduction
Most epigenetic association studies to date have used samples from whole tissue for analysis. This typically includes multiple cell types within the tissue. Epigenetic signatures, including DNA methylation (DNAm) profiles, are different by cell types.28 For example, hematopoietic cell differentiation co-occurs with DNAm changes.22 Because most tissues are composed of multiple cell types, cell type relative proportions can confound studies of whole tissue epigenetics2,18, if cell proportion is related to the exposure or outcome under study.
Epidemiologic studies typically use whole blood derived DNAm.18 For large-scale studies the Illumina Infinium HumanMethylation450 BeadChip array (450K) is commonly used to measure CpG methylation at approximately 480,000 CpGs in the genome. Capitalizing on the unique cell type methylation signatures, recent methods have been developed to estimate relative proportions of 6 major blood cell types from whole blood 450K data.17 These cell proportion estimates can then be used as adjustment factors in epigenetic association analyses.27 This method relies on cell type references derived from 6 males (mean age 38 years)30 and has been incredibly useful for adult epigenome-wide association studies (EWAS).20 Adults, however, may not be an appropriate reference group for all situations, particularly for estimating cell proportions in very young individuals. A recent paper found no correlation between cord blood estimated cell counts using the adult reference and microscopic differential cell counts.38 This suggests that cord blood may require a specific reference panel.
Umbilical cord blood is of particular interest for developmental origins of disease studies and represents a unique cell mixture containing nucleated red blood cells (nRBCs) in addition to other blood cell types. Several recent epigenome-wide association studies have interrogated cord blood methylation, but have been restricted to cell proportion estimation based on adult reference signatures.3,9,10,23,24,25,33 Thus, it is important to generate DNAm cell type signatures specific to cord blood cell types and ages to be used for cord blood cell proportion estimation for epigenetic association studies carried out in cord blood.
Here, we have collected and sorted cells from cord blood to create a DNAm cell type cord-blood specific reference panel. Genome-scale DNAm profiles for 7 prominent cord blood cell types (B cells, NK cells, CD4+T, CD8+T, monocytes, granulocytes, and nRBCs) were measured using the Illumina 450K array. We then applied the previously used prediction algorithm17 developed for adult reference data to resolve critical DNAm cell type signatures and estimate cell type proportions from cord blood methylation data. This cord-specific reference panel will be widely useful for birth cohort epidemiologic studies of disease and exposure.
Methods
Sample population and biosample collection
Cord blood samples were collected at Johns Hopkins Hospital (Baltimore, MD) from full term, singleton, vaginal deliveries. Only healthy mothers were included and women with HIV, hepatitis or intrapartum fever were excluded from the study. Deliveries where blood was collected for cord blood banking or for diagnostic purposes were also excluded.
Nurses or physicians who routinely collected sterile cord blood specimens for clinical purposes collected umbilical vein blood in a syringe immediately after birth of the neonate but prior to delivery of the placenta, utilizing a previously reported method.36 The blood was then aseptically transferred from the syringe to 4 EDTA 10-ml tubes. Cord blood samples were immediately refrigerated at 4°C and transported to the Center for Epigenetics within 24 h for analysis.
The samples collected during delivery were from biological material designated as waste and subject consent was not necessary. The Institutional Review Board at Johns Hopkins University approved this study.
Cell isolation and selection
Cord blood samples were processed within 24 h of delivery (Supplementary Fig. 1). A 1mL aliquot of whole cord blood from each collection was saved for DNA extractions. Cord blood mononuclear cells (CBMC) were isolated from whole cord blood via single density gradient separation using Ficoll 1077 and centrifugation at 500x g for 35 min at 20°C. Nucleated RBCs were isolated from whole cord blood via double density gradient separation (Ficoll 1077 and 1119) and centrifugation at 500x g for 35 min at 20°C.13 Granulocytes were processed from whole cord blood using red blood cell lysis solution (Miltenyi Biotech, Teterow, Germany) and washed with 1X PBS.
The OctoMACS system and MACS MicroBeads (Miltenyi Biotech, Teterow, Germany) were used to positively select for cell types of interest according to manufacturers instructions. CBMC aliquots from the single Ficoll separation were used with CD8 microbeads (130-097-057) to select for CD8+T cells; CD4 (130-097-048) for CD4+T cells; CD14 (130-050-201) for monocytes; CD56 (130-097-042) for NK cells; and CD19 (130-097-055) for B cells. Nucleated RBCs were positively selected from the double Ficoll separation product using CD71 microbeads (130-046-201). Granulocytes were positively selected from the lysed whole blood using CD15 microbeads (130-046-601). Cell quantities were estimated using a Countess Automated Cell Counter (Invitrogen, Carlsbad, CA).
Cell type enrichment with magnetic beads was assessed using fluorescence assisted cell sorting (FACS). Using FACS, the above magnetic bead cell sorting protocol resulted in enrichment of 94% granulocytes, 93% monocytes, 85% B cells, 87% NK cells, 96% CD4+T cells, and 93% CD8+T cells.
DNA isolation and methylation assessment
Cell isolate and overlapping whole blood sample DNA was extracted using the QIAgen DNeasy Blood & Tissue Kit (Qiagen, Valencia, CA) according to manufacturers instructions. DNA was quantitated using Quant-iT PicoGreen dsDNA Assay Kit (Invitrogen, Eugene, OR) and samples were normalized to 625 ng in 15 µL. Though isolation for all cell types was carried out on all samples, sufficient genomic DNA was not available from all isolates. In particular, it was difficult to achieve sufficient DNA derived from nRBCs, thus we were only able to proceed with 4 nRBC samples. Future work may be directed to expand these methods and increase the nRBC reference sample size.
Normalized DNA was then bisulfite treated and cleaned using EZ-96 DNA Methylation-Gold kit (Zymo Research, Irvine, CA) and hybridized to the Infinium HumanMethylation450 BeadChip array (Illumina, San Diego, CA). Our primary goal was to assess within individual differences in DNA methylation by cell type. Thus, to reduce the potential for batch effects influencing these comparisons, we grouped all samples derived from the same individual on the same BeadChip during the Infinium assay. Samples were run on 2 plates (Plate 1: samples = 46, individuals = 8 and Plate 2: samples = 58, individuals = 9). The cell type distribution did not differ across the 2 plates (Fisher's exact P = 0.95). All sample processing was performed at the Center for Epigenetics.
Data preprocessing
Raw image IDAT files were processed in R (version 3.1) using the minfi package (version 1.12).1 Samples with overall intensity values less than 10.5 RFU (n = 0) were excluded. Probes were excluded for failing overall detection P-values > 0.01 in 10% of samples (n = 610), cross reactivity (n = 29,233),6 or location on the sex chromosomes (n = 11,648). In addition, probes with potential SNPs in the CpG site (n = 16,998) and SNPs in the single base extension site (n = 7,876) were excluded, as recommended,8 using lists available with the getAnnotation function in the minfi package. The final analysis included data on 429,794 probes and 104 samples (including 15 whole blood, 12 granulocytes, 15 monocytes, 15 B cells, 14 NK cells, 15 CD4+T cells, 14 CD8+T cells, and 4 nRBC cells).
Within-array normalization is performed to address 450K background correction, red/green dye bias, and probe type I/II correction, and it has been noted that at least part of the probe type bias is a combination of the first 2 factors.8 Noob preprocessing35 is a background correction and dye-bias equalization method that has similar within-array normalization effects on the data as probe type correction methods such as BMIQ.34 We used Noob preprocessing on the filtered DNA methylation data, rather than BMIQ because the effect sizes in this cell type analysis are exceptionally large and when comparing methylation results from a study with large effects (EBV transformation vs. normal), which has been split into discovery and replication cohorts, Noob consistently outperforms BMIQ with respect to sensitivity, specificity, and concordance.11
We also opted to omit between-array normalization because such global level measurement adjustments are too aggressive when there is an underlying biology-based global shift in methylation distribution,8 as was observed in this study with nRBCs.
We estimated percent methylation using the β values derived from the preprocessed data. Principal components analysis (PCA) was used to assess potential batch effects, particularly of measured covariates such as plate and array position. We did not detect batch effects by plate or array position and did not include these covariates in downstream analyses (Supplementary Fig. 2).
Comparing cell types in cord and adult blood samples
First, we examined detectible differences between DNAm patterns of each sorted cell type using PCA. We then used F-tests to compare the DNAm amounts across the 6 cell types at each CpG site. We used pairwise t-tests to identify CpG sites that most distinguished each cell type from the rest, and plotted the top 100 per cell type via heatmap to visualize patterns in methylation specific to cord blood cell types with Euclidean distance and Ward clustering function. We used LRpath to determine gene ontology biological processes and transcription factors enriched by cell type.31
Cell-type specific DNAm signatures in cord blood were compared to published adult blood signatures30 via plots of mean methylation at each CpG site per cell type in adults vs. cord. Pearson correlations were computed. Direct correlation of DNAm values has limited usefulness for evaluating sample similarity because DNAm values in blood are highly consistent, thus mean-centered correlations were also reported.37 For each CpG, we first calculated the mean for each cell type across all individuals, and then took the mean across all cell types in both the cord and adult reference sets. Then we subtracted this overall CpG mean from the observed value of the CpG in each sample before calculating the correlation between any 2 arrays.37
Cell type estimation pipeline
Similar to the adult cell estimation pipeline,20 we used results from pair-wise t-tests comparing each cell type to the remaining cell types to select the 100 probes per cell type that achieved a P-value <10−8, and we prioritized those with the greatest absolute values for magnitude of methylation difference. In the Jaffe and Irizarry implementation, 50 probes were selected with the greatest magnitude each of hyper and hypomethylation. We chose to implement this slight probe selection modification because many cell types in cord blood have a dominant direction of effect (>90 % of probes either hyper or hypomethylated). These probes were then used to predict cell type proportions from whole cord blood DNAm data.
The cell type methylation data is available as an RGset on Bioconductor (via the FlowSorted.CordBlood.450K package). We also have adapted the existing estimateCellCounts function in the Bioconductor minfi package, which had previously only contained infrastructure for adult blood and frontal cortex cell proportion estimation. The function now incorporates the same reference data described herein and is able to estimate cord blood cell type proportions using the described pipeline.
We also used the adult reference panel and prediction algorithm to predict the cell composition of the sorted cord samples as a comparison.
Application of methods
We implemented the cord cell reference panel-informed prediction algorithm on whole cord blood DNAm to compare predicted proportions with normal ranges from the literature.12 We first used whole cord blood samples obtained from the same JHU births as the sorted cell populations. We also used cord blood from the Early Autism Risk Longitudinal Investigation (EARLI).29 In addition, we compared cord blood DNAm predicted cell types in the National Children's Study (NCS) Vanguard project.3 The data for EARLI and NCS were obtained directly from investigators. We compared the adult and cord reference-derived mean estimates in each population. We also compared the cord and adult reference estimates within each cell type, across the 3 populations and calculated the Pearson's correlation.
Results
Fresh cord blood samples were collected from 17 prospective convenience births at the Johns Hopkins Hospital. Babies were full term and approximately equal numbers of males and females (Table 1).
Table 1.
Study population characteristics (n = 17).
| Covariate | Mean (SD) |
|---|---|
| Gestational age (weeks) | 39.9 (1.0) |
| Birth weight (g) | 3,556.5 (362.7) |
| Head circumference (cm) | 33.7 (1.3) |
| Birth length (cm) | 51.4 (2.0) |
| Sex N(%) | |
| Male | 8 (47.1) |
| Female | 9 (52.9) |
| Cell type N | |
| Whole blood | 15 |
| B cell | 15 |
| CD4T | 15 |
| CD8T | 14 |
| Granulocyte | 12 |
| Monocyte | 15 |
| NK | 14 |
| nRBC | 4 |
The overall methylation profiles (frequency of probes by methylation value) of granulocytes, monocytes, CD4+T, CD8+T, and NK cells were similar to each other (Fig. 1). These cell types had a large number of unmethylated sites and a smaller number of highly methylated sites, while nRBCs had a different distribution with more hemi-methylated sites. Using PCA, the samples grouped by cell type rather than individual, with nRBCs as the most distinct (Fig. 2). Clustering by cell type is further illustrated in a heatmap of the 100 CpG sites most distinguishing each cell type (Supplementary Fig. 3).
Figure 1.

Density plot by cell types.
Figure 2.

Principal components analysis on cord blood cell type methylation.
Mean centered DNAm was highly correlated between adult30 and cord data within a cell type for monocytes (r = 0.74) and granulocytes (r = 0.74), moderately correlated for B cells (r = 0.24) and CD4+T (r = 0.37), and uncorrelated for CD8+T (r = 0.08) and NK cells (r = 0.08) (Fig. 3). As expected, Pearson's correlation between adult and cord direct DNAm across all sites for each cell type was high (minimum r = 0.98) (Supplementary Fig. 4). Cord blood had 211,849 sites that distinguish at least one cell type (P < 10−8) (Supplementary Fig. 5). This represented 49.2% of analyzed sites overall, although the subset distinguishing any particular cell types was 0.3-2.3% with the exception of nucleated RBCs. The minimum P value distinguishing cord cell types was 7×10−101. Nucleated RBCs have the greatest number of distinct methylation sites in cord blood (n = 158,745), representing 36.9% of CpG sites, with 99.5% of these hypomethylated relative to other cell types (Fig. 4). These sites were associated with genes that were enriched for metabolism and sensory biological processes (Fig. 5) and associated with the transcription factors E2F2 and EGR1 (Supplementary Fig. 6). Granulocytes and monocytes had large numbers of sites reaching P < 10−8 (Ngranulocytes = 8,299; Nmonocytes = 7,367). The significant sites for both were largely hypomethylated relative to other cell types (granulocytes: 93.0%; monocytes: 92.2%) and these patterns were consistent with adult cells (granulocytes: 98.4%; monocytes: 96.6%). The number of sites distinguishing NK cells, CD4+ T, and B cells were also relatively high (NNKcells = 7,324; NCD4+T = 9,827; NBcells = 6,274). These cell types had sites with both hypo and hypermethylation relative to the other cell types (Hypomethylation: NK cells: 68.5%; CD4+ T cells: 40.4%; B cells: 58.6%) and these proportions were somewhat lower than adult cells (NK cells: 88.1%; CD4+ T cells: 51.1%; B cells: 72.0%). Finally, CD8+ T cells had few sites reach genome-wide significance (n = 1,464), and these sites tended to by hypermethylated relative to other cell types in both cord (66.6%) and adult blood (69.7%).
Figure 3.

Correlation between mean centered adult and cord DNA methylation by cell type. Adult data is derived from (30).
Figure 4.

Overlapping histograms of differential methylation magnitude for adult and cord cell types (P-value <10−8). Adult data is derived from (30)
Figure 5.
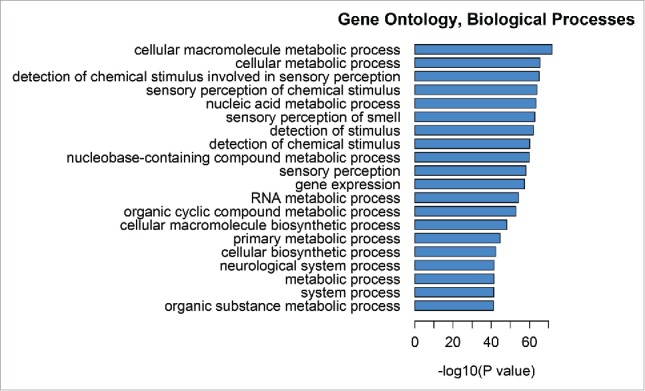
Gene ontology, biological processes enriched in genes mapping to differentially methylated positions for nRBCs.
We first applied the cell type proportion prediction algorithm, based on adult reference data, to sorted cord blood DNAm data. All of the common 6 cell types were predicted to be primarily the expected cell type (Fig. 6). The percent accurately predicted in cord cell types using the adult reference panel ranged from 97.7% in granulocytes to 48.1% in CD8+ T cells. The adult panel did not perform well for nRBCs, predicting nRBCs to be approximately equal parts of each of the 6 other cell types, which summed to an impossible 119%.
Figure 6.

Estimated cell proportions using the adult cell reference panel and algorithm on isolated cord cell samples.
We then applied the prediction algorithm on existing whole cord blood 450K samples, using either the previous adult reference panel or the newly generated cord blood reference panel. We observed mean population cell type proportions that were different depending on whether the adult or child reference data were used (Supplementary Fig. 7), and that were generally consistent with the literature for cord cell type distribution. The adult reference panel failed to estimate any nRBCs. Relative to the cord reference, the adult reference panel overestimated granulocytes, NK cells and B cells, while underestimating CD8+T cells. Without a validation dataset with directly measured cell counts, we cannot conclude that the cord reference generated more accurate estimates, but we do observe that the cell counts estimated depends on the age-specific reference panel used, particularly for CD8+ T cells (r = 0.6), NK cells (r = 0.76), and B cells (r = 0.82) (Fig. 7). Estimates of granulocytes were highly correlated between the cord and adult reference (rgran = 0.98; rmono = 0.91; rCD4+T = 0.97) (Fig. 7).
Figure 7.
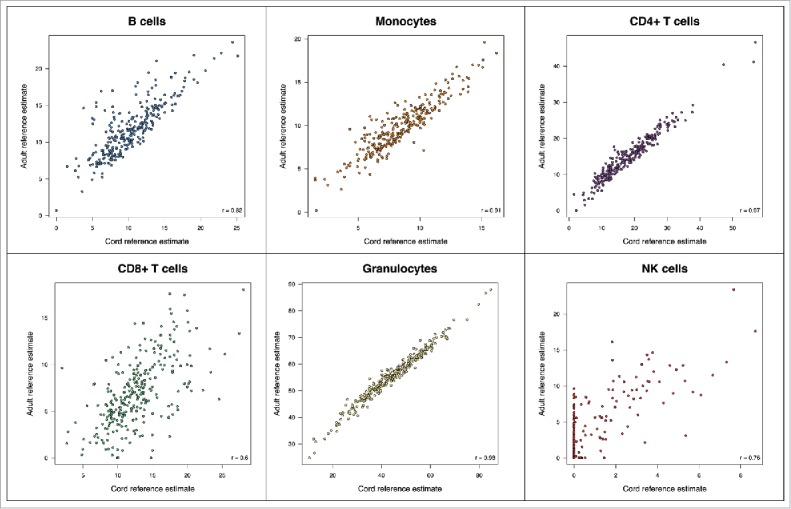
Estimated cell proportions using the adult cell reference panel with default processing vs. the cord reference panel with updated processing across 3 data sets.
Discussion
We generated DNAm profiles for 7 umbilical cord blood cell types (nRBCs, CD4+ T cells, CD8+ T cells, NK cells, B cells, granulocytes, and monocytes) using the 450K array. Approximately half of all probes assayed on the 450K array showed differences in methylation across at least one of these cell types at P < 10−8, with a much greater total number of CpGs distinguishing nRBCs than the other 6 cell types; the methylation pattern of nRBCs is distinct and hypomethylated relative to the other types. Methylation of the remaining 6 cell types is variably correlated with the respective adult cell reference panel; granulocytes and monocytes have mean centered correlation >0.7, while CD8+ T cells and NK cells had mean centered correlation values of 0.08. We estimated cell counts in whole cord blood DNAm data using the new cord blood reference panel and show differences in predicted proportions compared to those predicted from the adult reference panel, particularly for nRBCs, CD8+ T cells, and NK cells. Given these results, it is crucial that studies estimating cord cell proportions from whole cord blood DNAm data account for these key differences by using a methylation reference panel derived from cord blood rather than adult whole blood.
For all cell types examined except nRBCs, the DNAm cell type profiles in cord blood were compared with the overlapping adult cell type profiles, and the number of CpG sites associated with any cell type differs between cord and adult results. Cord blood had 211,849 sites that distinguished at least one cell type (P < 10−8), while previously published adult blood had only 37,837 sites.30 The minimum P-value distinguishing cord cell types was 7×10−101, while adult cell types was 1×10−43. It is important to note that the adult study used only 6 samples per cell type, relative to this cord study with up to 15 samples per cell type. Thus, some of these differences in absolute count of statistically significant CpGs are likely due to relative power between the data sets. Nevertheless, it is possible that the increased cell type signal in cord blood is in large part driven by the extreme methylation differences observed in nRBCs, which is only available in cord blood.
The scale of epigenetic differences observed in nRBCs is particularly provocative considering the short developmental time window of nRBCs present in newborn blood and the epidemiologic evidence for nRBC concentration at birth as a risk factor for future disease. Increased concentration of nRBCs at birth can reflect acute stress, prematurity, or chronic conditions of the mother such as diabetes.26 Elevated concentrations can also be predictive of neonatal performance Gasparovic et al.14 or future conditions of the child including poor neurodevelopment.5 Concentration of nRBC in fetal blood peaks shortly after birth and steadily declines to zero within the first week of life.4 New production of nRBCs is stopped by regulation of erythropoietin at the transcriptional level by attenuated inhibition from hypoxia inducible transcription factors (HIFs).21 The non-classic apoptosis of existing nRBCs is believed to be also associated with oxygen concentrations.19,26 In addition, there is a major switch in use between fetal hemoglobin to adult hemoglobin.15 Perhaps the unique methylation signature we observed in nRBCs is related to these necessary switches in gene activation and inactivation. Unlike the other cell types in our data, nucleated RBCs appear to exhibit partially methylated domains (PMDs), consistent with what has been observed in placenta,32 even though nRBCs are usually absent or present in very small numbers in placenta at birth.16 Particularly in studies where placenta tissue is not available, nRBCs may be an interesting and relevant surrogate of developmentally labile methylation.
The expected cord blood cell proportions presented in this paper based on literature reports were from direct measurement by.12 In 161 cord blood samples from 37 weeks gestation in France, granulocytes ranged from 41.8-68.2% of total cells, monocytes were 8.0-10.1% of cells, B cells were 4.5-7.8% of cells, NK cells were 2.3-7.8%, and a combined T cell group was 20.5-23.5% of cells. Using the new cord blood algorithm, we predicted cell type proportions consistent with these observations in 3 different data sets. The current study would have been strengthened by a validation data set containing both direct measurement of cell counts as well as predicted counts from 450K data. Unfortunately, an appropriate validation set could not be identified at the time of our study; hopefully, future studies will be able to test the performance of our model.
Cell sorting methods can also potentially influence these results. Options include manual microscopic cell counting, flow cytometry (FACs), and magnetic bead sorting (used here). Previous studies show a strong correlation between flow cytometry based counts and microscope based cell counts for neutrophils, lymphocytes, and eosinophils, but poor correlation for basophils and monocytes.12 The current widely-used adult cell type methylation reference panel was based on magnetic bead sorting.30 In this study, we chose magnetic bead sorting with a FACs quality confirmation to be consistent with the adult model in addition to throughput considerations. A recent study observed that nucleated RBCs interact with monocytes, T cells, and B cells during FACs, resulting in cross-contamination.7 It is also possible that our study had a small degree of co-separation of cells, but this would have been limited by our double density separation gradient that preceded the bead sorting.
A recent publication used 2 different FACs pipelines to sort cord blood CD4+ T cells, nRBCs,7 and monocytes and observed 450K-based DNAm profiles cluster by haematopoietic lineage. Similar to results from their more stringent FACs, we observed large methylation differences at the 8 nRBC sites they highlighted (cg05012676, cg06768361, cg10018933, cg15974642, cg18168751, cg20555305, cg25105522, cg26876834). Methylation at these 8 sites in nRBCs ranged from 22.4–43.5% (mean 36.6) in their data and 5.7–31.3% (mean 14.6) in our data. The other cell types were hypermethylated, with mean values ranging from 87.2-95.1% (mean 91.4) in their data and 90.9-97.5% (mean 94.7) in our data. Thus, methylation values generated using a different method of cell sorting produced comparable methylation signatures.
This new cord blood sorted cell type DNAm reference panel and cord blood cell proportion estimation algorithm may be widely adopted in birth cohort epigenome-wide association studies. It is very common for DNAm signals observed with exposure or disease to be confounded by cell proportions.18 We have shown that matching the reference panel used for cell proportion estimation to the age (birth versus adult) of the study sample can affect cell proportion estimates, particularly for certain cell types. Cord blood has a unique cell type, nucleated red blood cells, that have an extreme methylation profile and previous studies were unable to account for the heterogeneity in DNAm resulting from differences in the proportion of this cell type. Use of inappropriate cell proportion estimates to adjust for confounding may result in residual confounding for studies with a reference panel mismatch. This underscores the particularly critical need to adjust for cell type proportions in cord samples using an appropriate reference panel. For the first time, cell proportions can be routinely estimated in cord blood DNAm studies.
Supplementary Material
Disclosure of potential conflicts of interest
No potential conflicts of interest were disclosed.
References
- 1.Aryee MJ, Jaffe AE, Corrada-Bravo H, Ladd-Acosta C, Feinberg AP, Hansen KD, Irizarry RA. Minfi: A flexible and comprehensive bioconductor package for the analysis of infinium DNA methylation microarrays. Bioinformatics 2014; 30:1363-1369; PMID:24478339; http://dx.doi.org/ 10.1093/bioinformatics/btu049 [DOI] [PMC free article] [PubMed] [Google Scholar]
- 2.Bakulski KM, Fallin MD. Epigenetic epidemiology: Promises for public health research. Environmental and molecular mutagenesis 2014; 55:171-183; PMID:24449392; http://dx.doi.org/ 10.1002/em.21850 [DOI] [PMC free article] [PubMed] [Google Scholar]
- 3.Bakulski KM, Lee H, Feinberg JI, Wells EM, Brown S, Herbstman JB, Witter FR, Halden RU, Caldwell K, Mortensen ME, et al.. Prenatal mercury concentration is associated with changes in DNA methylation at tceanc2 in newborns. Int J Epidemiol 2015; 44:1249-1262; PMID:25906783; http://dx.doi.org/ 10.1093/ije/dyv032 [DOI] [PMC free article] [PubMed] [Google Scholar]
- 4.Baschat AA, Gungor S, Kush ML, Berg C, Gembruch U, Harman CR. Nucleated red blood cell counts in the first week of life: A critical appraisal of relationships with perinatal outcome in preterm growth-restricted neonates. Am J Obstet Gynecol 2007; 197:286 e281-288; PMID:17826423; http://dx.doi.org/10.1016/j.ajog.2007.06.02010601935 [DOI] [PubMed] [Google Scholar]
- 5.Buonocore G, Perrone S, Gioia D, Gatti MG, Massafra C, Agosta R, Bracci R. Nucleated red blood cell count at birth as an index of perinatal brain damage. Am J Obstet Gynecol 1999; 181:1500-1505; PMID:10601935; http://dx.doi.org/ 10.1016/S0002-9378(99)70396-0 [DOI] [PubMed] [Google Scholar]
- 6.Chen YA, Lemire M, Choufani S, Butcher DT, Grafodatskaya D, Zanke BW, Gallinger S, Hudson TJ, Weksberg R. Discovery of cross-reactive probes and polymorphic cpgs in the illumina infinium humanmethylation450 microarray. Epigenetics 2013; 8:203-209; PMID:23314698; http://dx.doi.org/ 10.4161/epi.23470 [DOI] [PMC free article] [PubMed] [Google Scholar]
- 7.de Goede OM, Razzaghian HR, Price EM, Jones MJ, Kobor MS, Robinson WP, Lavoie PM. Nucleated red blood cells impact DNA methylation and expression analyses of cord blood hematopoietic cells. Clin Epigenetics 2015; 7:95; PMID:26366232; http://dx.doi.org/ 10.1186/s13148-015-0129-6 [DOI] [PMC free article] [PubMed] [Google Scholar]
- 8.Dedeurwaerder S, Defrance M, Bizet M, Calonne E, Bontempi G, Fuks F. A comprehensive overview of infinium humanmethylation450 data processing. Brief Bioinform 2014; 15:929-941; PMID:23990268; http://dx.doi.org/ 10.1093/bib/bbt054 [DOI] [PMC free article] [PubMed] [Google Scholar]
- 9.Engel SM, Joubert BR, Wu MC, Olshan AF, Haberg SE, Ueland PM, Nystad W, Nilsen RM, Vollset SE, Peddada SD, et al.. Neonatal genome-wide methylation patterns in relation to birth weight in the norwegian mother and child cohort. Am J Epidemiol 2014; 179:834-842; PMID:24561991; http://dx.doi.org/ 10.1093/aje/kwt433 [DOI] [PMC free article] [PubMed] [Google Scholar]
- 10.Finer S, Mathews C, Lowe R, Smart M, Hillman S, Foo L, Sinha A, Williams D, Rakyan VK, Hitman GA. Maternal gestational diabetes is associated with genome-wide DNA methylation variation in placenta and cord blood of exposed offspring. Hum Mol Genet 2015; 24:3021-3029; PMID:25634562; http://dx.doi.org/ 10.1093/hmg/ddv013 [DOI] [PubMed] [Google Scholar]
- 11.Fortin JP, Labbe A, Lemire M, Zanke BW, Hudson TJ, Fertig EJ, Greenwood CM, Hansen KD. Functional normalization of 450k methylation array data improves replication in large cancer studies. Genome Biol 2014; 15:503; PMID:25599564; http://dx.doi.org/ 10.1186/s13059-014-0503-2 [DOI] [PMC free article] [PubMed] [Google Scholar]
- 12.Gac F, Thibert JB, Le Berre C, Le Priol J, Semana G, Fest T, Roussel M. Evaluation of cytodiff on cord blood wbc differential. Int J Lab Hematol 2013; 35:46-54; PMID:22862853; http://dx.doi.org/ 10.1111/j.1751-553X.2012.01460.x [DOI] [PubMed] [Google Scholar]
- 13.Ganshirt D, Smeets FW, Dohr A, Walde C, Steen I, Lapucci C, Falcinelli C, Sant R, Velasco M, Garritsen HS, et al.. Enrichment of fetal nucleated red blood cells from the maternal circulation for prenatal diagnosis: Experiences with triple density gradient and macs based on more than 600 cases. Fetal Diagn Ther 1998; 13:276-286; PMID:9813420; http://dx.doi.org/ 10.1159/000020854 [DOI] [PubMed] [Google Scholar]
- 14.Gasparovic VE, Ahmetasevic SG, Colic A. Nucleated red blood cells count as first prognostic marker for adverse neonatal outcome in severe preeclamptic pregnancies. Coll Antropol 2012; 36:853-857; PMID:23213944 [PubMed] [Google Scholar]
- 15.Groudine M, Kohwi-Shigematsu T, Gelinas R, Stamatoyannopoulos G, Papayannopoulou T. Human fetal to adult hemoglobin switching: Changes in chromatin structure of the beta-globin gene locus. Proceedings of the National Academy of Sciences of the United States of America 1983; 80:7551-7555; PMID:6200877; http://dx.doi.org/ 10.1073/pnas.80.24.7551 [DOI] [PMC free article] [PubMed] [Google Scholar]
- 16.Hermansen MC. Nucleated red blood cells in the fetus and newborn. Arch Dis Child Fetal Neonatal Ed 2001; 84:F211-215; PMID:11320052; http://dx.doi.org/ 10.1136/fn.84.3.F211 [DOI] [PMC free article] [PubMed] [Google Scholar]
- 17.Houseman EA, Accomando WP, Koestler DC, Christensen BC, Marsit CJ, Nelson HH, Wiencke JK, Kelsey KT. DNA methylation arrays as surrogate measures of cell mixture distribution. BMC Bioinformatics 2012; 13:86; PMID:22568884; http://dx.doi.org/ 10.1186/1471-2105-13-86 [DOI] [PMC free article] [PubMed] [Google Scholar]
- 18.Houseman EA, Kim S, Kelsey KT, Wiencke JK. DNA methylation in whole blood: Uses and challenges. Curr Environ Health Rep 2015; 2:145-154; PMID:26231364; http://dx.doi.org/ 10.1007/s40572-015-0050-3 [DOI] [PubMed] [Google Scholar]
- 19.Hristoskova S, Holzgreve W, Hahn S. Fetal nucleated erythrocytes in maternal circulation do not display a classic membrane-associated apoptotic characteristic (phosphatidylserine exposure) despite being positive by terminal dutp nuclear end labeling. Clin Chem 2003; 49:1934-1937; PMID:14578328; http://dx.doi.org/ 10.1373/clinchem.2003.023242 [DOI] [PubMed] [Google Scholar]
- 20.Jaffe AE, Irizarry RA. Accounting for cellular heterogeneity is critical in epigenome-wide association studies. Genome Biol 2014; 15:R31; PMID:24495553; http://dx.doi.org/ 10.1186/gb-2014-15-2-r31 [DOI] [PMC free article] [PubMed] [Google Scholar]
- 21.Jelkmann W. Regulation of erythropoietin production. J Physiol 2011; 589:1251-1258; PMID:21078592; http://dx.doi.org/ 10.1113/jphysiol.2010.195057 [DOI] [PMC free article] [PubMed] [Google Scholar]
- 22.Ji H, Ehrlich LI, Seita J, Murakami P, Doi A, Lindau P, Lee H, Aryee MJ, Irizarry RA, Kim K, et al.. Comprehensive methylome map of lineage commitment from haematopoietic progenitors. Nature 2010; 467:338-342; PMID:20720541; http://dx.doi.org/ 10.1038/nature09367 [DOI] [PMC free article] [PubMed] [Google Scholar]
- 23.Joubert BR, Haberg SE, Bell DA, Nilsen RM, Vollset SE, Midttun O, Ueland PM, Wu MC, Nystad W, Peddada SD, et al.. Maternal smoking and DNA methylation in newborns: In utero effect or epigenetic inheritance? Cancer Epidemiol Biomarkers Prev 2014; 23:1007-1017; PMID:24740201; http://dx.doi.org/ 10.1158/1055-9965.EPI-13-1256 [DOI] [PMC free article] [PubMed] [Google Scholar]
- 24.Kile ML, Houseman EA, Baccarelli AA, Quamruzzaman Q, Rahman M, Mostofa G, Cardenas A, Wright RO, Christiani DC. Effect of prenatal arsenic exposure on DNA methylation and leukocyte subpopulations in cord blood. Epigenetics 2014; 9:774-782; PMID:24525453; http://dx.doi.org/ 10.4161/epi.28153 [DOI] [PMC free article] [PubMed] [Google Scholar]
- 25.Koestler DC, Avissar-Whiting M, Houseman EA, Karagas MR, Marsit CJ. Differential DNA methylation in umbilical cord blood of infants exposed to low levels of arsenic in utero. Environ Health Perspect 2013; 121:971-977; PMID:23757598; http://dx.doi.org/ 10.1289/ehp.1205925 [DOI] [PMC free article] [PubMed] [Google Scholar]
- 26.Kondo T, Sekizawa A, Saito H, Jimbo M, Sugito Y, Okai T. Fate of fetal nucleated erythrocytes circulating in maternal blood: Apoptosis is induced by maternal oxygen concentration. Clin Chem 2002; 48:1618-1620; PMID:12194953 [PubMed] [Google Scholar]
- 27.Liu Y, Aryee MJ, Padyukov L, Fallin MD, Hesselberg E, Runarsson A, Reinius L, Acevedo N, Taub M, Ronninger M, et al.. Epigenome-wide association data implicate DNA methylation as an intermediary of genetic risk in rheumatoid arthritis. Nat Biotechnol 2013; 31:142-147; PMID:23334450; http://dx.doi.org/ 10.1038/nbt.2487 [DOI] [PMC free article] [PubMed] [Google Scholar]
- 28.Meissner A, Mikkelsen TS, Gu H, Wernig M, Hanna J, Sivachenko A, Zhang X, Bernstein BE, Nusbaum C, Jaffe DB, et al.. Genome-scale DNA methylation maps of pluripotent and differentiated cells. Nature 2008; 454:766-770; PMID:18600261; http://dx.doi.org/10.1038/nature07107 [DOI] [PMC free article] [PubMed] [Google Scholar]
- 29.Newschaffer CJ, Croen LA, Fallin MD, Hertz-Picciotto I, Nguyen DV, Lee NL, Berry CA, Farzadegan H, Hess HN, Landa RJ, et al.. Infant siblings and the investigation of autism risk factors. J Neurodev Disord 2012; 4:7; PMID:22958474; http://dx.doi.org/ 10.1186/1866-1955-4-7 [DOI] [PMC free article] [PubMed] [Google Scholar]
- 30.Reinius LE, Acevedo N, Joerink M, Pershagen G, Dahlen SE, Greco D, Söderhäll C, Scheynius A, Kere J. Differential DNA methylation in purified human blood cells: Implications for cell lineage and studies on disease susceptibility. PLoS One 2012; 7:e41361; ; PMID:22848472; http://dx.doi.org/10.1371/journal.pone.004136119038984 [DOI] [PMC free article] [PubMed] [Google Scholar]
- 31.Sartor MA, Leikauf GD, Medvedovic M. Lrpath: A logistic regression approach for identifying enriched biological groups in gene expression data. Bioinformatics 2009; 25:211-217; PMID:19038984; http://dx.doi.org/ 10.1093/bioinformatics/btn592 [DOI] [PMC free article] [PubMed] [Google Scholar]
- 32.Schroeder DI, Blair JD, Lott P, Yu HO, Hong D, Crary F, Ashwood P, Walker C, Korf I, Robinson WP, et al.. The human placenta methylome. Proceedings of the National Academy of Sciences of the United States of America 2013; 110:6037-6042; PMID:23530188; http://dx.doi.org/10.1073/pnas.121514511025855720 [DOI] [PMC free article] [PubMed] [Google Scholar]
- 33.Sharp GC, Lawlor DA, Richmond RC, Fraser A, Simpkin A, Suderman M, Shihab HA, Lyttleton O, McArdle W, Ring SM, et al.. Maternal pre-pregnancy bmi and gestational weight gain, offspring DNA methylation and later offspring adiposity: Findings from the avon longitudinal study of parents and children. Int J Epidemiol 2015; 44:1288-1304; PMID:25855720; http://dx.doi.org/ 10.1093/ije/dyv042 [DOI] [PMC free article] [PubMed] [Google Scholar]
- 34.Teschendorff AE, Marabita F, Lechner M, Bartlett T, Tegner J, Gomez-Cabrero D, Beck S. A beta-mixture quantile normalization method for correcting probe design bias in illumina infinium 450 k DNA methylation data. Bioinformatics 2013; 29:189-196; PMID:23175756; http://dx.doi.org/ 10.1093/bioinformatics/bts680 [DOI] [PMC free article] [PubMed] [Google Scholar]
- 35.Triche TJ Jr., Weisenberger DJ, Van Den Berg D, Laird PW, Siegmund KD. Low-level processing of illumina infinium DNA methylation beadarrays. Nucleic Acids Res 2013; 41:e90; PMID:23476028; http://dx.doi.org/ 10.1093/nar/gkt090 [DOI] [PMC free article] [PubMed] [Google Scholar]
- 36.Witter FR, Ten Broeck J, Fox HE. A new device for safer collection of postpartum cord blood. Int J Gynaecol Obstet 2001; 72:259-260; PMID:11226447; http://dx.doi.org/ 10.1016/S0020-7292(00)00356-8 [DOI] [PubMed] [Google Scholar]
- 37.Xu Z, Niu L, Li L, Taylor JA. Enmix: A novel background correction method for illumina humanmethylation450 beadchip. Nucleic Acids Res 2016; 44:e20; PMID:26384415; http://dx.doi.org/ 10.1093/nar/gkv907 [DOI] [PMC free article] [PubMed] [Google Scholar]
- 38.Yousefi P, Huen K, Quach H, Motwani G, Hubbard A, Eskenazi B, et al.. Estimation of blood cellular heterogeneity in newborns and children for epigenome-wide association studies. Environ Mol Mutagen 2015; 56:751-758; PMID:26332589; http://dx.doi.org/ 10.1002/em.21966 [DOI] [PMC free article] [PubMed] [Google Scholar]
Associated Data
This section collects any data citations, data availability statements, or supplementary materials included in this article.