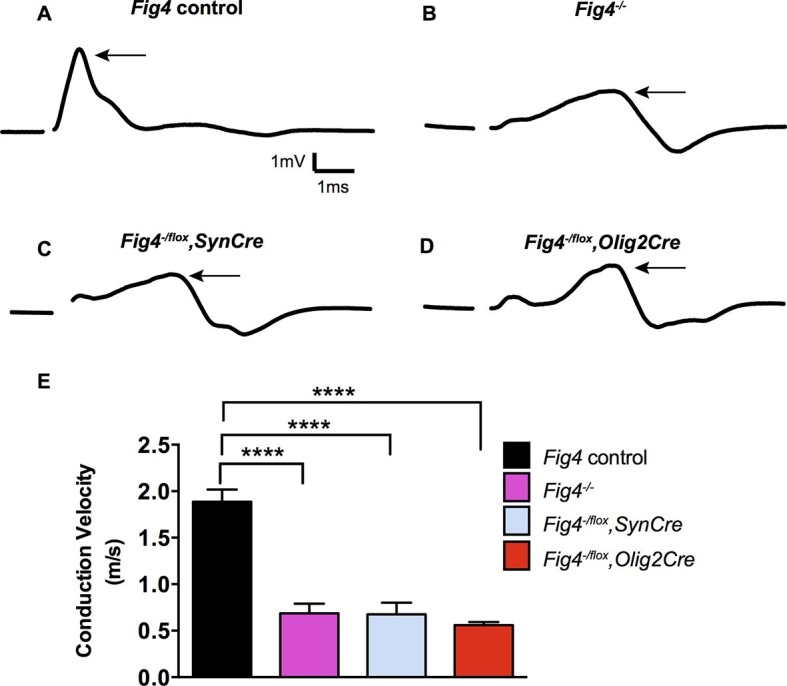
Figure 3. Conditional ablation of Fig4 in neurons or OLs leads to impaired conduction of electrical impulses in the optic nerve.

Compound action potential (CAP) recordings from acutely isolated optic nerves of P21 mice. (A) Representative CAP traces recorded from Fig4 control mice, harboring at least one Fig4 WT allele (n = 14 nerves), (B) Fig4-/- mice (n = 5 nerves), (C) Fig4-/flox,SynCre mice (n = 11 nerves) and (D) Fig4-/flox,Olig2Cre mice (n = 9 nerves). For each graph, the arrow indicates the largest amplitude peak, as identified by Gaussian fit. (E) Quantification of average conduction velocity of largest amplitude peaks identified in A-D. Results are shown as mean value ± SEM, one-way ANOVA with multiple comparisons, Dunnett posthoc, ****p<0.0001.
