Abstract
Understanding how dynamical and aerosol inputs affect the temporal variability of hydrometeor formation in climate models will help to explain sources of model diversity in cloud forcing, to provide robust comparisons with data, and, ultimately, to reduce the uncertainty in estimates of the aerosol indirect effect. This variability attribution can be done at various spatial and temporal resolutions with metrics derived from online adjoint sensitivities of droplet and crystal number to relevant inputs. Such metrics are defined and calculated from simulations using the NASA Goddard Earth Observing System Model, Version 5 (GEOS-5) and the National Center for Atmospheric Research Community Atmosphere Model Version 5.1 (CAM5.1). Input updraft velocity fluctuations can explain as much as 48% of temporal variability in output ice crystal number and 61% in droplet number in GEOS-5 and up to 89% of temporal variability in output ice crystal number in CAM5.1. In both models, this vertical velocity attribution depends strongly on altitude. Despite its importance for hydrometeor formation, simulated vertical velocity distributions are rarely evaluated against observations due to the sparsity of relevant data. Coordinated effort by the atmospheric community to develop more consistent, observationally based updraft treatments will help to close this knowledge gap.
Keywords: global models, clouds, vertical velocity, sensitivity, attribution
Cloud radiative forcing remains one of the largest sources of uncertainty in the overall terrestrial radiative budget (1). In-cloud phase partitioning, or the fraction of liquid versus ice hydrometeors, can be as important as cloud cover in the calculation of cloud radiative forcing (2). Cloud long-wave emissivity depends on cloud water path and hydrometeor sizes, along with cloud height and temperature. Cloud short-wave albedo also depends on particle size, because more and smaller hydrometeors yield a higher optical depth for the same water path (1). Global climate models (GCMs) predict a diversity of liquid and ice water paths (3), as well as cloud hydrometeor sizes, and the treatment of initial hydrometeor formation, i.e., droplet activation or ice nucleation, contributes to this spread for all cloud types (4, 5).
The available supersaturation of a cloudy air parcel determines how many hydrometeors can form therein. Supersaturation strongly depends on aerosol and dynamical parameters. Updraft, or vertical velocity, is especially important because it is the driver of supersaturation generation, owing to the induced expansion cooling during air mass ascent. Aerosol particle surfaces upon which vapor can condense or deposit, called cloud condensation nuclei (CCN) or ice nucleating particles (INP), respectively, act as a sink of supersaturation. The balance between supersaturation generation and loss eventually determines the number of hydrometeors that form in the cloud. As part of the increasing trend to track both cloud hydrometeor mass and number density in GCM cloud modules (6–9), most state of the art GCMs incorporate sophisticated parameterizations that explicitly link hydrometeor formation to aerosol and updraft velocity (1).
Many studies to date have looked at the effect of various droplet activation or ice nucleation parameterizations within GCMs (e.g., refs. 10–14). The focus tends to be uncertainty analysis, or how uncertain parameters affect the cloud hydrometeor number and cloud radiative forcing. However, considerably less effort has been devoted to attributing the temporal variability of modeled hydrometeor number to the inputs that affect them, an analysis that depends both on the sensitivity to each input and the variance of those inputs. In this kind of attribution analysis, it is also important to understand whether an input’s influence is amplified or dampened by the inherent model sensitivity. Understanding what drives this hydrometeor variability and the anthropogenic component thereof carries important implications for cloud forcing, changes in precipitation, and climate sensitivity to emissions.
In this study, we decompose the sources of cloud hydrometeor variability by considering how the supersaturation balance is modulated over time by aerosol parameters and vertical velocity. A special focus is given to vertical velocity, as it is a poorly constrained but key parameter for hydrometeor formation (15–17). We perform attribution analysis within two GCMs to understand which inputs contribute most to temporal variability in droplet and ice crystal number formation and, thereafter, the ability of observations to better constrain these predictions. Previous work has shown the impact of spatial scales and aggregation on the cloud albedo effect (18). Here we consider the impact of temporal scales on hydrometeor formation, by performing the attribution analysis at different model time steps and output resolutions.
Simulations
Two attribution metrics are defined here with adjoint sensitivities and input variances. First, the temporal attribution, , is given in Eq. 1 and represents the fraction of temporal variability in either droplet or ice crystal number, Y, which is explained by the variability in an input, . For droplets, the temporal attribution includes vertical velocity and organic, sulfate, sea salt, and black carbon aerosol numbers and hygroscopicities. For ice crystals, it includes vertical velocity and dust, sulfate, and black carbon aerosol numbers.
The second metric, temporal attribution fraction, , is given in Eq. 2 and expresses whether model sensitivity amplifies, i.e., 1, or dampens, i.e., 1, the temporal variability of in that of hydrometeor number Y. Robustness of these metrics to temporal averaging and integration time step (see Supporting Information) make them particularly useful.
Four simulations with the NASA Global Modeling and Assimilation Office Goddard Earth Observing Model, Version 5 (GEOS-5) are analyzed with the attribution metrics: two month-long runs with daily output and different integration time steps (DEF-G and DEF-G2, denoting default GEOS-5 simulations) and two month-long runs with hourly output, one in Northern Hemisphere (NH) winter (HITEMP-1, denoting a simulation with higher temporal resolution) and the other in NH summer (HITEMP-2). The HITEMP versus DEF simulations consider the effect of temporal averaging on each attribution metric, and HITEMP-1 versus HITEMP-2 considers their seasonality. A simulation (DEF-C, denoting default CAM-5 simulation) with the National Center for Atmospheric Research Community Atmosphere Model, Version 5.1 (CAM5.1) is used to compare the results between GCMs. Droplet number variability within this framework has also been considered by Morales-Betancourt and Nenes (19). Simulations with both models are extended to a full year (DEF-Gyr and DEF-Cyr) to see how metrics change with simulation length. The emissions and conditions for each simulation are described in Materials and Methods.
Analysis of attribution metrics is centered at the 875-hPa (277.5 10.9 K) level for cloud droplets and the 350-hPa (236.7 11.9 K) level for ice crystals, based on where median cloud fraction for warm stratiform and cirrus clouds is highest. Analysis is also carried out for adjacent pressure levels (at 825 hPa and 925 hPa for stratiform and at 250 hPa and 450 hPa for cirrus clouds), as limits that bound 75% of the altitudinal distribution in median droplet or ice crystal number. The metrics are calculated only for instances in which new hydrometeor formation is nonnegligible, i.e., 1 cm−3 and 1 L−1.
Attribution Grids
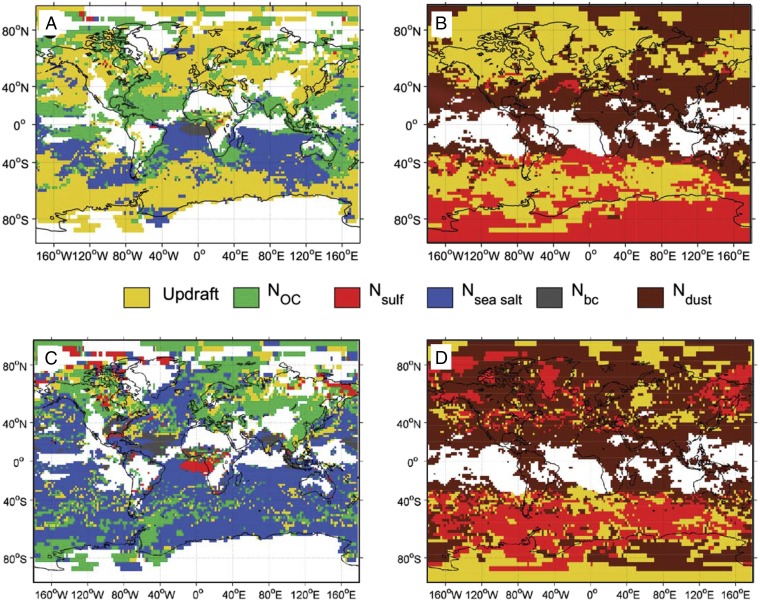
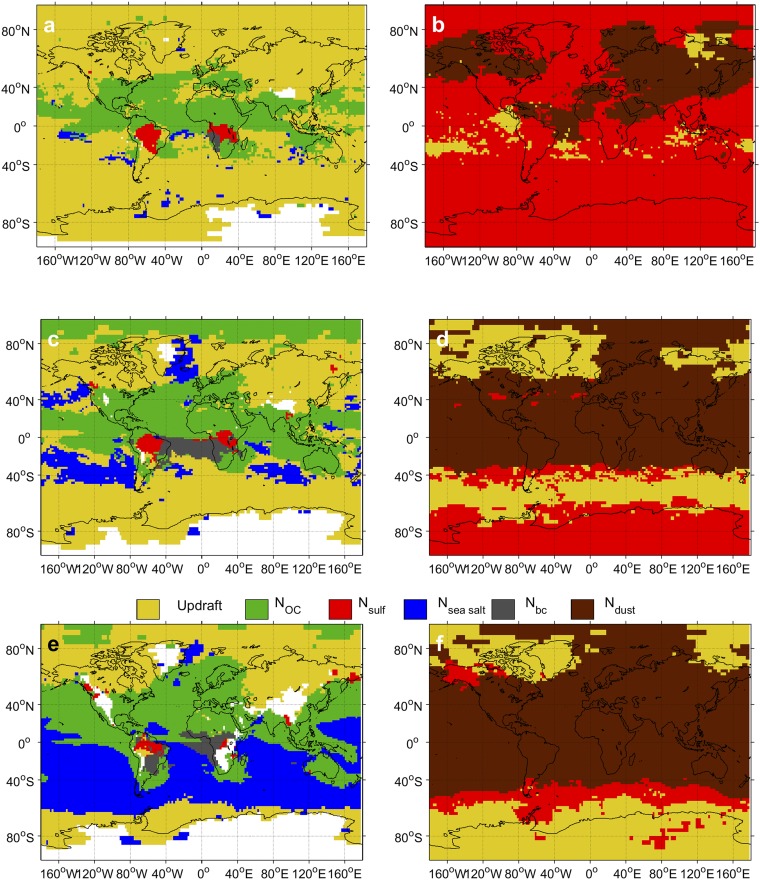
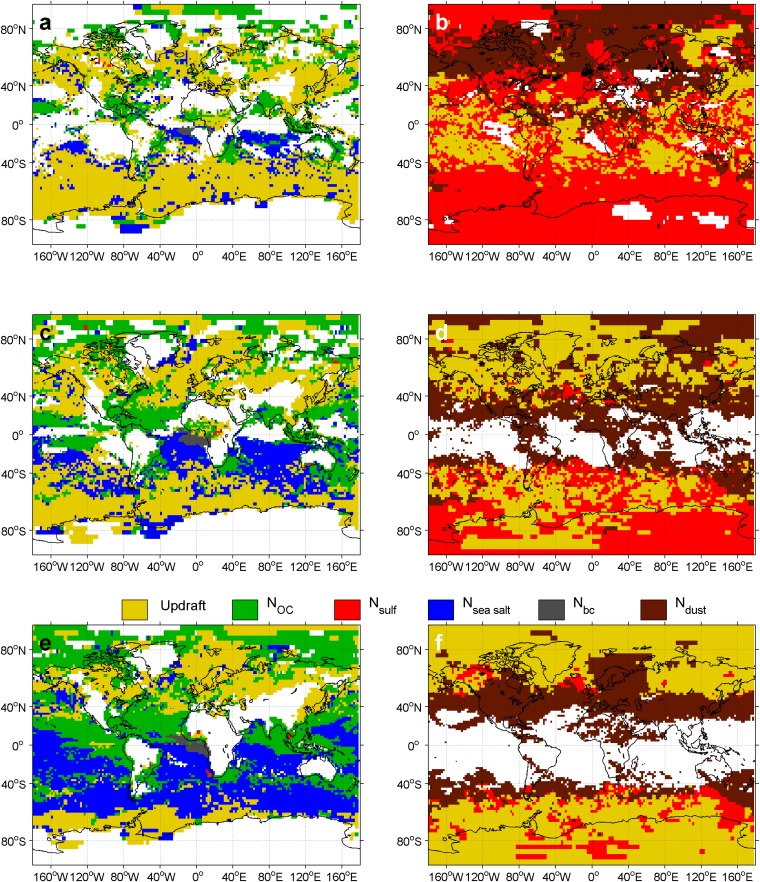
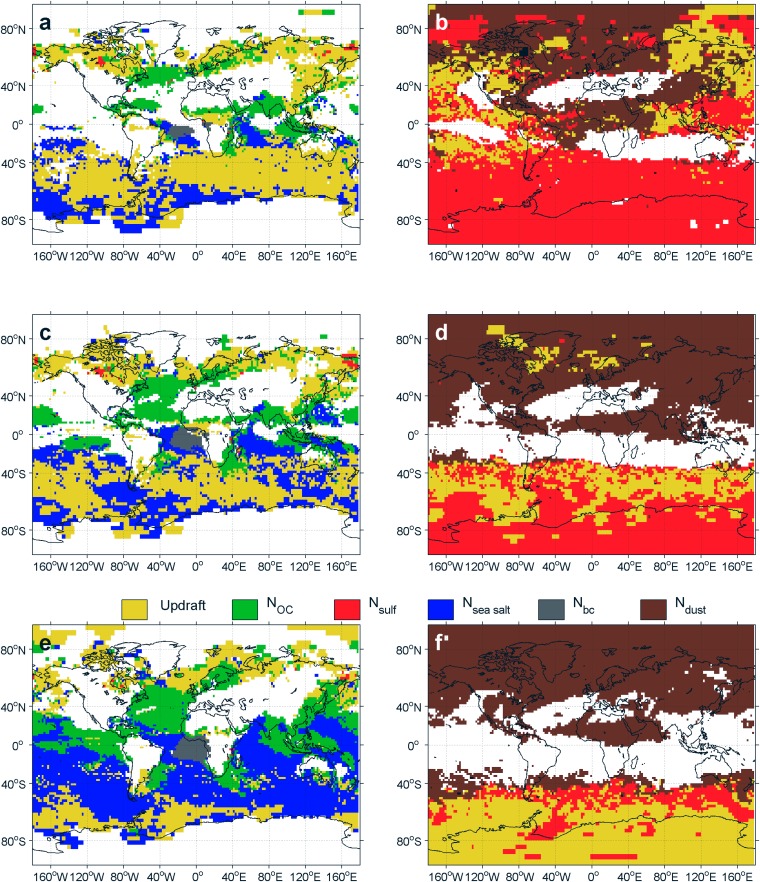
Fig. 1 shows the primary and secondary attribution grids for cloud droplet number, , and ice crystal number, , in the DEF-G simulation, while Fig. 2 shows the primary grids for ice crystal number in the DEF-C simulation. Each grid cell is colored by the input variable with the highest (primary) or second highest (secondary) temporal attribution, , averaged monthly. A given aerosol number may appear for a grid cell in both the primary and secondary grids, but these represent that aerosol number in different modes; updraft, as a single variable, may only appear in one grid or the other. Similar grids from the longer DEF-Gyr simulation are shown in Fig. S1.
Fig. 1.
Primary attribution grids, i.e., grid cells colored according to the input variable whose temporal attribution is largest, for (A) liquid droplets at 875 hPa ( = 277.5 10.9 K) and (B) ice crystals at 350 hPa ( = 236.7 11.9 K). Secondary attribution grids, i.e., grid cells colored according to the input variable whose temporal attribution is second largest, for (C) liquid droplets at 875 hPa and (D) ice crystals at 350 hPa. Values are taken from the DEF-G simulation using the Phillips et al. (20) heterogeneous nucleation spectrum. Grid cells and time points for which new hydrometeor formation is negligible, i.e., and , are filtered out; regions of negligible cloud hydrometeor formation over the month are shown in white.
Fig. 2.
Primary attribution grids for ice crystals at 232 hPa from the DEF-C simulation using the heterogeneous ice nucleation spectra of (A) Phillips et al. (20), (B) Phillips et al. (21), and (C) Barahona and Nenes (22). Ice crystal formation is assumed to occur at all model states.
Fig. S1.
Primary attribution grids, i.e., grid cells colored according to the input variable whose temporal attribution, , is largest at (A) 825 hPa, (C) 875 hPa, and (E) 925 hPa for liquid droplets and at (B) 250 hPa, (D) 350 hPa, and (F) 450 hPa for ice crystals. Values are taken from the DEF-Gyr simulation, a yearlong GEOS-5 simulation at 2° spatial resolution, using the Phillips et al. (20) heterogeneous nucleation spectrum. One daily averaged set of inputs and sensitivities is recorded per day. Then the annual variance of these inputs and mean of these sensitivities are used in the calculation of Eq. 1. Grid cells and time points for which new hydrometeor formation is negligible, i.e., and , are filtered out; regions of negligible cloud hydrometeor formation over the month are shown in white.
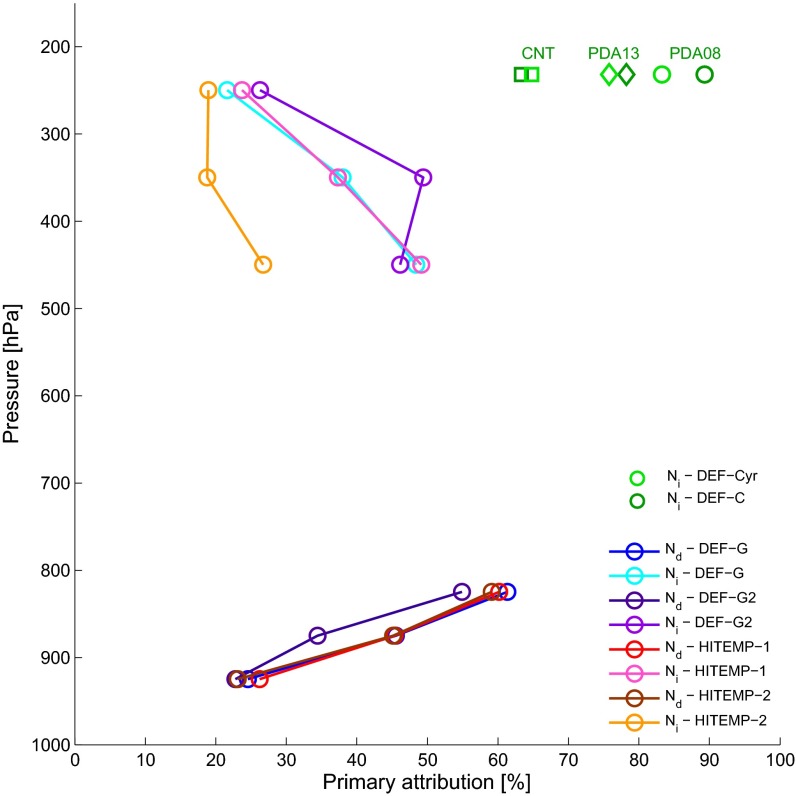
Updraft velocity is the primary driver of variability for 45.5% of the grid, as shown in Fig. 1A. The importance of vertical velocity increases with altitude, covering 24.5% of the grid at 925 hPa and 61.4% at 825 hPa. The global grid-averaged value of goes from 21.0% at 925 hPa to 39.5% at 875 hPa to 53.9% at 825 hPa. As temperature drops, the water vapor availability for generating supersaturation decreases. Increased competition for water vapor by CCN promotes the sensitivity to updraft fluctuations.
For ice crystals, updraft velocity is the primary driver of variability for 38.0% of the global grid at 350 hPa, as shown in Fig. 1B. The importance of vertical velocity for decreases with altitude, as the grid coverage changes from 48.4% at 450 hPa to 21.6% at 250 hPa. The global grid-averaged varies from 39.5% at 450 hPa to 34.6% at 350 hPa to 21.0% at 250 hPa (Fig. 3). These trends can be explained by the strong decrease in magnitude of updraft velocity and its fluctuations with altitude.
Fig. 3.
Coverage of in the primary attribution grids, i.e., the percentage of all grid cells where nonnegligible hydrometeor formation occurs for which updraft velocity has the largest temporal attribution. Values are shown for all simulations, at 825 hPa, 875 hPa, and 925 hPa for droplets in the GEOS-5 simulations ( in the legend); at 250 hPa, 350 hPa, and 450 hPa for ice crystals in the GEOS-5 simulation; and at 232 hPa for ice crystals in the CAM5.1 simulation ( in the legend).
Sea salt and organic aerosol number are the most important aerosol drivers of variability, especially closest to the surface, where aerosol number covers 73.9% of the grid with a mean value of 59.2%. Over most marine environments, temporal variability in droplet activation is influenced by sea salt numbers, whereas organic-rich aerosol dominates over land, often due to its large input variance (Fig. 1C and Figs. S1 and S2). Sulfate and accumulation mode dust numbers are the important aerosol drivers of variability, especially farthest from the surface, where aerosol number covers 77.5% of the grid with a mean of 71.9%. The dominance of sulfate versus accumulation mode dust number depends on the ice nucleation regime, either homogeneous or heterogeneous, respectively.
Fig. S2.
As in Fig. S1 but secondary attribution grids, i.e., grid cells colored according to the input variable whose temporal attribution is second largest. Values are taken from the DEF-Gyr simulation.
The seasonal dependence of temporal attributions can be seen by comparing the HITEMP-1 grids during NH winter (Fig. S3) and the HITEMP-2 grids during NH summer (Fig. S4). The seasonality is most prominent for the ice crystal attributions, as coverage is 10–20% greater in the NH summer than in the winter at all pressure levels. The coverage is comparable in both seasons. These trends are a result of nucleation regime: In the Southern Hemisphere (SH), where aerosol is limited and temperatures remain low, most nucleation is homogeneous, whereas, in the NH, where aerosol is abundant and temperatures are warmer, most nucleation is heterogeneous. This regime split is less apparent when NH temperatures become colder during winter there.
Fig. S3.
As in Fig. S1 but primary attribution grids with values taken from the HITEMP-1 simulation.
Fig. S4.
As in Fig. S1 but primary attribution grids with values taken from the HITEMP-2 simulation.
Effects of Aerosol Representation
For ice crystal formation, different representations of INP concentrations may influence the attribution calculation. Fig. 2 show attribution grids using three INP spectra for the DEF-C simulation, two observationally based [Phillips, DeMott, and Andronache, 2008 (PDA08) (20); Phillips, DeMott, Andronahce, et al., 2013 (PDA13) (21)] and one derived from classical nucleation theory [Barahona and Nenes, 2009 (BN09) (22)]. Updraft velocity is the dominant driver of variability in all simulations, covering 89.3%, 78.2%, and 63.4% of the primary attribution grids with mean values of 84.6%, 71.4%, and 52.9% for PDA08, PDA13, and BN09, respectively. Coverage values are shown in green in Fig. 3; the simulation length, considered between DEF-C and DEF-Cyr, does not have a strong impact on the temporal attribution. In regions where updraft appears for these primary attribution grids, the magnitude of is often greater than 80%, so that its attribution dominates over dust concentrations by a large margin.
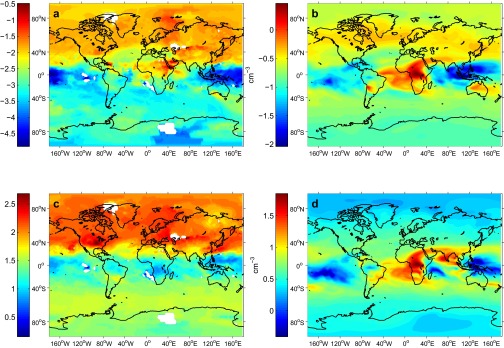
Like the INP parameterization, the aerosol module can influence the attribution calculations through the size, number, and hygroscopicity of the aerosol that can act as CCN. Large differences in the accumulation mode dust and Aitken mode sulfate numbers between the GEOS-5 and CAM5.1 simulations are shown in Fig. S5. GEOS-5 uses the Goddard Chemistry Aerosol Radiation and Transport (GOCART) bulk aerosol scheme, which tracks aerosol mass; although the model reproduces satellite aerosol optical thickness well, volume mean radii and species densities are assumed to convert mass to the input aerosol numbers for the ice crystal number calculation. CAM5.1 uses the 3-mode Modal Aerosol Module (MAM3), where both aerosol mass and number are explicitly simulated and input to the ice nucleation parameterization. Despite these large differences in aerosol representation and resulting concentrations, the treatment of subgrid updraft variability impacts output temporal variability more than the different aerosol modules. As a follow-up to this conclusion, it would be of interest to switch aerosol treatments within these model frameworks and understand how the attribution grids shift. The GOCART assumed radii and densities could be applied to the MAM3 aerosol mass fractions, or an updated version of GEOS-5 linked with MAM3 could be run.
Fig. S5.
Comparison of the input dust and sulfate aerosol number concentrations, and , between GEOS-5 (A and C) and CAM5.1 (B and D) simulations, all shown in log space: (A) from the second bin of the GOCART aerosol module in the DEF-G at 250 hPa, (B) from the accumulation mode of the MAM3 aerosol module in DEF-C at 232 hPa, (C) from GOCART in DEF-G at 250 hPa, and (D) from MAM3 in DEF-C at 232 hPa. For DEF-G, aerosol mass from GOCART is converted to number, assuming a volume mean radius for dust in the second bin of 1.4 μm and for sulfate from Jensen et al. (36) of 0.0566 μm ( = 0.02 μm, = 2.3). Dust density, , is taken to be 2.5 g⋅m−3, and sulfate density, , is taken to be 1.841 g⋅m−3. For DEF-C, both aerosol mass and number are tracked within MAM3. Lognormal size distributions are assumed for the Aitken, accumulation, and coarse modes, with fixed of 2.3, 1.8, and 1.6, respectively.
Effects of Updraft Representation
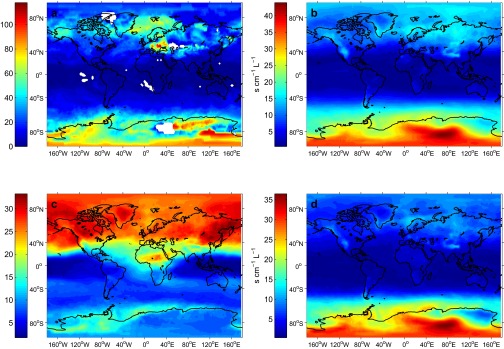
Given such high updraft temporal attributions, it is important to understand the differences in model representation of updraft between the GEOS-5 and CAM5.1. Both the magnitude and structure of updraft sensitivity fields, , for the two models are similar, as long as a version of the Phillips heterogeneous nucleation spectrum is used (Fig. S6); however, the updraft variance, , can be drastically different, as shown in Fig. S7.
Fig. S6.
Comparison of the ice crystal number sensitivity to updraft velocity, (in seconds per centimeter per liter), between GEOS-5 and CAM5.1 simulations: (A) from the DEF-G simulation with the Phillips et al. (20) nucleation spectrum at 250 hPa and after filtering out grid cells and time points where ; DEF-C simulation at 232 hPa with the (B) Phillips et al. ref. 20, (C) Barahona and Nenes ref. 21 CNT, and (D) Phillips et al. ref. 22 nucleation spectra.
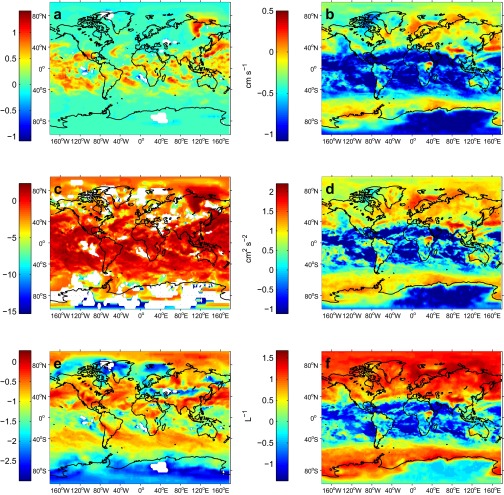
Fig. S7.
Comparison of the input updraft velocity, w, its variance, , and output newly formed ice crystal number concentration, , between GEOS-5 (A, C, and E) and CAM5.1 (B, D, and F) simulations, all shown in log space: w from (A) DEF-G and (B) DEF-C (centimeters per second); from (C) DEF-G and (D) DEF-C (square centimeters per seconds squared); and from (E) DEF-G and (F) DEF-C (per liter). GEOS-5 maps are shown at 250 hPa, after filtering out grid cells and time points where , i.e., only when nonnegligible hydrometeor formation occurs. CAM maps are shown at 232 hPa. Additional regions of C are omitted when .
In GEOS-5, the subgrid updraft velocity, w, is the summation of the grid-scale vertical velocity from the omega equation plus a term calculated from latent heating and the dry environmental lapse rate. The droplet activation parameterization uses only this value, with a minimum of 1 cm⋅s−1 enforced. The BN ice nucleation parameterization uses this value, with the same minimum, as the mean of a Gaussian updraft distribution; the SD is set to 0.25 m⋅s−1. Outputs are then weighted by a six-point Gauss Legendre quadrature over the range . For the lower bound of this quadrature, another minimum of 0.1 cm⋅s−1 is enforced. As shown by the very low updraft variances in Fig. S7C, the model state is often at the lower bound for w of 1 cm⋅s−1.
In CAM5.1, the subgrid updraft velocity does not involve the grid-scale velocity but only a value calculated from the square root of the turbulent kinetic energy from the moist turbulence scheme, which uses a first-order, small-eddy closure (23). Both parameterizations use this value, with a minimum of 0.2 m⋅s−1 enforced for droplet activation and of 0.1 cm⋅s−1 for ice nucleation. The default maxima are 10 m⋅s−1 and 2 m⋅s−1, respectively, but we eliminate this ice nucleation maximum and use the same quadrature approach described above. Although CAM5.1 input updrafts tend to be smaller, parameterizing turbulence increases its updraft variance by orders of magnitude (Fig. S7D) and makes these vertical motions the dominant driver of temporal variability in . Using an updraft velocity threshold that is too large may mute the variability in or and shift the temporal attribution from dynamical to aerosol parameters.
The importance of input updraft variance versus inherent sensitivity to updraft can also be assessed with the temporal attribution fraction, . If , the hydrometeor number is relatively insensitive to updraft fluctuations; the input updraft variance has to be large to dominate the temporal attribution. Conversely, when , the hydrometeor number is quite sensitive to updraft fluctuations; the input variance can be small and still dominate the temporal attribution. In the latter case, any uncertainty in w translates to large uncertainty in hydrometeor concentration.
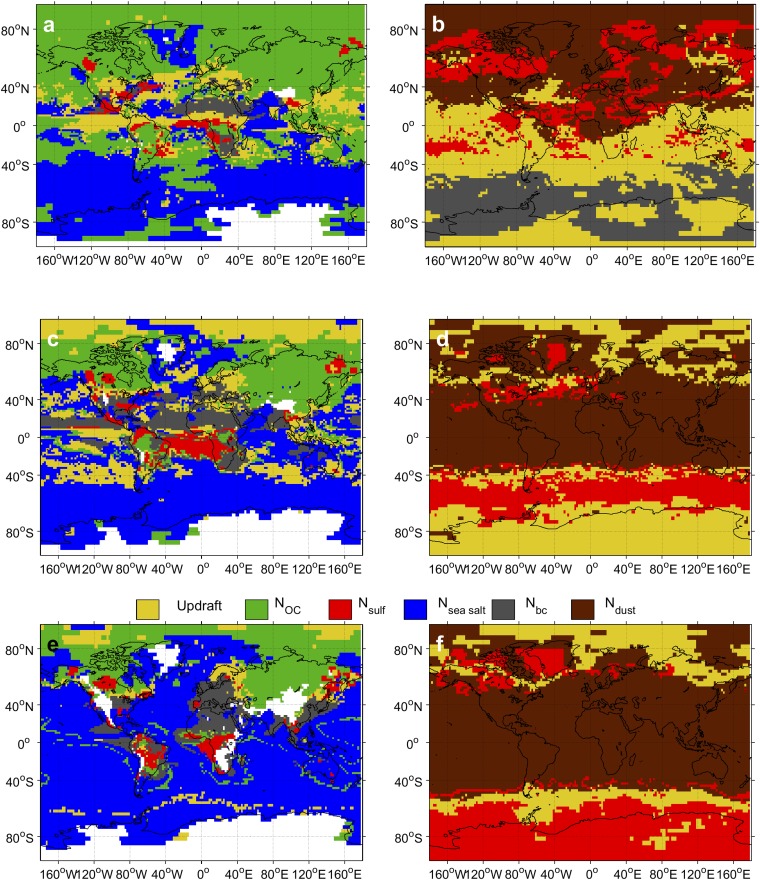
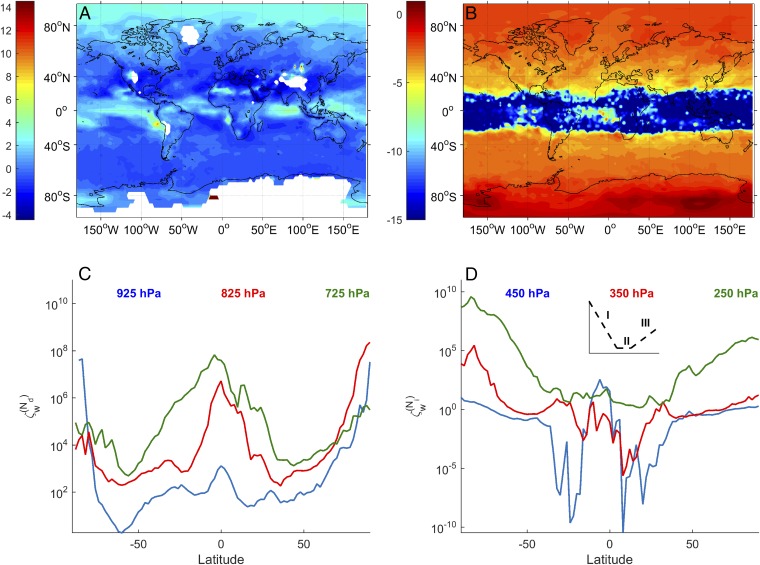
Fig. 4 shows the updraft temporal attribution fraction, , in log space for liquid droplets and ice crystals in the DEF-G simulation at 875 hPa and 350 hPa, respectively. is generally small, on the order of 10−2, with input updraft variance contributing more to output variability than . At high latitudes, where w often encounters its lower bound and drops off, can increase dramatically (Fig. 4 C and D). Updraft sensitivity is also highest at these extreme latitudes (Fig. S6A), and the increase in with latitude is even more pronounced at higher altitudes. At lower altitudes, the attribution fraction is more likely to remain small at all latitudes because fluctuations in input updraft velocity will be large. At times, for example, 925 hPa will still be within the boundary layer and subject to strong vertical mixing.
Fig. 4.
Temporal attribution fractions of updraft velocity, for (A) liquid droplets at 875 hPa and (B) ice crystals at 350 hPa, plotted in log space for the DEF-Gyr simulation. Annually averaged sensitivities and annual variances are used in the calculation of Eq. 2. Zonally averaged traces are also shown of (C) and (D) for all three pressure levels from DEF-Gyr. (D, Inset) The three latitudinal “regimes” for traces are schematized.
Hemispherical asymmetry in , can be explained by nucleation regime. Nucleation is primarily homogeneous in the SH due to colder temperatures and less aerosol. Ice crystal number also increases more rapidly with updraft during homogeneous nucleation, so becomes larger in the SH; this is denoted Regime I in Fig. 4E. In the NH, heterogeneous nucleation is promoted because additional aerosol increases the likelihood of available INP and warmer temperatures suppress homogeneous nucleation. Because ice crystal number increases less rapidly with updraft during heterogeneous nucleation, does not increase so rapidly with latitude, denoted Regime III in Fig. 4E. Almost no crystal formation is seen at tropical latitudes, except at the highest altitude, and remains flat in this Regime II.
The latitudinal profile of also has asymmetry because increases for higher aerosol loadings. As a result, tends to be higher in the NH than in the SH where aerosol loading is higher, or equivalently, active fraction is lower. The also increases toward more extreme latitudes because the updraft magnitude is lower and an incremental increase in supersaturation is more influential.
Implications
The GEOS-5 and CAM5.1 simulations demonstrate the importance of updraft velocity for hydrometeor concentrations. When subgrid-scale variability from turbulence is parameterized, vertical velocity is a dominant contributor to hydrometeor number variability over most of the globe. Although previous work has shown the existence of aerosol- and updraft-dominated hydrometeor formation regimes (e.g., ref. 24), these have not necessarily considered the input variance. Recent work has shown the importance of dynamics for the liquid phase and aerosol for the ice phase. Simmel et al. showed with a small-scale model that changes in INP number have a larger effect on simulated ice water content or path than changes in dynamic parameters (25). In contrast, liquid water content or path was more sensitive to adjustments in cloud base or updraft velocity. Collocated Raman and Doppler lidar measurements also confirm that turbulence and entrainment convolute the aerosol−droplet number correlation above the cloud base within altocumulus (26). Along with studies like these, the attribution metrics presented here are useful in determining if models capture the correct source of and variability.
Future work should focus on eliminating vertical velocity thresholds and include more physical updraft distributions to better predict hydrometeor number and its temporal evolution. Additional updraft measurements will be critically important to this end. Simulated vertical velocity distributions are rarely evaluated against sparse observations, in contrast to relatively frequent evaluation of aerosol properties against relatively abundant data. Updraft measurements must be made, however, at appropriate temporal and spatial resolution and with low enough uncertainty for meaningful evaluations. The temporal attribution fractions here indicate that the most accurate updraft measurements must be made at high latitudes and altitudes. If such accurate measurements are not possible or the approximations in turbulence parameterizations are too great, then irreducible uncertainties in modeled hydrometeor number may remain.
Materials and Methods
GEOS-5 Setup.
The Ganymed 4.0 subversion of GEOS-5 was used, along with the Microphysics of Clouds with Relaxed Arakawa-Schubert and Aerosol-Cloud Interaction and the Rapid Radiative Transfer Model for GCMs schemes (27, 28). Sea surface temperatures are prescribed using monthly sea surface temperature (SST) datasets from which daily SST are linearly interpolated. The GOCART aerosol module (29, 30), 2° spatial resolution, and a 30-min time step were also used, except in DEF-G2, for which the time step is 15 min. Aerosol mass from GOCART is converted to number, assuming volume mean radii and species densities. The monthly simulations (DEF-G, DEF-G2, HITEMP-1, and HITEMP-2) were all run for January 2010. The yearly simulation (DEF-Gyr) was run from January through December 2010.
The construction of the GEOS-5 ice adjoint was based on the Barahona and Nenes cirrus ice nucleation parameterization (16, 17, 22). The droplet adjoint was constructed from the set of Nenes activation schemes (31).
CAM 5.1 Setup.
The DEF-C and DEF-Cyr simulations are done with inputs from CAM5.1 at 2.5° × 1.88° resolution, a 30-min time step, emissions from Lamarque et al. (32), and the MAM3 model (33). A given aerosol number concentration in a given mode is calculated by scaling the total aerosol number concentration in that mode by the mass fraction of the given aerosol in the given mode (15). The geometric SD for the Aitken mode is set to 2.3, for the accumulation mode is set to 1.8, and for the coarse mode is set to 1.6. The Morrison and Gettelman microphysics scheme is used (34), replacing the default Liu and Penner ice nucleation scheme (35) with that of Barahona and Nenes (22). The deposition coefficient is set to 0.7.
Attribution Metrics.
Sensitivities used for both metrics are calculated at each model state, varying for each grid point between time steps. These sensitivities, along with the input and output values, are filtered for cases in which new hydrometeor formation is nonnegligible, i.e., 1 cm−3 and 1 L−1, and then averaged.
The temporal attribution, , of the input variable , i.e., updraft velocity or aerosol number, for output scalar Y, i.e., or , is defined as
| [1] |
where is the mean adjoint sensitivity to input , is the variance of input , and J is the number of input variables considered.
The temporal attribution fraction, , of input to output Y for a given grid cell is defined as
| [2] |
where is the mean of input and is the mean output value at each grid cell.
Temporal Averaging and Integration Time Step Effects on Attribution Metrics
An important consideration in the attribution analysis is the effect of temporal averaging and time step. Fig. S3 shows primary attribution grids from the HITEMP-1 simulation, during which temporal attributions are calculated using means and variances for hourly output. In this case, updraft velocity is the primary contributor for between 26.4% (925 hPa) and 60.2% (825 hPa) of the grid and between 23.7% (250 hPa) and 49.2% (450 hPa) of the grid. These values closely resemble the DEF-G attributions. DEF-G2 simulation attributions, for which the GCM integration time step is half of the DEF-G time step, yield coverage and mean values within 10% of the DEF-G values. Robustness across temporal averaging and integration time step make the adjoint sensitivity attribution metrics particularly useful.
Acknowledgments
We thank two anonymous reviewers for their insightful suggestions, which have greatly improved the manuscript. We thank Prof. Ricardo Morales-Betancourt for providing the CAM5.1 inputs that were used to run the DEF-C and DEF-Cyr simulations. S.C.S. acknowledges Dr. Donifan Barahona, for instruction in using the GEOS-5 framework, and support from a NASA Earth and Space Science Fellowship. A.N., D.L., and L.O. acknowledge financial support from the NASA Modeling Analysis and Prediction program. A.N. acknowledges support from a DOE EaSM grant and a Georgia-Power Faculty Scholar chair.
Footnotes
The authors declare no conflict of interest.
This paper results from the Arthur M. Sackler Colloquium of the National Academy of Sciences, “Improving Our Fundamental Understanding of the Role of Aerosol–Cloud Interactions in the Climate System,” held June 23−24, 2015, at the Arnold and Mabel Beckman Center of the National Academies of Sciences and Engineering in Irvine, CA. The complete program and video recordings of most presentations are available on the NAS website at www.nasonline.org/Aerosol_Cloud_Interactions.
This article is a PNAS Direct Submission.
This article contains supporting information online at www.pnas.org/lookup/suppl/doi:10.1073/pnas.1514039113/-/DCSupplemental.
References
- 1.Boucher O, et al. 2013. Clouds and aerosols. Climate Change 2013: The physical science basis. Contribution of Working Group I to the Fifth Assessment Report of the Intergovernmental Panel On Climate Change, eds Stocker TF, et al. (Cambridge Univ Press, Cambridge, UK), pp 571–658.
- 2.Chen T, Rossow WB, Zhang Y. Radiative effects of cloud-type variations. J Clim. 2000;13(1):264–286. [Google Scholar]
- 3.Kormurcu M, et al. Intercomparison of the cloud water phase among global climate models. J Geophys Res. 2014;119(6):3372–3400. [Google Scholar]
- 4.Choi YS, Lindzen RS, Ho CH, Kim J. Space observations of cold-cloud phase change. Proc Natl Acad Sci USA. 2010;107(25):11211–11216. doi: 10.1073/pnas.1006241107. [DOI] [PMC free article] [PubMed] [Google Scholar]
- 5.Choi YS, Ho CH, Park CE, Storelvmo T, Tan I. Influence of cloud phase composition on climate feedbacks. J Geophys Res. 2013;119(7):3687–3700. [Google Scholar]
- 6.Salzmann M, et al. Two-moment bulk stratiform cloud microphysics in the GFDL AM3 GCM: Description, evaluation, and sensitivity tests. Atmos Chem Phys. 2010;10(16):8037–8064. [Google Scholar]
- 7.Miller RL, et al. CMIP5 historical simulations (1850−2012) with GISS ModelE2. J Adv Model Earth Syst. 2014;6(2):441–447. [Google Scholar]
- 8.Barahona D, et al. Development of two-moment cloud microphysics for liquid and ice within the NASA Goddard Earth Observing System Model (GEOS-5) Geosci Model Dev. 2014;7(4):1733–1766. [Google Scholar]
- 9.Gettelman A, et al. Advanced two-moment bulk microphysics for global models. Part II: Global model solutions and aerosol-cloud interactions. J Clim. 2015;28(3):1288–1307. [Google Scholar]
- 10.Penner JE, et al. Model intercomparison of indirect aerosol effects. Atmos Chem Phys. 2006;6(11):3391–3405. [Google Scholar]
- 11.Ghan SJ, et al. Droplet nucleation: Physically-based parameterizations and comparative evaluation. J Adv Model Earth Syst. 2011;3(4):M10001. [Google Scholar]
- 12.Morales-Betancourt R, et al. Sensitivity of cirrus and mixed-phase clouds to the ice nuclei spectra in McRAS-AC: Single column model simulations. Atmos Chem Phys. 2012;12(22):10679–10692. [Google Scholar]
- 13.Curry J, Khvorostyanov V. Assessment of some parameterizations of heterogeneous ice nucleation in cloud and climate models. Atmos Chem Phys. 2012;12(2):1151–1172. [Google Scholar]
- 14.Xie S, Liu X, Zhao C, Zhang Y. Sensitivity of CAM5-simulated Arctic clouds and radiation to ice nucleation parameterization. J Clim. 2013;26(16):5981–5999. [Google Scholar]
- 15.Morales R, Nenes A. Understanding the contributions of aerosol properties and parameterization discrepancies to droplet number variability in a global climate model. Atmos Chem Phys. 2014;14(9):4809–4826. [Google Scholar]
- 16.Sheyko B, et al. Quantifying sensitivities of ice crystal number and sources of ice crystal number variability in CAM 5.1 using the adjoint of a physically based cirrus formation parameterization. J Geophys Res. 2015;120(7):2834–2854. [Google Scholar]
- 17.Sullivan S, Morales Betancourt R, Barahona D, Nenes A. Understanding cirrus ice crystal number variability for different heterogeneous ice nucleation spectra. Atmos Chem Phys. 2016;16(4):2611–2629. [Google Scholar]
- 18.McComiskey A, Feingold G. The scale problem in quantifying aerosol indirect effects. Atmos Chem Phys. 2012;12(2):1031–1049. [Google Scholar]
- 19.Morales-Betancourt R, Nenes A. Understanding the contributions of aerosol properties and parameterization discrepancies to droplet number variability in a global climate model. Atmos Chem Phys. 2014;14(9):4809–4826. [Google Scholar]
- 20.Phillips V, DeMott P, Andronache C. An empirical parameterization of heterogeneous ice nucleation for multiple chemical species of aerosol. J Atmos Sci. 2008;65(9):2757–2783. [Google Scholar]
- 21.Phillips V, et al. Improvements to an empirical parameterization of heterogeneous ice nucleation and its comparison with observations. J Atmos Sci. 2013;70(2):378–409. [Google Scholar]
- 22.Barahona D, Nenes A. Parameterizing the competition between homogeneous and heterogeneous freezing in ice cloud formation - polydisperse ice nuclei. Atmos Chem Phys. 2009;9(3):5933–5948. [Google Scholar]
- 23.Neale R, et al. 2012. Description of the NCAR Community Atmosphere Model (CAM 5.0) (Natl Cent Atmos Res, Boulder, CO), NCAR Tech Note 486/TN+STR.
- 24.Reutter P, et al. Aerosol- and updraft-limited regimes of cloud droplet formation: Influence of particle number, size, and hygroscopicity on the activation of cloud condensation nuclei (CCN) Atmos Chem Phys. 2009;9(18):7067–7080. [Google Scholar]
- 25.Simmel M, Bühl J, Ansmann A, Tegen I. Ice phase in altocumulus clouds over Leipzig: Remote sensing observations and detailed modeling. Atmos Chem Phys. 2015;15(8):10453–10470. [Google Scholar]
- 26.Schmidt J, Ansmann A, Bühl J, Wandinger U. Strong aerosol-cloud interaction in altocumulus during updraft periods: Lidar observations over central Europe. Atmos Chem Phys. 2015;15(18):10687–10700. [Google Scholar]
- 27.Sud YC, et al. Performance of McRAS-AC in the GEOS-5 AGCM: Aerosol-cloud-microphysics, precipitation, cloud radiative effects, and circulation. Geosci Model Dev. 2013;6(1):57–79. [Google Scholar]
- 28.Lee D, et al. Modeling the influences of aerosols on pre-monsoon circulation and rainfall over Southeast Asia. Atmos Chem Phys. 2014;14(13):6853–6866. [Google Scholar]
- 29.Chin M, et al. Atmospheric sulfur cycle simulated in the global model GOCART: Comparison with field observations and regional budgets. J Geophys Res. 2000;105(D20):24689–24712. [Google Scholar]
- 30.Ginoux P, et al. Sources and distributions of dust aerosols simulated with the GOCART model. J Geophys Res. 2001;106(D17):20255–20273. [Google Scholar]
- 31.Morales-Betancourt R, Nenes A. Droplet activation parameterization: The population-splitting concept revisited. Geosci Model Dev. 2014;7(5):2345–2357. [Google Scholar]
- 32.Lamarque J-F, et al. Historical (1850–2000) gridded anthropogenic and biomass burning emissions of reactive gases and aerosols: Methodology and application. Atmos Chem Phys. 2010;10(15):7017–7039. [Google Scholar]
- 33.Liu X, et al. Toward a minimal representation of aerosols in climate models: Description and evaluation in the Community Atmosphere Model CAM5. Geosci Model Dev. 2012;5(3):709–739. [Google Scholar]
- 34.Morrison H, Gettelman A. A new two-moment bulk stratiform cloud microphysics scheme in the Community Atmosphere Model, Version 3 (CAM3). Part I: Description and numerical tests. J Clim. 2008;21(15):3642–3659. [Google Scholar]
- 35.Liu X, Penner J. Ice nucleation parameterization for global models. Meteorol Z. 2005;14(4):499–514. [Google Scholar]
- 36.Jensen EJ, Kinne S, Toon OB. Tropical cirrus cloud radiative forcing – sensitivity studies. Geophys Res Lett. 1994;21:2023–2026. [Google Scholar]


