Significance
In this article, we present a pioneering experimental approach for studying cell migration and more broadly establish representative guidelines for applying an optogenetic approach in biological studies. Using recently developed optogenetic tools, we identified local Ca2+ influx as a major source of Ca2+ for gradient formation and established the functional importance of polarized chemistry in highly coordinated cell migration. These findings provide strong evidence for a mechanism that addresses fundamental questions about front–rear Ca2+ gradients in migrating cells and suggest a previously unidentified role of voltage-dependent Ca2+ channels in the directional migration of nonexcitable cells.
Keywords: optogenetics, cell migration, calcium signaling, cell polarity, actin cytoskeleton
Abstract
Cell migration is controlled by various Ca2+ signals. Local Ca2+ signals, in particular, have been identified as versatile modulators of cell migration because of their spatiotemporal diversity. However, little is known about how local Ca2+ signals coordinate between the front and rear regions in directionally migrating cells. Here, we elucidate the spatial role of local Ca2+ signals in directed cell migration through combinatorial application of an optogenetic toolkit. An optically guided cell migration approach revealed the existence of Ca2+ sparklets mediated by L-type voltage-dependent Ca2+ channels in the rear part of migrating cells. Notably, we found that this locally concentrated Ca2+ influx acts as an essential transducer in establishing a global front-to-rear increasing Ca2+ gradient. This asymmetrical Ca2+ gradient is crucial for maintaining front–rear morphological polarity by restricting spontaneous lamellipodia formation in the rear part of migrating cells. Collectively, our findings demonstrate a clear link between local Ca2+ sparklets and front–rear coordination during directed cell migration.
Mesenchymal cell migration is characterized by polarization of the cell to form a leading edge with adhesive-mediated protrusion and a trailing edge with a contractile cell rear (1). To maintain their polarized morphology and achieve efficient migration, migrating cells require front–rear coordination: simultaneous harmonization of frontal protrusion and rear retraction. This coordination is a key process in directional cell migration and is regulated by diverse external guidance cues that steer intrinsic cell directionality (2). Among intracellular signaling messengers, Ca2+ signals are widely known to regulate cell migration. Intracellular Ca2+ signals are fine tuned in space and time by intracellular Ca2+ buffers and reservoirs (3). Given their spatiotemporal diversity, localized Ca2+ signals act as versatile signaling mediators of the functions that constitute the multiple steps in cell movement. For example, localized Ca2+ influx derived from stretch-activated Ca2+ channels in the front region of migrating cells is known to steer membrane protrusions (4). Moreover, other types of Ca2+ influxes have been reported to mediate detachment of the trailing part of the cell during migration (5, 6). Although such reports regarding local Ca2+ effects have provided fragmentary insight into the motile processes, how these local Ca2+ signals systemically operate to coordinate cell migration is still incompletely understood.
As knowledge about cell migration has grown, so too have demands for novel approaches capable of recapitulating cellular movements with the precise spatiotemporal resolution necessary to accurately dissect mechanisms underlying directional migration (2). A variety of optogenetic tools based on light-controllable proteins have recently been introduced as a means for regulating biological activity in living cells and organisms (7–9). This notable expansion of optogenetics has opened up new avenues for regulating diverse signaling pathways in a robust, reversible, and spatiotemporal manner (10). In particular, recently developed optogenetic tools have demonstrated remarkable efficacy in controlling cell motility and related signals through tailored optical input (7, 11). Exploiting the photosensory protein cryptochrome 2 of Arabidopsis thaliana, we recently developed an optically controllable receptor tyrosine kinase (RTK), optically controlled FGF receptor 1 (optoFGFR1), and demonstrated its precise spatiotemporal regulation of cell polarity and directionality (12). Such versatile regulators of cell motility have the potential to unveil the mechanisms underlying directional cell migration, which are difficult to address using previously existing methods.
Here, using optogenetic tools that modulate RTK downstream pathways, we elucidated the spatially distinct role of local Ca2+ signals in directed cell migration. With this toolkit, we were able to visualize locally evoked Ca2+ sparklets, which are crucial for coordinated migration of endothelial cells through induction of a polarized state. Notably, this Ca2+ influx establishes a front-to-rear increasing Ca2+ gradient in migrating cells that consequently maintains cell polarity by restricting spontaneous lamellipodia formation in the trailing edge. This study identifies a previously unrecognized pathway that links Ca2+ sparklets, Ca2+ gradients, and front–rear coordination in the context of directed cell migration.
Results
The Effect of RTK Downstream Pathways in Coordinated Migration.
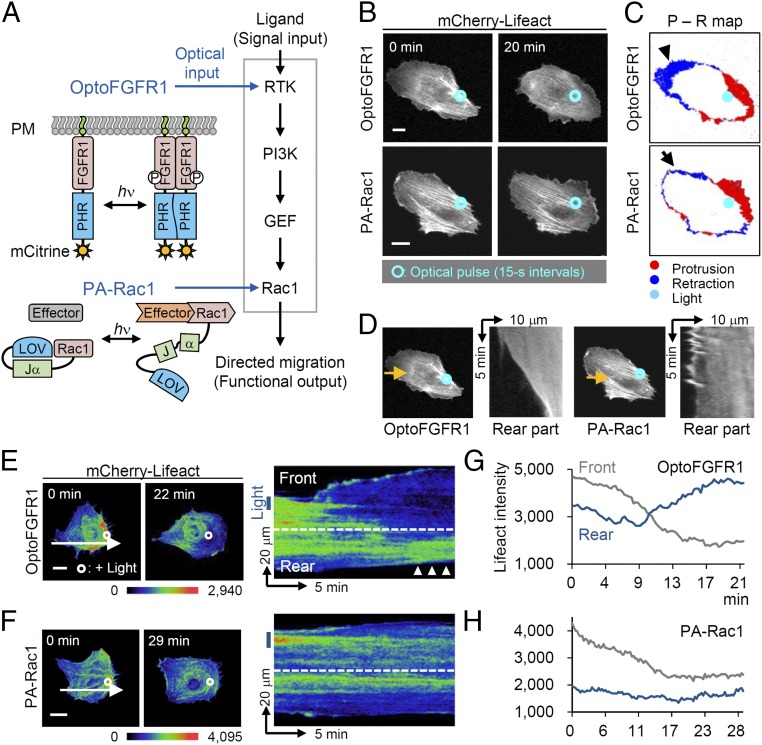
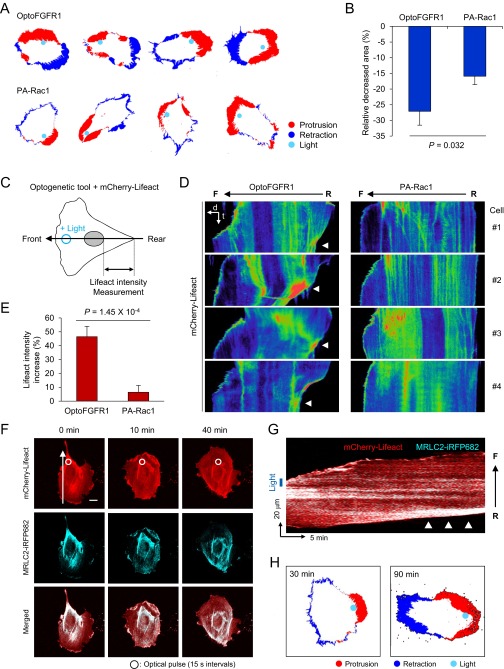
RTK signaling pathway plays a central role in connecting ligand (signaling input) to migration (functional output) in cells that directionally migrate in response to external cues. To determine the different contributions of each signaling node of RTK downstream to the process of directed cell migration, we used two optogenetic tools—optically controlled fibroblast growth factor receptor 1 (optoFGFR1) (12) and photoactivatable Rho small GTPase Rac1 (PA-Rac1) (7)—which optically regulate cell migration by activating distinct nodes in the signaling hierarchy (Fig. 1A). Each optogenetic tool was expressed in human umbilical vein endothelial cells (HUVECs), and the motile pattern guided by localized photoactivation was monitored. In both cases, localized illumination (488 nm, 1 μW, 15-s intervals) oriented the leading edge toward the illuminated area with increasing membrane protrusion (optoFGFR1: +18.2%; PA-Rac1: +17.7%, relative to entire cell area; Fig. 1 B and C). However, significantly more retraction on the opposite side of illumination was observed in optoFGFR1-expressing cells (−27.1%) compared with PA-Rac1–expressing cells (−15.9%; P = 0.032) (Fig. 1D and Fig. S1 A and B). Based on this optically oriented direction of cell movement, we defined the illuminated part as “front” and the opposite part as “rear.” We then investigated signal dynamics of Lifeact (F-actin biosensor) (13) in HUVECs during optical guidance. Overall Lifeact signals in the front region gradually decreased in both groups, indicating actin turnover from thick fiber to branched form during lamellipodia formation; whereas only optoFGFR1-expressing cell showed remarkable local accumulation of Lifeact signals in the contracting rear region, indicating stress fiber formation, in accordance with our previous finding (12) (Fig. 1 E–H). A graph quantifying Lifeact intensity clearly showed the increasing pattern (+46.5%) in the rear part of optoFGFR1-expressing HUVECs (Fig. S1 C–E). We also observed that myosin signals [myosin regulatory light chain 2 (MRLC2)-iRFP682] were preferentially colocalized with the accumulated Lifeact signals, implying that actomyosin crosslinking drives rear retraction during optical guidance of HUVECs (Fig. S1 F and G). Such rear myosin concentration is also known to coordinate cell motility through organization of front–rear actin network treadmilling (14). Collectively, these results demonstrate the hierarchical difference of signals in front–rear coordinated cell migration, represented by harmonization of rear retraction with frontal protrusion: upstream RTK induces more robust retraction than downstream Rac1. In the case of PA-Rac1, retraction occurred with prolonged photoactivation (90 min), indicating that PA-Rac1 also leads to coordination rather than simply producing frontal protrusion (Fig. S1H).
Fig. 1.
Hierarchically different effects of RTK downstream signaling on front–rear coordination. (A) Schematic representation of optoFGFR1 and photoactivatable Rac1 (PA-Rac1, Left) and their application to simplified RTK downstream signaling (Right). FGFR1, cytoplasmic region of FGFR1; PHR, photolyase homology region of cryptochrome 2; LOV, light oxygen voltage domain from phototropin1; Jα, α-helical extension of phototropin1. (B) Lifeact (F-actin biosensor) images of HUVECs undergoing subcellular activation of optoFGFR1 (Upper) and PA-Rac1 (Lower) by local illumination (blue circles, 488 nm, 1 μW, 15-s intervals). (C) Protrusion retraction maps of optically guided HUVECs. Arrowhead and arrow indicate the retracting part of cells expressing optoFGFR1 and PA-Rac1, respectively. (D) Kymographs of the rear part of the cells in B. Yellow arrows represent the line-scanned area. (E and F) Pseudocolored Lifeact (F-actin biosensor) images (Left) and kymograph (Right) of optically guided HUVECs. White circles and blue boxes indicate illuminated regions; white arrows indicate line-scanned area; arrowheads indicate accumulation of Lifeact signals. (G and H) Quantified intensity of Lifeact signal in front and rear parts of the cells in E and F. (Scale bars: 20 μm.)
Fig. S1.
Different mode of rear retraction of HUVECs guided by optoFGFR1 and PA-Rac1. (A) Representative protrusion–retraction maps of HUVECs guided by optoFGFR1 or PA-Rac1. (B) Quantitative data of decreased area of the rear part of HUVECs after optical guidance by optoFGFR1 (n = 7) or PA-Rac1 (n = 8). Data are represented as mean ± SEM, two-tailed t test. (C) Experimental scheme for detecting rear retraction patterns upon optical guidance of HUVECs. Large arrow indicates the line-scanned region for generating kymograph in D. Lifeact (F-actin biosensor) signals in posterior region of nucleus (double-sided arrow) were measured. (D) Kymographs of pseudocolored Lifeact signals in optically guided HUVECs by optoFGFR1 and PA-Rac1. Images were taken for 30 min. Arrowheads indicate accumulation of Lifeact signals in rear part. F, front; R, rear. (E) Quantitative data of increased Lifeact signals in rear part of HUVECs guided by optoFGFR1 (n = 11) or PA-Rac1 (n = 11). Data are represented as mean ± SEM, two-tailed t test. (F) Filamentous actin (mCherry-Lifeact; red) and myosin (MRLC2-iRFP682; cyan) changes in HUVEC under subcellular activation of optoFGFR1. White circles indicate illuminated region; arrow indicates line-scan region for kymograph in G. (G) Kymograph of the change in actomyosin distribution. Arrowheads point to the region of actomyosin cross-linking. Blue box indicates illuminated region. (H) Protrusion retraction maps of optically guided HUVECs expressing PA-Rac1 upon extended photoactivation (90 min). (Scale bars: 20 μm.)
Identifying Local Ca2+ Signals in Migrating HUVECs.
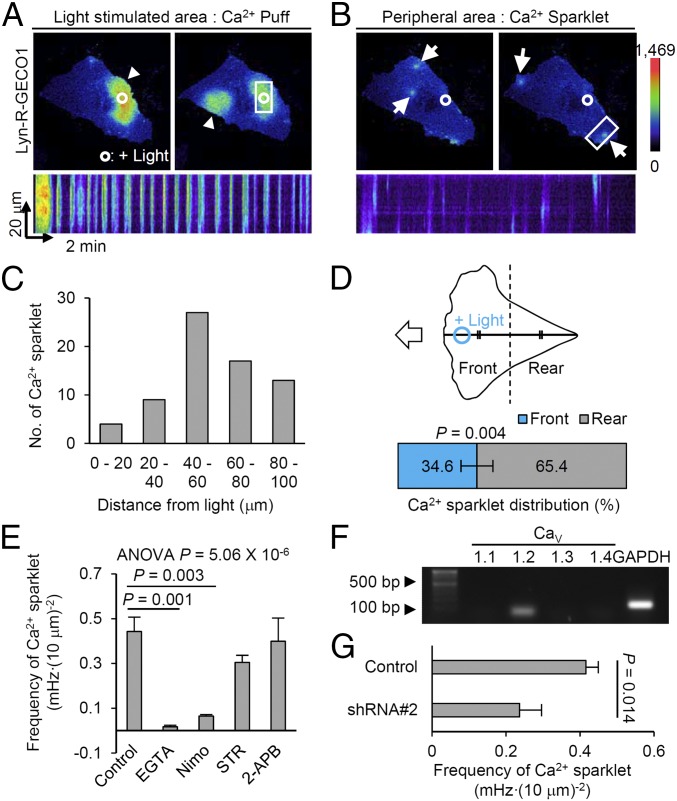
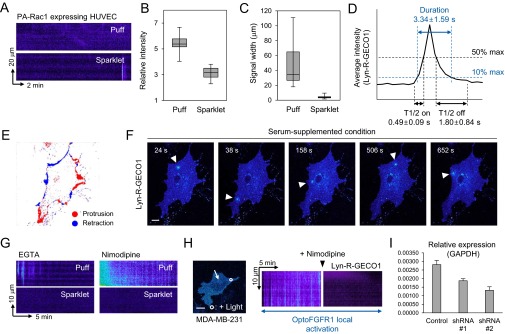
We hypothesized that the observed rear retraction might be related to the local Ca2+ distribution, a factor well known to generate cell contractility (15). To test this, we first modified red fluorescent genetically encoded calcium indicators for optical imaging version 1 (R-GECO1) (16), an intensiometric Ca2+ biosensor, to produce a membrane-tethered format (Lyn-R-GECO1) to increase sensitivity and spatial resolution of the biosensor (17). We then cotransfected Lyn-R-GECO1 and optoFGFR1 into HUVECs and monitored local Ca2+ dynamics during optically guided cell movement. Upon local activation of optoFGFR1, two distinct patterns of Lyn-R-GECO1–based Ca2+ geometry were clearly visible: Ca2+ puffs, broad (mean width: 48.09 μm), oscillating signals localized around the illuminated area; and Ca2+ sparklets, pinpoint signals (4.03 μm) detected in the light-unreachable peripheral region of the cell (18) (Fig. 2 A–C and Movie S1). By contrast, local activation of PA-Rac1 did not induce remarkable changes in Ca2+ levels (Fig. S2A). We then investigated the spatiotemporal characteristics of Ca2+ sparklets, including distribution, amplitude, and duration in multiple cells (Fig. S2 B–D). Notably, Ca2+ sparklets were predominantly (65.4%) located in the rear retracting part of migrating HUVECs (Fig. 2D). Upon addition of serum instead of optical stimulation, sparklets were also observed near the retracting part of migrating cells (Fig. S2 E and F). These data suggest the possibility that Ca2+ sparklets are related to the rear retraction in migrating HUVECs.
Fig. 2.
Distinct Ca2+ patterns induced by subcellular activation of optoFGFR1. (A and B) (Upper) Pseudocolored images of Lyn-R-GECO1 (membrane-targeted Ca2+ sensor) showing Ca2+ puffs (arrowheads) and Ca2+ sparklets (arrows). (Lower) Kymographs scanning white-squared region. (Magnification: 60×.) (C) Distribution of Ca2+ sparklets of B in relation to distance from the illuminated region. (D) The front–rear distribution of Ca2+ sparklets in HUVECs optically guided by optoFGFR1. n = 8, mean ± SEM, two-tailed t test. (E) Frequency of Ca2+ sparklets in HUVECs treated with various inhibitors. Nimo, nimodipine; STR, streptomycin; 2-APB, 2-aminoethoxydiphenyl borate. n > 7, mean ± SEM, one-way ANOVA. One outlier was excluded. (F) mRNA expression profile of L-type CaV channel subtypes in HUVECs. (G) Frequency of Ca2+ sparklets in HUVECs transfected with shRNA (CaV1.2 knockdown). n = 11, mean ± SEM, two-tailed t test.
Fig. S2.
Characterization of local Ca2+ signals induced by local activation of optoFGFR1. (A) Kymographs (Lyn-R-GECO1) displaying Ca2+ patterns in HUVEC undergoing local activation of PA-Rac1. (B) Measured Lyn-R-GECO1 intensity of Ca2+ puffs (n = 17) and sparklets (n = 17). Data are represented as median ± max/min. (C) Signal width of Ca2+ puffs (n = 35) and sparklets (n = 35). Data are represented as median ± max/min. (D) Dynamics of Ca2+ sparklets measured as average kinetic parameters (duration, T1/2; detailed information is included in SI Materials and Methods). (E) Protrusion–retraction map of HUVEC under serum-supplemented condition (20 min). (F) Pseudocolor images of Lyn-R-GECO1 showing Ca2+ sparklets (arrowheads) in HUVEC under serum-supplemented condition. (G) Kymographs (Lyn-R-GECO1) displaying Ca2+ transients in HUVECs upon treatment with EGTA (Left) or nimodipine (Right). (H) Ca2+ sparklets in the human breast cancer cell line (MDA-MB-231) undergoing subcellular activation of optoFGFR1. White circle indicates illuminated regions; white arrow indicates line-scanned area. (I) mRNA expression level of CaV1.2 in HUVECs transfected with shRNAs (shRNA 1 and 2) or a control vector (control). Data are represented as mean ± SEM. (Scale bars: 20 μm.)
Next, to identify the origin of Ca2+ sparklets, we monitored their frequency in HUVECs treated with various Ca2+ antagonists during optically guided cell movement. Control (untreated) cells exhibited a Ca2+ sparklet frequency of 0.442 mHz (per 100 μm2 cell area) (Fig. 2E). EGTA treatment almost completely blocked these signals (0.018 mHz), confirming their dependence on the influx of Ca2+ from the external environment (Fig. 2E and Fig. S2G). Among Ca2+ channel inhibitors tested, only nimodipine, an L-type voltage-dependent Ca2+ (CaV) channel inhibitor, significantly blocked Ca2+ sparklets (0.065 mHz) without affecting Ca2+ puff generation (Fig. 2E and Fig. S2G). A similar Ca2+ pattern was also observed in the human breast cancer cell line MDA-MB-231 under the same optical-stimulation conditions (Fig. S2H), suggesting the broad implication of Ca2+ sparklets in different biological contexts. We then identified predominant expression of CaV1.2 among L-type CaV channel subtypes (CaV1.1–1.4) (19) in HUVECs (Fig. 2F), and also observed significantly decreased frequency of Ca2+ sparklets by translational knockdown of CaV1.2 by transfecting short hairpin RNA (shRNA) plasmid (Fig. 2G and Fig. S2I). These data demonstrate that CaV1.2 mediates the observed Ca2+ sparklets.
Elucidating the Ca2+ Sparklet-Related Signaling Network.
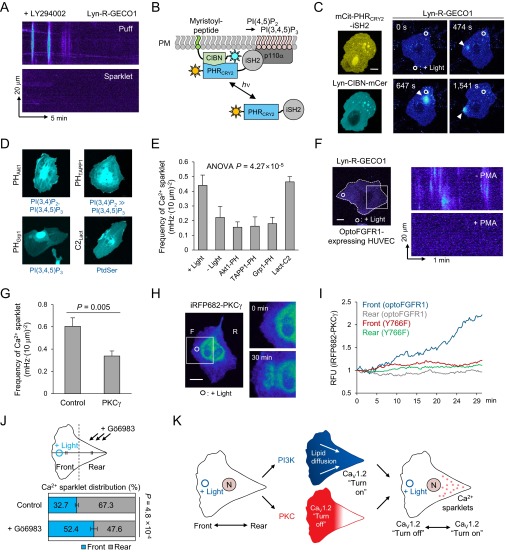
Which signaling pathway is the key inducer of Ca2+ sparklets? Among various RTK downstreams, the phosphoinositide 3-kinase (PI3K) pathway has been suggested to regulate CaV channel activity by changing the lipid composition of the cell membrane (20, 21). In support of this possibility, treatment with LY294002 (PI3K inhibitor) markedly inhibited Ca2+ sparklets in HUVECs optically guided by optoFGFR1 (Fig. S3A). We then applied light-inducible PI3K (11) (Fig. S3B) to verify the individual action of the PI3K signaling node on evoking Ca2+ sparklets in optically guided HUVECs. Local activation of light-inducible PI3K clearly evoked Ca2+ sparklets with a frequency (0.447 mHz) similar to that in optoFGFR1-expressing cells (0.442 mHz) in association with reduced Ca2+ puff activity (Fig. S3C). Next, we investigated whether membrane lipid modulation by PI3K is involved in evoking Ca2+ sparklets and, if so, which PI component is crucial. To this end, we overexpressed pleckstrin homology (PH) domains, which bind to 3-phosphorylated PIs (3-PIs) [PI(3,4)P2 or PI(3,4,5)P3], in HUVECs to prevent the interaction between 3-PIs and other effectors, and measured the frequency of Ca2+ sparklets during optical guidance by optoFGFR1 (Fig. S3D). We found that all PH domains that bind 3-PIs reduced the frequency of Ca2+ sparklets to basal levels (Fig. S3E). These results demonstrate the importance of membrane lipid modulation by the PI3K pathway in evoking Ca2+ sparklets.
Fig. S3.
Ca2+ sparklet-related signaling network. (A) Kymographs (Lyn-R-GECO1) of HUVEC undergoing subcellular activation of optoFGFR1 after LY294002 (PI3K inhibitor) treatment. (B) Schematic representation of light-inducible PI3K. CIBN, N-terminal part of CIB1; iSH2, inter-SH2 region of the p85α regulatory subunit of PI3K. (C, Left) Expression pattern of light-inducible PI3K constructs. (Right) Pseudocolored Lyn-R-GECO1 images of HUVEC during subcellular activation of light-inducible PI3K. Arrowheads indicate Ca2+ sparklets. mCer, mCerulean; mCit, mCitrine. (D) Expression pattern of lipid-binding domains in HUVECs and their binding targets (highlighted with blue characters). (E) Frequency of Ca2+ sparklets in HUVECs overexpressing different lipid-binding domains upon subcellular activation of optoFGFR1. n = 6 (PHTAPP1); n = 7 (−Light, PHGrp1, C2Lact); n = 8 (+Light); n = 9 (PHAkt1). Data are represented as mean ± SEM, one-way ANOVA. One outlier was excluded using a cut-off of 2 SD. (F, Left) Focal illumination of a HUVEC expressing optoFGFR1 and Lyn-R-GECO1. White dotted line depicts cell outline. (Right) Kymograph of Lyn-R-GECO1 (white box) before and after PMA (PKC activator) treatment during local activation of optoFGFR1. (G) Frequency of Ca2+ sparklets in HUVECs overexpressing iRFP682-PKCγ (full length) construct upon subcellular activation of optoFGFR1. n = 8 (control); n = 9 (PKCγ); data are represented as mean ± SEM, two-tailed t test. (H, Left) PKC localization in a HUVEC undergoing subcellular activation of optoFGFR1. (Right) Enlarged images of front region (white box) of an optically guided HUVEC. (I) Quantification of iRFP682-PKCγ signals in front and rear parts of HUVECs optically guided by optoFGFR1 or a PLCγ binding mutant form of optoFGFR1 (Y766F). (J) The effect of Gö6983 (PKC inhibitor) treatment on front–rear distribution of Ca2+ sparklets in migrating HUVECs optically guided by optoFGFR1. n = 6, data are represented as mean ± SEM, two-tailed t test. (K) Proposed mechanism underlying the spatial distribution of Ca2+ sparklets induced by local activation of optoFGFR1. (Scale bars: 20 mm.)
Next, we investigated the mechanism underlying the concentrated localization of Ca2+ sparklets in the rear part of migrating cells (Fig. 2 C and D). As shown in Fig. S3 A–E, it is clear that the FGFR–PI3K–3-PI signaling axis increases the frequency of Ca2+ sparklets above the basal level. In the case of partial activation of optoFGFR1, which mimics a situation in which cells move toward a chemical attractant, we anticipated that 3-PIs generated from the illuminated (front) area could affect membrane lipid composition in the rear part through rapid diffusion through the plasma membrane, owing to their high diffusion coefficient (0.5–2 μm2/s) (22, 23). Consequently, the diffused 3-PIs may act as enhancers of Ca2+ sparklets in the rear part of HUVECs. If this is the case, why are Ca2+ sparklets down-regulated in the front area of the cell? We hypothesized that there is a dominant Ca2+ sparklet-inhibitory signal in the FGFR-activated front region. Among the various downstream signaling pathways engaged by FGFR, we found that protein kinase C (PKC) activation by phorbol 12-myristate 13-acetate (PMA) treatment dramatically suppressed Ca2+ sparklets (Fig. S3F). This suppressive effect was also observed in PKC-overexpressing cells (Fig. S3G). Classic PKC isoforms are known to regulate L-type CaV channel activity through diverse receptor-mediated signaling pathways (24, 25). We also observed PKC recruitment in the front region where optoFGFR1 was locally activated, a response that was absent in cells expressing the PLCγ-binding–deficient optoFGFR1 mutant, Y766F (Fig. S3 H and I). Consistent with this, the PKC inhibitor Gö6983 significantly increased the proportion of Ca2+ sparklets in the front region of optically guided HUVECs (Fig. S3J), indicating that PKC is a major repressor of Ca2+ sparklets in the front region. Collectively, these findings suggest that diffusion of 3-PIs from the illuminated region might enhance the activity of CaV channels in the rear part, and that CaV channels in the front region are simultaneously inhibited by activated PKC (Fig. S3K). This proposed model of signaling coupling between PI3K and PKC provides a plausible explanation for the posteriorly concentrated distribution of Ca2+ sparklets.
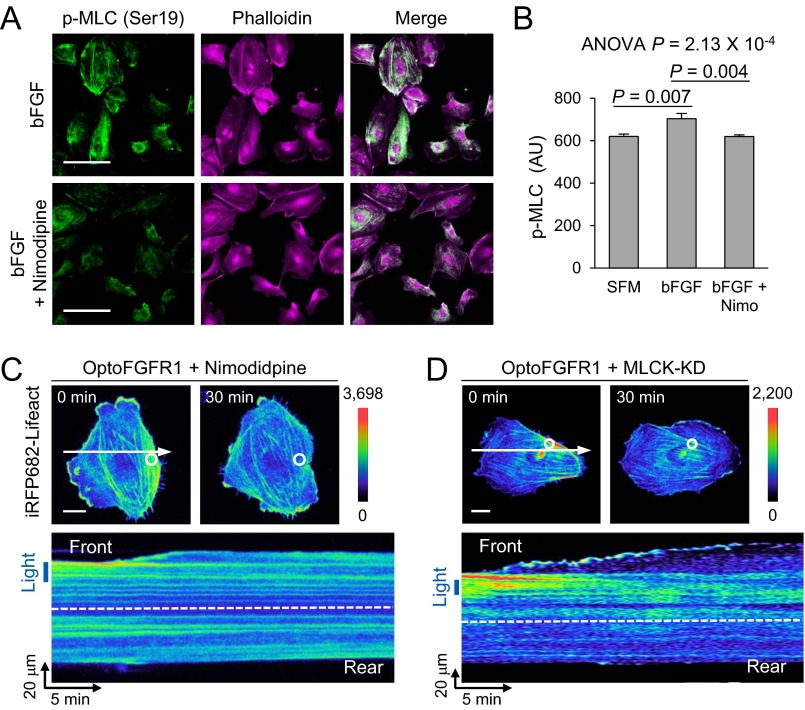
Which signaling pathway is involved in Ca2+-mediated retraction? During muscle/nonmuscle cell contraction, elevated intracellular Ca2+ mediates actomyosin contraction through the calmodulin-dependent myosin light chain kinase (MLCK) signaling pathway (26). Therefore, we evaluated changes in phosphorylated MLC (pMLC) levels induced by treatment of HUVECs with basic fibroblast growth factor (bFGF) in the presence and absence of nimodipine. Immunofluorescence results showed that bFGF increased pMLC levels by 13.4%, and the effect was completely inhibited by preincubation (1 h) with nimodipine (Fig. S4 A and B). Additionally, HUVECs coexpressing kinase-dead MLCK (MLCK-KD) exhibited impaired trailing-edge contraction during optical guidance by optoFGFR1. A similar motile pattern was also observed after nimodipine treatment (Fig. S4 C and D). These results demonstrate that the MLCK pathway is a major signaling mediator of the rear retraction of migrating cells.
Fig. S4.
The effect of Ca2+-mediated MLCK pathway in cell movement. (A) Immunofluorescence images of phalloidin (magenta) and Ser19-phosphorylated MLC (pMLC; green). (B) Quantification of pMLC (Ser19) levels in HUVECs cultured in serum-free media (SFM; n = 72), basic FGF only (bFGF; n = 79), or bFGF with nimodipine preincubation (bFGF + Nimo; n = 79). Data are represented as mean ± SEM, one-way ANOVA. (C and D) (Upper) Pseudocolored images of Lifeact signals in a HUVEC optically guided by optoFGFR1 undergoing treatment with nimodipine (C) or overexpressing kinase dead MLCK (MLCK-KD, D). (Lower) Kymographs of the region represented by white arrows (Upper). White circles and blue boxes indicate illuminated regions; white arrows indicate line-scanned area. [Scale bars: 100 μm (A) and 20 μm (C and D).]
Ca2+ Sparklets Establish a Front–Rear Ca2+ Gradient.
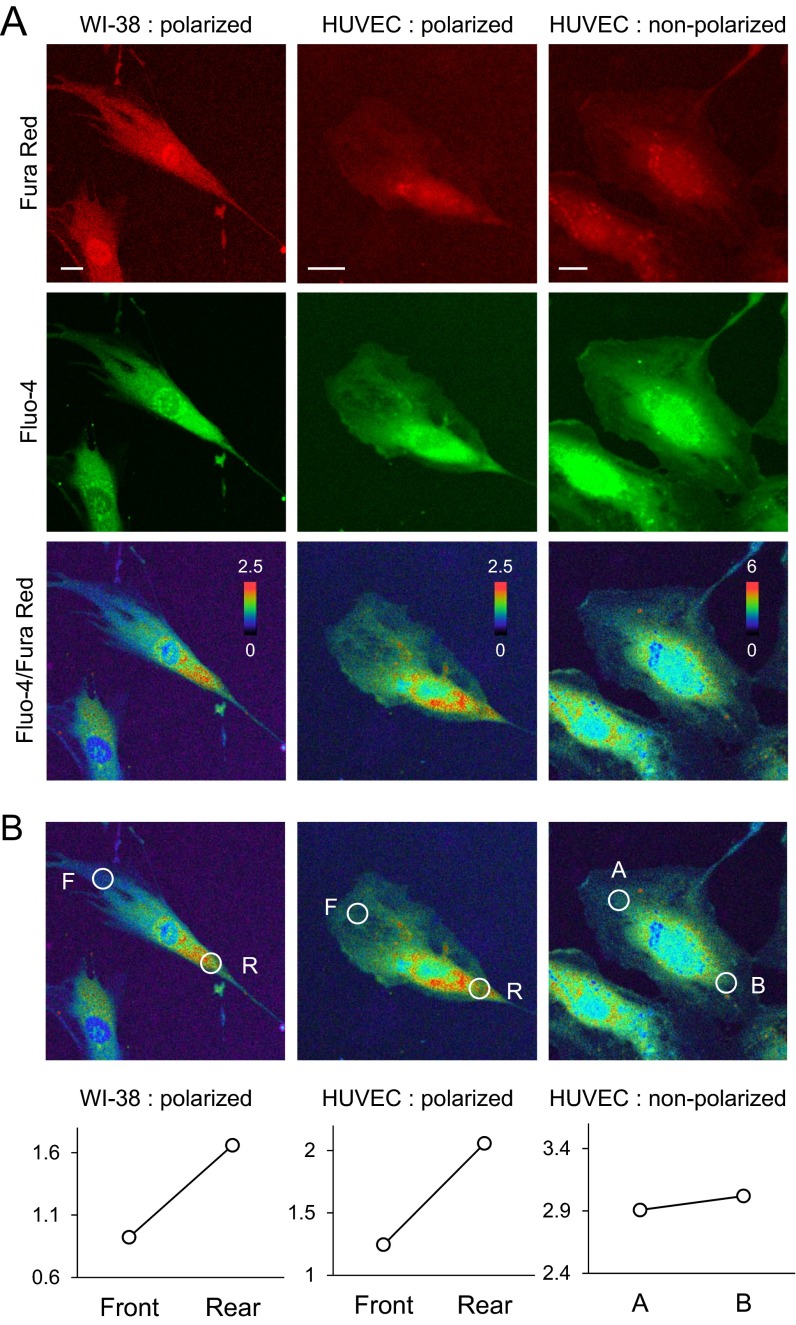
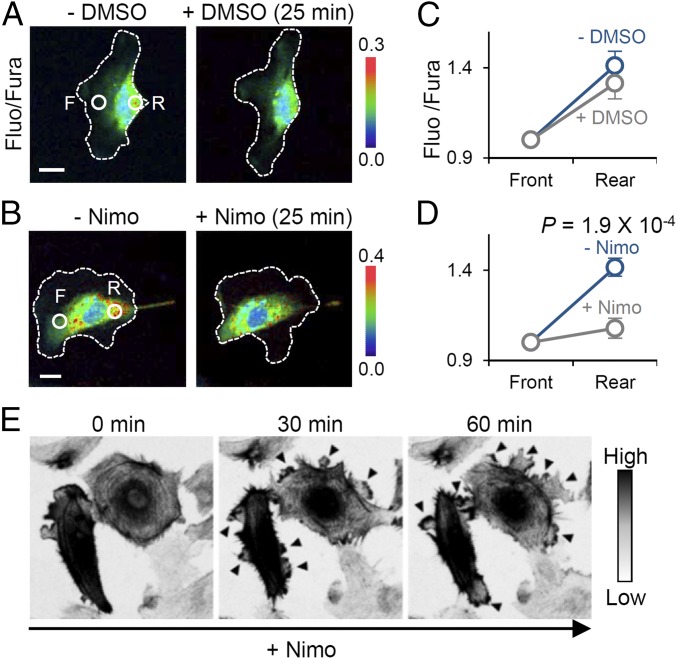
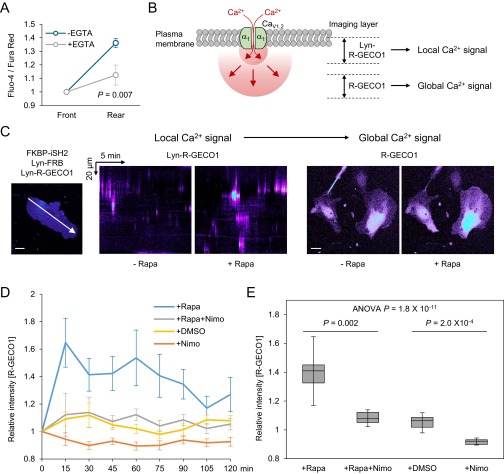
A front-to-rear increasing global Ca2+ gradient during directed cell migration has been extensively reported in diverse cell types (4, 27, 28). We speculated that Ca2+ sparklets contribute to establishing the Ca2+ gradient owing to their spatial concentration in the rear part (Fig. 2 C and D). To support this conjecture, we first confirmed a front-to-rear increasing Ca2+ gradient in directionally migrating HUVECs in a polarized state under serum-supplemented condition using ratiometric Ca2+ measurements (Fluo-4/Fura Red) (29) (Fig. S5 A and B). The method for detecting Ca2+ gradient in our system was validated by demonstrating the presence of a Ca2+ gradient in WI-38 (Wistar Institute 38) human fetal lung fibroblasts (Fig. S5 A and B) known to possess an overtly polarized morphology and Ca2+ gradient (4). We could not guide cells with optogenetic tools under the imaging conditions used for ratiometric Ca2+ measurements, because the method requires excitation by multichannels of laser, including the wavelength used to activate optogenetic modules (∼488 nm). Therefore, we selected migrating HUVECs that retained a well-established Ca2+ gradient and polarized morphology and monitored changes in the gradient upon inhibition of CaV channels. Surprisingly, nimodipine treatment immediately equalized the Ca2+ gradient; by contrast, vehicle (DMSO)-treated cells maintained their rear-increased Ca2+ gradient (Fig. 3 A–D). Additionally, we confirmed that extracellular Ca2+ chelation with EGTA also decreased the steepness of the Ca2+ gradient (Fig. S6A), supporting the conclusion that Ca2+ influx via CaV channels in the form of Ca2+ sparklets is a major player in modulating the intracellular Ca2+ gradient.
Fig. S5.
Representative images of [Ca2+]i gradient detected by ratiometric confocal Ca2+ measurement. (A) Raw images of Fura red (red), Fluo-4 (green), and Fluo/Fura ratio view of WI-38 fibroblast and HUVECs. (B) Quantitative data of [Ca2+]i steepness. White circles indicate the front and rear endpoint for the steepness measurement. F, front; R, rear. (Scale bars: 20 μm.)
Fig. 3.
Front-to-rear Ca2+ gradient and its role in maintaining cell polarity. (A and B) Fluo-4/Fura Red ratio images of a HUVEC before and after treatment with DMSO (A) or nimodipine (B). White dotted lines depict cell outline. F, front; R, rear. (C and D) Change in the steepness of the Ca2+ gradient after treatment with DMSO (n = 9) or nimodipine (n = 9). Data are represented as mean ± SEM, two-tailed t test. (E) Time-lapse images (inverted contrast) of mCherry-Lifeact–expressing HUVECs displaying the spontaneous lamellipodia protrusion after nimodipine treatment. Arrowheads indicate newly formed protrusions. (Scale bars: 20 μm.)
Fig. S6.
The effect of local Ca2+ sparklets in global Ca2+ level. (A) Change in the steepness of the Ca2+ gradient of HUVECs after treatment with EGTA. n = 14. Data are represented as mean ± SEM, two-tailed t test. (B) Experimental design for detecting local and global intracellular Ca2+ signals using Lyn-R-GECO1 (plasma membrane) and R-GECO1 (cytoplasm), respectively. (C) The changes of local and global Ca2+ patterns detected by Lyn-R-GECO1 (Left) and R-GECO1 (Right) upon activation of chemically inducible PI3K. A total of 500 nM chemical dimerizer (rapamycin; +Rapa) was treated to HUVECs coexpressing FKBP-iSH2, Lyn-FRB, and either R-GECO1 biosensor. White arrow indicates line-scan region for kymographs of Lyn-R-GECO1 images. (D) Time-course changes in R-GECO1 intensity upon modulation of the Ca2+ sparklet activity. (E) The relative changes for 2 h in global Ca2+ level upon modulation of the Ca2+ sparklet activity. n > 35 in all groups. Data are represented as mean ± SEM (B) or median ± min/max (C), one-way ANOVA (raw P values were adjusted by Bonferroni correction). (Scale bars: 20 μm.)
Next, to demonstrate the relationship between the Ca2+ sparklets and the front–rear gradient, we tested whether local Ca2+ sparklets can modulate global Ca2+ levels. To conditionally evoke Ca2+ sparklets, we applied chemically inducible PI3K (30, 31), which generates 3-PIs upon treatment with the chemical dimerizer, rapamycin. Using the membrane-tethered Ca2+ biosensor, Lyn-R-GECO1, we confirmed that 3-PIs generated by rapamycin treatment dramatically increased the frequency of local Ca2+ sparklets in HUVECs without inducing Ca2+ puffs (Fig. S6C). Using the same conditions except replacing Lyn-R-GECO1 with R-GECO1, which is better suited to visualizing global [Ca2+]i changes, owing to its cytoplasmic location and higher diffusion rate (Fig. S6B), we observed that rapamycin treatment remarkably increased global Ca2+ levels (Fig. S6 D and E). Notably, combined treatment with rapamycin and nimodipine almost completely abolished this increase, and treatment with nimodipine alone significantly decreased basal Ca2+ levels (P = 2.0 × 10⁻⁴; Fig. S6 D and E). These data indicate that local Ca2+ sparklets mediated by CaV channels can modulate global Ca2+ levels, and thus provide indirect, but strong, evidence demonstrating the role of asymmetric sparklets in generating global Ca2+ gradients.
Next, we evaluated morphological changes of HUVECs following perturbation of Ca2+ gradients by nimodipine treatment. Immediately after nimodipine treatment, Lifeact-expressing HUVECs under serum-supplemented conditions displayed multiple and spontaneous protrusions along the entire cell edge (Fig. 3E). Regulated formation of lamellipodia is required for directionally persistent cell migration; conversely, increased numbers of lamellipodia reflect randomized directionality with reduced responsiveness to external cues (2). Applying this concept, these morphological changes could be interpreted to mean the CaV channel-mediated Ca2+ gradient is important for regulating cell directionality in directional migration.
Effects of the CaV Channel-Mediated Ca2+ Gradient on Directed Cell Migration.
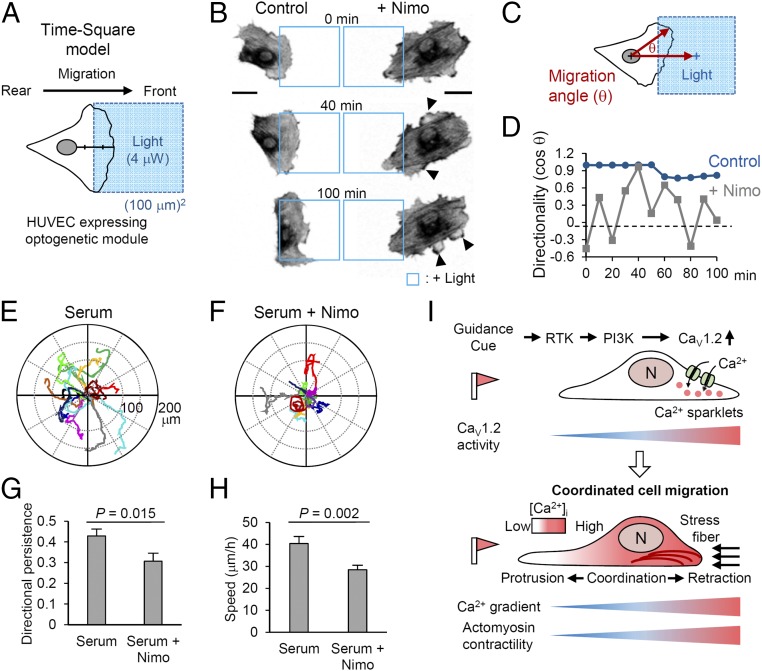
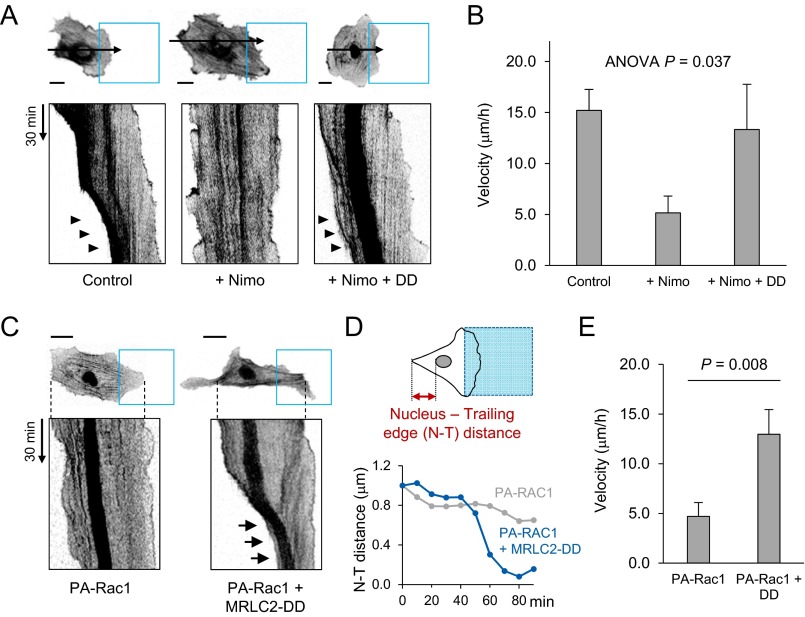
To dissect the function of the CaV1.2-mediated Ca2+ gradient in motile behavior in greater detail, we designed a “time-square model,” which guides the reproducible migration of an individual cell through a standardized, square-shaped optical input (488 nm, 4 μW, 30-s intervals) with time-course live imaging (Fig. 4A). In the time-square model, optoFGFR1-expressing HUVECs exhibited well-defined leading and trailing edges that were thoroughly coordinated during migration toward the illuminated region (Fig. 4B and Movie S2). However, upon perturbing the Ca2+ distribution by nimodipine treatment, the direction of migrating HUVECs was frequently altered by spontaneous membrane protrusions from the trailing edge, resulting in unstable directionality (Fig. 4 C and D). Resultantly, the cell failed to move inside the “blue square” (Fig. 4B and Movie S3). In addition to abrogating front–rear coordination, nimodipine also dramatically decreased migration velocity (control: 15.2 μm/h; +nimodipine: 3.4 μm/h). Interestingly, these effects of nimodipine were markedly rescued by coexpression of an MLC-phosphomimetic mutant (MRLC2-DD), which enhances MLCK downstream activity (Fig. S7 A and B). Thus, this exquisitely designed optogenetic model clearly revealed that the Ca2+ gradient acts as a crucial mediator of sustained directionality as well as migration efficiency through modulation of actomyosin contractility.
Fig. 4.
Effects of the front-to-rear Ca2+ gradient on motile pattern. (A) Basic scheme of the time-square model. A square-shaped blue light (blue box) illuminates an area in the anterior half (midpoint between front edge and border of nucleus) of HUVECs expressing an optogenetic module. See SI Materials and Methods. (B) Lifeact images (inverted contrast) of directionally migrating HUVECs under optoFGFR1 guidance (time-square model), with and without nimodipine treatment. Blue squares represent the illuminated region; arrowheads indicate lateral lamellipodia. (C) Schematic illustration of the method for determining migration angle (θ), where θ is the angle between the migrating direction and the central axis of the illuminated region. (D) Time course of the directionality (cos θ) of an optoFGFR1-expressing HUVEC (blue) and the cell treated with nimodipine (gray). (E and F) Migrating paths of HUVECs (10 h) in serum-supplemented media with and without nimodipine treatment. (G and H) Directional persistence (displacement/total path) and speed of migrating HUVECs. n = 50 (serum) and n = 40 (serum + Nimo). Data are represented as mean ± SEM, two-tailed t test. (I) Proposed model of front–rear coordination in directed cell migration. Polarized CaV1.2 activity establishes a Ca2+ gradient that maintains cell polarity by inducing actomyosin contractility in the rear part of the migrating cell. (Scale bars: 20 μm.)
Fig. S7.
The role of Ca2+ sparklet in front–rear coordination. (A and B) Motile pattern (A) and migration velocity (B) of optoFGFR1-expressing HUVECs in the time-square model. Blue squares represent the illuminated region; arrows indicate line-scanned area; arrowheads indicate rear retraction. Control: DMSO treatment, n = 10; +Nimo: nimodipine treatment, n = 12; +Nimo +DD: nimodipine treatment in cells expressing phosphomimetic mutant of MRLC2-DD, n = 12. Data are represented as mean ± SEM, one-way ANOVA. (C) iRFP682-Lifeact and FusionRed-Nuc (nucleus marker) signals (inverted contrast) of HUVECs without (Left) or with (Right) MRLC2-DD overexpression under optically induced directional migration. Blue boxes indicate illuminated regions. Arrows highlight rear retraction and nucleus movement. (D) Time course of changes in nucleus–trailing edge (N–T) distance of the cells in C. (E) Velocity of HUVECs expressing PA-Rac1 (PA-Rac1, n = 8) or coexpressing PA-Rac1 and MRLC2-DD (PA-Rac1 + DD, n = 8) undergoing optically induced directional migration. Data are represented as mean ± SEM, two-tailed t test. (Scale bars: 20 μm.)
We showed that active retraction of the rear part in response to localized illumination only occurs in cells expressing optoFGFR1, but the retraction was less active in those expressing PA-Rac1 (Fig. 1 B–D). This, taken together with the observed rescue of nimodipine-impaired directional migration, suggests that coexpression of MRLC2-DD could alter the motile pattern of PA-Rac1–expressing cells to yield rear contractility similar to that of optoFGFR1-expressing cells. In the time-square model, cells coexpressing PA-Rac1 and MRLC2-DD showed an elongated morphology and efficiently moved into the illuminated region with active rear contraction, whereas cells expressing PA-Rac1 only showed delayed migration with a dragging rear part (Fig. S7C). Notably, the retractile force produced by MRLC2-DD propelled forward movement of the nucleus (nucleokinesis), reflecting efficient bodily movement of the cell. We also found that the nucleus-to-trailing edge (N–T) distance was remarkably shortened (−37.29 μm/h) in MRLC2-DD coexpressing cells, providing further support for rear retraction (Fig. S7D). Coexpression of MRLC2-DD also significantly increased migration velocity (13.0 μm/h) compared with cells expressing PA-Rac1 only (4.7 μm/h) (Fig. S7E). These results highlight the importance of the traction force driven by actomyosin crosslinking of the rear part in front–rear coordination during directional cell migration. Finally, we tracked the autonomous movement (chemokinesis) of HUVECs under serum-supplemented conditions, and evaluated their patterns upon nimodipine treatment. Interestingly, whereas normal cells moved along a linear path, CaV channel-blocked cells showed a winding migration pattern, indicating frequent changes of direction (Fig. 4 E and F and Movie S4). This different migration mode is clearly evidenced by a significant decrease in directional persistence (displacement/total path, serum: 0.43; serum + nimodipine: 0.31) and speed (serum: 40.4 μm/h; serum + nimodipine: 28.4 μm/h) in nimodipine-treated cells (Fig. 4 G and H).
Collectively, the results of diverse migration studies clearly show that an asymmetric Ca2+ distribution coordinates directional cell movement by maintaining actomyosin contractility in the rear part, which is crucial for stabilizing the directional persistence of migrating cells (Fig. 4I).
Discussion
Our study introduces the spatial roles of Ca2+ sparklets derived from CaV1.2 channels in coordinating endothelial cell migration. Various excitable cells heterogeneously express L-type CaV channels, and the biological functions of these channels, such as neuronal transmission and muscle contraction, have been extensively studied. However, the function and regulatory mechanism of L-type CaV channels in nonexcitable cells has rarely been studied, especially in mesenchymal cell migration. L-type CaV channels are up-/down-regulated via multiple signaling mediators induced by extracellular stimuli (32). In particular, studies of RTK-mediated CaV channel regulation have reported conflicting results—tyrosine kinase-dependent increase or decrease in L-type CaV channel currents—depending on biological contexts (33, 34). In the current study, we observed that the PLCγ–PKC cascade and lipid modulation by PI3K, two representative downstream pathways of RTK, act as dominant inhibitory and triggering signals for Ca2+ sparklets, respectively. Intriguingly, these RTK downstream pathways elicit site-specific effects through signal coupling (possibly including cross-talk) in leading or trailing parts of a single cell, yielding a rear-concentrated pattern of Ca2+ sparklets (Fig. S3K). However, dissecting the complete mechanism will require further investigation of additional signaling components involved in patterning front-rear Ca2+ signals in migrating cells.
We also demonstrated that the localized Ca2+ sparklets from L-type CaV channel are crucial mediators in the establishment of front-to-rear increasing Ca2+ gradients. During directional migration, an increasing front-to-rear pattern of intracellular Ca2+ level has been commonly observed in diverse cell types, but the mechanism by which the Ca2+ gradient is generated is largely unknown. Evidence to date has shown that local Ca2+ transients in many types of migrating cells, including stretched keratocytes (5) and fibroblasts (4) as well as collectively migrating HUVECs (28, 35), are actually located in the front region of the cell, creating challenges for defining front-to-rear Ca2+ gradients. In this study, we directly visualized Ca2+ sparklets, which were mainly located in the rear part of the cells, by applying an optical guidance model and showed that blocking L-type CaV channels rapidly abolished the Ca2+ gradient and reduced the directional persistency of the cells. These findings provide clear evidence for the generating mechanism of front–rear Ca2+ gradients, suggesting a novel role of CaV channels in the directional migration of nonexcitable cells.
In this work, we have also sought to provide representative guidelines for using optogenetic toolkit in biological studies, especially in directed cell migration. Previously used methods for recapitulating directional migration require complex machinery or are not easily reversible or repeatable. The optogenetic approach provides an elegant experimental strategy that is suitable for implementation on a conventional microscope setup providing subsecond and submicrometer precision. Moreover, optogenetic tools are uniquely capable of modulating specific signaling nodes in a specified region and at specific time points, offering an unparalleled method for assessing cellular responses between activated and unactivated regions of a single cell (10, 36). In our studies, we perturbed individual signaling nodes comprising the RTK signaling cascade using optoFGFR1 or PA-Rac1 and assessed cellular movement. This comparative approach proved decisive in revealing that the efficiency of front–rear coordination depends on a different hierarchy of signaling: optoFGFR1 produces more robust rear contraction compared with the PA-Rac1 (Fig. 1 B–D). In addition, directly activating the PI3K cascade using light-inducible PI3K enabled us to elucidate a core signaling requirement for the induction of Ca2+ sparklets (Fig. S3 B and C). The direct access to individual signaling nodes provided by optogenetic tools is a powerful asset in dissecting the mechanisms underlying biological events in which multiple signaling pathways are orchestrated. Collectively, these superior properties—excellent spatiotemporal resolution and direct signal accessibility—clearly justify the use of an optogenetic toolkit in the diverse biological fields.
Our study results, taken together, establish a clear pathway that links local Ca2+ signals and front–rear coordination during directed cell migration.
Materials and Methods
HUVECs (Gibco) were transfected using the Neon Transfection System (Invitrogen). Transfected cells were plated on plastic-bottom 96-well plates (Ibidi) coated with collagen solution (Advanced Biomatrix). Live-cell imaging was conducted using a Nikon A1R confocal microscope. Optogenetic modules were stimulated by photoactivation using a 488-nm laser emitted through a Galvano scanner (Nikon). Detailed experimental procedures are provided in SI Materials and Methods.
SI Materials and Methods
Reagents.
The following reagents were used at the indicated concentrations in this study: LY294002 (50 μM; LC Laboratories, l-7962), streptomycin (200 μM; Sigma, S6501), 2-aminoethoxydiphenyl borate (100 μM; Sigma, D9754), nimodipine (50 μM; Sigma, N149), rapamycin (500 μM; LC Laboratories, R-5000), phorbol 12-myristate 13-acetate (200 nM; Sigma, P1585), Gö6983 (5 μM; Santa Cruz Biotechnology, sc-21 203432) dissolved in dimethyl sulfoxide (DMSO; Sigma, D8418); Fluo-4 (1 μM; Molecular Probes, F14201), and Fura-RED (1 μM; Invitrogen, f-6774) in Pluronic F-127 (Life Technologies, P-3000MP); bFGF (100 ng/mL; Peprotech, 100–18B) in 5 mM Tris (pH 7.6); and EGTA (2 mM; Sigma, E3889) in 1 M NaOH solution.
Plasmids.
The optoFGFR1 (Lyn-cytoFGFR1-PHRCRY2-mCitrine) and optoFGFR1–Y766F construct was described previously (12). The following constructs were purchased from Addgene: pTriEx-mVenus-PA-Rac1 was a gift from Klaus Hahn, University of North Carolina, Chapel Hill, NC (Addgene plasmid no. 22007) (7); piRFP682-N1 was a gift from Vladislav Verkhusha, Albert Einstein College of Medicine, Bronx, NY (no. 45459) (37); and pEGFP-HeLa kinase-dead MLCK was a gift from Anne Bresnick, Albert Einstein College of Medicine, Bronx, NY (no. 46317) (38); and pLKO.1–TRC cloning vector and pLKO.1–TRC control vector were a gift from David Root, Broad Institute of Massachusetts Institute of Technology and Harvard University, Cambridge, MA (nos. 10878 and 10879) (39). Multicolored Lifeact constructs were cloned by replacing the GFP sequence in pGFP-Lifeact vector (13) with FP-encoding sequences from the pECFP-C1 (Clontech), pmCherry-C1 (Clontech), and piRFP682-N1 vectors. To generate membrane targeted R-GECO1 (Lyn-R-GECO1), myristoylation sequence of LYN (amino acids 1–11) fused with (SAG)3 linker was flanked to the N terminus of R-GECO1 by PCR and inserted into an empty pCMV vector. Plasmids encoding ECFP-PH domains were generated by cloning cDNA encoding the PH domain of protein kinase B (Akt1; amino acids 130–480), Bruton's tyrosine kinase (BTK; amino acids 1–171), tandem PH domain-containing protein 1 (TAPP1; amino acids 180–404), and general receptor of phosphoinositides 1 (Grp1; amino acids 240–399) into pECFP-C1 (Clontech). To generate the light-inducible PI3K system (11), we used the sequence encoding the photolyase homology region of cryptochrome 2 (PHRCRY2; amino acids 1–498) that was codon optimized for mammalian expression (40), and the N-terminal part of CIB1 (CIBN; amino acids 1–147) from Arabidopsis thaliana (9). The mCitrine-PHRCRY2-iSH2 construct was generated by fusing an (SG7)3 linker to the C terminus of PHRCRY2 by PCR-driven extension, and cloning the insert into the pmCitrine-C1 vector (Clontech). Then, the iSH2 domain of p85β (amino acids 420–615) was inserted into the C terminus of the mCitrine-PHRCRY2-(SG7)3 vector. Lyn-CIBN-mCerulean was cloned by replacing the cytoFGFR1-PHRCRY2 region in optoFGFR1 with CIBN, and the mCitrine region with mCerulean. For construction of the phosphomimetic mutant of MLC, cDNA encoding myosin regulatory light chain 2 (MRLC2) was mutated at T18D and S19D (41) through PCR-driven overlap extension. The mutated construct (MRLC2-DD) was inserted into the piRFP682-N1 vector. FusionRed-Nuc was constructed by replacing the ECFP sequence in the pECFP-Nuc nuclear marker (Clontech) with a synthetic FusionRed-encoding sequence (GenScript). The Lyn-FRB was generated as previously described (30), and mCit-FKBP-iSH2 was cloned by replacing CFP sequence in CFP-FKBP-iSH2 (31) with mCitrine encoding sequence from the pmCitrine-C1. To generate iRFP682-PKCγ, cDNA encoding full length of Rat PKCγ was cloned into iRFP682-C1 vector.
Cell Culture and Preparation.
HUVECs (Gibco, 26140-079) were cultured in Medium 200 (Gibco, M-200-500) supplemented with 2% (vol/vol) low-serum growth supplement (LSGS; Gibco, S-003-10) at 37 °C in a humidified 5% (vol/vol) CO2 environment. HUVECs between 5 and 10 population doublings were used for all experiments. MDA-MB-231 cells (American Type Culture Collection) were maintained in DMEM (Gibco, 11995-065) containing 10% (vol/vol) FBS (Gibco, 26140-079) at 37 °C with 10% (vol/vol) CO2. WI-38 cells (Korean Cell Line Bank, 10075) were grown in Eagle's minimum essential medium (MEM; Gibco, 11095-080) with 10% (vol/vol) FBS at 37 °C with 5% (vol/vol) CO2. Cells were transfected using the Neon Transfection System (Invitrogen) under the following conditions: two pulses of 1,350 V for 30 ms for HUVECs and two pulses of 950 V for 30 ms for MDA-MB-231 cells. Transfected cells were plated on plastic-bottom 96-well plates (Ibidi, 89621) coated with 300 μg/mL collagen solution (Purecol; Advanced Biomatrix, 5005-B) at 37 °C for 1 h for HUVECs or 100 ng/mL fibronectin (Sigma, F0895) at 37 °C for 30 min for MDA-MB-231 cells and WI-38 cells. Plated cells were incubated for at least 24 h before experiments. HUVECs were serum starved by culturing in human endothelial serum-free medium (SFM; Gibco, 11111-044) containing 0.1% BSA for at least 6 h before experiments. For live imaging of MDA-MB-231 cells and WI-38 cells, growth medium was replaced with extracellular buffer solution (119 mM NaCl, 2.5 mM KCl, 2 mM CaCl2, 2 mM MgCl2, 30 mM glucose, and 25 mM Hepes) containing 1% FBS.
Live-Cell Imaging and Photoactivation.
Live-cell imaging was conducted using a Nikon A1R confocal microscope mounted onto a Nikon Eclipse Ti body equipped with a CFI Plan Apochromat 40× objective (0.95 N.A.; Nikon), 60× oil-based objective (1.4 N.A.; Nikon), and lasers with wavelengths of 457 nm (cyan), 514 nm (yellow), 561 nm (red), and 640 nm (infrared). For investigation of Ca2+ dynamics (Fig. S2D), time-lapse images were acquired at 500-ms intervals using a spinning-disk confocal microscope system (Revolution XD; Andor) composed of a Nikon Eclipse Ti body, a CSU-X spinning-disk confocal scanhead (Yokogawa), and a CFI Plan Apochromat oil-based objective (60×, 1.4 N.A.; Nikon). For tracking the movement of HUVECs, time-lapse images were acquired using an ImageXpress micro XL high-content screening imaging system (Molecular Devices) with a CFI Plan Apochromat 20× objective (0.45 N.A.; Nikon), CFP filter set (438/483 nm, dichroic 458 nm; Semrock), and TRITC filter set (543/593 nm, dichroic 562 nm; Semrock).
Photoactivation was performed using a 488-nm laser emitted through a Galvano scanner incorporated in a hybrid confocal scan head containing a high-speed hyper selector (Nikon). The size and shape of the region of illumination were adjusted using the photoactivation module in Nikon imaging software (NIS-elements AR, 64-bit, version 3.21; Laboratory Imaging). Generally, optogenetic experiments were performed by repeated illumination (1 μW) with 15-s intervals. In the time-square model (Fig. 4A), optical input was standardized to a (100 μm2) square shape (4 μW, 30-s intervals) and was set to illuminate the anterior half area of an individual cell (midpoint between the front edge and the border of nucleus). The photoactivation intensity of the laser varied from 1 to 4 μW, which corresponds to 1.30–5.20 μW/cm2.
shRNA Experiment.
Short hairpin RNAs (shRNAs) for targeting human CaV1.2 were designed using a RNAi design program (www.broadinstitute.org/rnai/public/seq/search) and were inserted into pLKO.1–TRC cloning vector by AgeI/EcoRI restriction enzyme. CaV1.2 shRNAs and control shRNA constructs were transfected into HUVECs using the Neon Transfection System. For the experiments, transfected cells were incubated for 48 h.
The shRNA sequences specific for CaV1.2 are as follows: CaV1.2 shRNA-1-Fwd: 5′-CCGGGTGGCCTTAGCG ATCTATATTCTCGAGAATATAGATCGCTAAGGCCACTTTTTG-3′ and CaV1.2 shRNA-1-Rev: 5′-AATTCAAA AAGTGGCCTTAGCGATCTATATTCTCGAGAATATAGATCGCTAAGGCCAC-3′; CaV1.2 shRNA-2-Fwd: 5′-CCGGCACCACCTGGATGAGTTTAAACTCGAGTTTAAACTCATCCAGGTGGTGTTTTTG-3′ and CaV1.2 shRNA-2-Rev: 5′-AATTCAAAAACACCACCTGGATGAGTTTAAACTCGAGTTTAAACTCATCCAGGTG GTG-3′. The nonhairpin shRNA sequence for control vector is as follows: 5′-CCGCAGGTATGCACGCGT-3′.
Real-Time PCR.
Total RNA was isolated from HUVECs using the TRIzol reagent (Ambion, 45596-026), and cDNA was synthesized from 1 μg of total RNA using the SuperScript III First-Strand Synthesis System (Invitrogen, 1080-051), according to the manufacturer’s instructions. PCR reactions were carried out with the CFX96 real-time PCR detection system (Bio-Rad) using cDNAs as a template. CaV1.1–4 expression were assayed in triplicate using Real-Time Smart Mix (SRH71-M40h; Solgent) with the following thermocycling protocol: 95 °C for 3 min, followed by 45 cycles of 95 °C for 20 s, 55 °C for 40 s, and 72 °C for 15 s. CaV subtype-specific primers used in PCR were designed using Primer3 (biotools.umassmed.edu/bioapps/primer3_www.cgi). The sequences of primers are as follows:
CaV1.1-Fwd: 5′-ACATCCTCAATGTGGCCTTC-3′ and CaV1.1-Rev: 5′-CTCCACCCAGGCAATACAGT-3′; CaV1.2-Fwd: 5′-CGCTGCAGGAGAGTTTTACC-3′ and CaV1.2-Rev: 5′-CTCTCCCAAACCCACCTGTA-3′; CaV1.3-Fwd: 5′-CGGGATTAAGGACACTGCAT-3′ and CaV1.3-Rev: 5′-GTGGGTGGTATTGGTCTGCT-3′; CaV1.4-Fwd: 5′-CTGCCCTGGGTGTACTTTGT-3′ and CaV1.4-Rev: 5′-CTCTTCGGCTTGAGTGATCC-3′; GAPDH-Fwd: 5′-TCAACGACCACTTTGTCAAGCTCA-3′ and GAPDH-Rev: 5′-GCTGGTGGTCCAGGGG TCTTACT-3′.
Immunofluorescence.
HUVECs were incubated on 96-well plates at a density of 0.5 × 10⁴ cells per well for 24 h and then serum starved by culturing with SFM containing 0.1% BSA for 10 h. In the nimodipine group, cells were preincubated with 50 μM nimodipine for 1 h. After bFGF treatment (100 ng/mL, 1 h), all treated wells were rinsed with PBS, fixed by 4% (vol/vol) formaldehyde for 20 min at room temperature, and then washed three times with PBST (PBS supplemented with 0.1% Tween-20) for 5 min on an orbital shaker. Next, washed cells were permeabilized with PBSX (PBS containing 0.1% Triton X-100) for 15 min, then rewashed three times for 10 min each with PBST and incubated with blocking solution [0.1% BSA + 10% (vol/vol) FBS in PBS] for 1 h. After the blocking procedure, cells were incubated with rabbit anti–phospho-MRLC2 (1:300 dilution; Cell Signaling, no. 3671) overnight at 4 °C. After washing five times (10-min each) at room temperature with PBST, cells were incubated with Alexa Fluor 488-conjugated donkey anti-rabbit IgG (1:500 dilution; Invitrogen, A21206) and Alexa Fluor 594-conjugated phalloidin (165 nM; Molecular Probes, A12381) in PBST for 1 h. Images were acquired with ImageXpress micro XL equipped with a CFI Plan Apochromat 20× objective and 40× objective (0.75 N.A.; Nikon) using GFP (472 nm/520 nm, dichroic 495 nm; Semrock) and TRITC filter sets.
Image Analysis.
Pseudocolored images, kymographs, and protrusion/retraction maps were processed using NIS-Elements and MetaMorph software (v7.7; Molecular Devices). Ca2+ frequency was calculated from the number of Ca2+ sparklets per cell area (100 μm2) per unit time (1 h). The number of Ca2+ sparklets was counted using criteria based on the measured kinetics of the signal (Fig. S2 B–D): an approximately threefold increase in fluorescent intensity, 1–10-μm signal width, and ∼6-s duration. Mean cell area was measured using an annotated measurement module in NIS-Elements. For quantification of MLC phosphorylation intensity, the mean pMLC intensity of each single cell in randomly selected imaging fields was measured using the region measurement module in MetaMorph software. Cell motion analyses were conducted by tracking FusionRed-Nuc signals (10–50 pixel diameter) of migrating cells using the multidimensional motion analysis module in MetaMorph software. Measured XY coordinates of cells were used to calculate directional persistence (displacement/total path length), velocity (displacement/time), and speed (total path length/time). Migration angle (θ) was defined as the angle between the segment connecting the most-protruded point of a migrating cell to the centroid of the nucleus and the segment connecting the centroid of the illuminated region and nucleus (Fig. 4C). Cell directionality was calculated as cos θ.
To analyze kinetics of Ca2+ sparklets, T1/2on and T1/2off, respectively, we calculated by fitting intensity plot of Lyn-R-GECO1 versus time to a four parameter logistic function as previously described (42). Nonlinear curve fitting was used through the use of the Solver tool in Excel (Microsoft). To analyze the duration of Ca2+ sparklets, resting GECO intensity (RGI) was calculated by averaging intensities of Lyn-R-GECO1 measured in the initial five timepoints (2.5 s), and the amplitude was derived from subtracting maximum intensity of Lyn-R-GECO1 by RGI. The 10% maximum value was calculated by adding the numerical value corresponding to 10% of amplitude to RGI. Finally, the duration was presented as the time between two points aligned on 10% maximum linear curve either before or after the increment or decrement of intensity, respectively (43).
Ratiometric value of Fluo-4 to Fura Red was used for calculation of Ca2+ gradient in migrating HUVECs and WI-38 cells. Based on the cell morphology, foremost region exhibiting stable fluorescence intensity over time and rearmost region displaying high ratiometric value were defined as front and rear endpoint, respectively. All endpoint regions should not contain cellular structure or intracellular organelle showing loss of dye signal or different Ca2+ concentrations, such as the edge of protrusion, endosome, and nucleus. Ca2+ gradient of HUVECs were analyzed in a blinded fashion to exclude bias in the evaluation process (Fig. 3 A–D).
Statistical Analysis.
For each experiment, at least two biological replicates were performed. The difference between two groups was evaluated by two-tailed t test. Multiple significance tests were performed using one-way ANOVA, and pairwise differences between groups were determined using a two-tailed t test with Bonferroni correction. Statistical outliers were excluded using a 2-SD or 3-SD cut-off. Statistical analyses were performed using Analysis ToolPak-VBA in Excel.
Supplementary Material
Acknowledgments
We thank Y. J. Jo (KAIST) for brilliant video processing algorithms. This work was supported by the Institute for Basic Science (IBS-R001-G1) and KAIST Institute for the BioCentury, Republic of Korea.
Footnotes
The authors declare no conflict of interest.
This article is a PNAS Direct Submission.
This article contains supporting information online at www.pnas.org/lookup/suppl/doi:10.1073/pnas.1518412113/-/DCSupplemental.
References
- 1.Ridley AJ, et al. Cell migration: Integrating signals from front to back. Science. 2003;302(5651):1704–1709. doi: 10.1126/science.1092053. [DOI] [PubMed] [Google Scholar]
- 2.Petrie RJ, Doyle AD, Yamada KM. Random versus directionally persistent cell migration. Nat Rev Mol Cell Biol. 2009;10(8):538–549. doi: 10.1038/nrm2729. [DOI] [PMC free article] [PubMed] [Google Scholar]
- 3.Tadross MR, Dick IE, Yue DT. Mechanism of local and global Ca2+ sensing by calmodulin in complex with a Ca2+ channel. Cell. 2008;133(7):1228–1240. doi: 10.1016/j.cell.2008.05.025. [DOI] [PMC free article] [PubMed] [Google Scholar]
- 4.Wei C, et al. Calcium flickers steer cell migration. Nature. 2009;457(7231):901–905. doi: 10.1038/nature07577. [DOI] [PMC free article] [PubMed] [Google Scholar]
- 5.Lee J, Ishihara A, Oxford G, Johnson B, Jacobson K. Regulation of cell movement is mediated by stretch-activated calcium channels. Nature. 1999;400(6742):382–386. doi: 10.1038/22578. [DOI] [PubMed] [Google Scholar]
- 6.Yang S, Huang XY. Ca2+ influx through L-type Ca2+ channels controls the trailing tail contraction in growth factor-induced fibroblast cell migration. J Biol Chem. 2005;280(29):27130–27137. doi: 10.1074/jbc.M501625200. [DOI] [PubMed] [Google Scholar]
- 7.Wu YI, et al. A genetically encoded photoactivatable Rac controls the motility of living cells. Nature. 2009;461(7260):104–108. doi: 10.1038/nature08241. [DOI] [PMC free article] [PubMed] [Google Scholar]
- 8.Levskaya A, Weiner OD, Lim WA, Voigt CA. Spatiotemporal control of cell signalling using a light-switchable protein interaction. Nature. 2009;461(7266):997–1001. doi: 10.1038/nature08446. [DOI] [PMC free article] [PubMed] [Google Scholar]
- 9.Kennedy MJ, et al. Rapid blue-light-mediated induction of protein interactions in living cells. Nat Methods. 2010;7(12):973–975. doi: 10.1038/nmeth.1524. [DOI] [PMC free article] [PubMed] [Google Scholar]
- 10.Tischer D, Weiner OD. Illuminating cell signalling with optogenetic tools. Nat Rev Mol Cell Biol. 2014;15(8):551–558. doi: 10.1038/nrm3837. [DOI] [PMC free article] [PubMed] [Google Scholar]
- 11.Idevall-Hagren O, Dickson EJ, Hille B, Toomre DK, De Camilli P. Optogenetic control of phosphoinositide metabolism. Proc Natl Acad Sci USA. 2012;109(35):E2316–E2323. doi: 10.1073/pnas.1211305109. [DOI] [PMC free article] [PubMed] [Google Scholar]
- 12.Kim N, et al. Spatiotemporal control of fibroblast growth factor receptor signals by blue light. Chem Biol. 2014;21(7):903–912. doi: 10.1016/j.chembiol.2014.05.013. [DOI] [PubMed] [Google Scholar]
- 13.Riedl J, et al. Lifeact: A versatile marker to visualize F-actin. Nat Methods. 2008;5(7):605–607. doi: 10.1038/nmeth.1220. [DOI] [PMC free article] [PubMed] [Google Scholar]
- 14.Wilson CA, et al. Myosin II contributes to cell-scale actin network treadmilling through network disassembly. Nature. 2010;465(7296):373–377. doi: 10.1038/nature08994. [DOI] [PMC free article] [PubMed] [Google Scholar]
- 15.Berridge MJ, Bootman MD, Roderick HL. Calcium signalling: Dynamics, homeostasis and remodelling. Nat Rev Mol Cell Biol. 2003;4(7):517–529. doi: 10.1038/nrm1155. [DOI] [PubMed] [Google Scholar]
- 16.Zhao Y, et al. An expanded palette of genetically encoded Ca(2)(+) indicators. Science. 2011;333(6051):1888–1891. doi: 10.1126/science.1208592. [DOI] [PMC free article] [PubMed] [Google Scholar]
- 17.Shigetomi E, Kracun S, Sofroniew MV, Khakh BS. A genetically targeted optical sensor to monitor calcium signals in astrocyte processes. Nat Neurosci. 2010;13(6):759–766. doi: 10.1038/nn.2557. [DOI] [PMC free article] [PubMed] [Google Scholar]
- 18.Cheng H, Lederer WJ. Calcium sparks. Physiol Rev. 2008;88(4):1491–1545. doi: 10.1152/physrev.00030.2007. [DOI] [PubMed] [Google Scholar]
- 19.Ertel EA, et al. Nomenclature of voltage-gated calcium channels. Neuron. 2000;25(3):533–535. doi: 10.1016/s0896-6273(00)81057-0. [DOI] [PubMed] [Google Scholar]
- 20.Le Blanc C, et al. Regulation of vascular L-type Ca2+ channels by phosphatidylinositol 3,4,5-trisphosphate. Circ Res. 2004;95(3):300–307. doi: 10.1161/01.RES.0000138017.76125.8b. [DOI] [PubMed] [Google Scholar]
- 21.Viard P, et al. PI3K promotes voltage-dependent calcium channel trafficking to the plasma membrane. Nat Neurosci. 2004;7(9):939–946. doi: 10.1038/nn1300. [DOI] [PubMed] [Google Scholar]
- 22.Haugh JM, Codazzi F, Teruel M, Meyer T. Spatial sensing in fibroblasts mediated by 3′ phosphoinositides. J Cell Biol. 2000;151(6):1269–1280. doi: 10.1083/jcb.151.6.1269. [DOI] [PMC free article] [PubMed] [Google Scholar]
- 23.van Rheenen J, Jalink K. Agonist-induced PIP(2) hydrolysis inhibits cortical actin dynamics: Regulation at a global but not at a micrometer scale. Mol Biol Cell. 2002;13(9):3257–3267. doi: 10.1091/mbc.E02-04-0231. [DOI] [PMC free article] [PubMed] [Google Scholar]
- 24.Woo SH, Lee CO. Role of PKC in the effects of alpha1-adrenergic stimulation on Ca2+ transients, contraction and Ca2+ current in guinea-pig ventricular myocytes. Pflugers Arch. 1999;437(3):335–344. doi: 10.1007/s004240050787. [DOI] [PubMed] [Google Scholar]
- 25.Zhang S, Hirano Y, Hiraoka M. Arginine vasopressin-induced potentiation of unitary L-type Ca2+ channel current in guinea pig ventricular myocytes. Circ Res. 1995;76(4):592–599. doi: 10.1161/01.res.76.4.592. [DOI] [PubMed] [Google Scholar]
- 26.Shen Q, Rigor RR, Pivetti CD, Wu MH, Yuan SY. Myosin light chain kinase in microvascular endothelial barrier function. Cardiovasc Res. 2010;87(2):272–280. doi: 10.1093/cvr/cvq144. [DOI] [PMC free article] [PubMed] [Google Scholar]
- 27.Brundage RA, Fogarty KE, Tuft RA, Fay FS. Calcium gradients underlying polarization and chemotaxis of eosinophils. Science. 1991;254(5032):703–706. doi: 10.1126/science.1948048. [DOI] [PubMed] [Google Scholar]
- 28.Tsai FC, et al. A polarized Ca2+, diacylglycerol and STIM1 signalling system regulates directed cell migration. Nat Cell Biol. 2014;16(2):133–144. doi: 10.1038/ncb2906. [DOI] [PMC free article] [PubMed] [Google Scholar]
- 29.Lipp P, Niggli E. Ratiometric confocal Ca(2+)-measurements with visible wavelength indicators in isolated cardiac myocytes. Cell Calcium. 1993;14(5):359–372. doi: 10.1016/0143-4160(93)90040-d. [DOI] [PubMed] [Google Scholar]
- 30.Inoue T, Heo WD, Grimley JS, Wandless TJ, Meyer T. An inducible translocation strategy to rapidly activate and inhibit small GTPase signaling pathways. Nat Methods. 2005;2(6):415–418. doi: 10.1038/nmeth763. [DOI] [PMC free article] [PubMed] [Google Scholar]
- 31.Suh BC, Inoue T, Meyer T, Hille B. Rapid chemically induced changes of PtdIns(4,5)P2 gate KCNQ ion channels. Science. 2006;314(5804):1454–1457. doi: 10.1126/science.1131163. [DOI] [PMC free article] [PubMed] [Google Scholar]
- 32.Kamp TJ, Hell JW. Regulation of cardiac L-type calcium channels by protein kinase A and protein kinase C. Circ Res. 2000;87(12):1095–1102. doi: 10.1161/01.res.87.12.1095. [DOI] [PubMed] [Google Scholar]
- 33.Blair LA, Marshall J. IGF-1 modulates N and L calcium channels in a PI 3-kinase-dependent manner. Neuron. 1997;19(2):421–429. doi: 10.1016/s0896-6273(00)80950-2. [DOI] [PubMed] [Google Scholar]
- 34.Hinkle PM, Nelson EJ, Haymes AA. Regulation of L-type voltage-gated calcium channels by epidermal growth factor. Endocrinology. 1993;133(1):271–276. doi: 10.1210/endo.133.1.7686480. [DOI] [PubMed] [Google Scholar]
- 35.Tsai FC, Meyer T. Ca2+ pulses control local cycles of lamellipodia retraction and adhesion along the front of migrating cells. Curr Biol. 2012;22(9):837–842. doi: 10.1016/j.cub.2012.03.037. [DOI] [PMC free article] [PubMed] [Google Scholar]
- 36.Toettcher JE, Weiner OD, Lim WA. Using optogenetics to interrogate the dynamic control of signal transmission by the Ras/Erk module. Cell. 2013;155(6):1422–1434. doi: 10.1016/j.cell.2013.11.004. [DOI] [PMC free article] [PubMed] [Google Scholar]
- 37.Shcherbakova DM, Verkhusha VV. Near-infrared fluorescent proteins for multicolor in vivo imaging. Nat Methods. 2013;10(8):751–754. doi: 10.1038/nmeth.2521. [DOI] [PMC free article] [PubMed] [Google Scholar]
- 38.Dulyaninova NG, Patskovsky YV, Bresnick AR. The N-terminus of the long MLCK induces a disruption in normal spindle morphology and metaphase arrest. J Cell Sci. 2004;117(Pt 8):1481–1493. doi: 10.1242/jcs.00993. [DOI] [PubMed] [Google Scholar]
- 39.Moffat J, et al. A lentiviral RNAi library for human and mouse genes applied to an arrayed viral high-content screen. Cell. 2006;124(6):1283–1298. doi: 10.1016/j.cell.2006.01.040. [DOI] [PubMed] [Google Scholar]
- 40.Lee S, et al. Reversible protein inactivation by optogenetic trapping in cells. Nat Methods. 2014;11(6):633–636. doi: 10.1038/nmeth.2940. [DOI] [PubMed] [Google Scholar]
- 41.Vicente-Manzanares M, Koach MA, Whitmore L, Lamers ML, Horwitz AF. Segregation and activation of myosin IIB creates a rear in migrating cells. J Cell Biol. 2008;183(3):543–554. doi: 10.1083/jcb.200806030. [DOI] [PMC free article] [PubMed] [Google Scholar]
- 42.Dudley RA, et al. Guidelines for immunoassay data processing. Clin Chem. 1985;31(8):1264–1271. [PubMed] [Google Scholar]
- 43.Pearman CM. An Excel-based implementation of the spectral method of action potential alternans analysis. Physiol Rep. 2014;2(12) doi: 10.14814/phy2.12194. pii: e12194. [DOI] [PMC free article] [PubMed] [Google Scholar]
Associated Data
This section collects any data citations, data availability statements, or supplementary materials included in this article.


