Significance
We previously showed that glucose transporters and the KATP metabolic sensor are coexpressed in sweet-responsive taste cells and could serve as sugar sensors in the absence of the sweet receptor (type 1 taste receptors 2 and 3). However, only monosaccharides are substrates for these transporters, whereas dietary carbohydrates are mostly polysaccharides and disaccharides. Here we show that the disaccharide-digesting enzymes maltase-glucoamylase and sucrase-isomaltase are expressed selectively in sweet taste cells. Pharmacological inhibition of these enzymes diminished taste nerve responses only to disaccharides. We hypothesize that these enzymes act in concert with salivary amylase to generate monosaccharide substrates for taste cell-expressed glucose transporters. The transported monosaccharides can then be metabolized to ATP to close KATP and activate the T1R-independent sweet taste pathway.
Keywords: gustation, sensory transduction, disaccharides, sucrase-isomaltase, maltase-glucoamylase
Abstract
The primary sweet sensor in mammalian taste cells for sugars and noncaloric sweeteners is the heteromeric combination of type 1 taste receptors 2 and 3 (T1R2+T1R3, encoded by Tas1r2 and Tas1r3 genes). However, in the absence of T1R2+T1R3 (e.g., in Tas1r3 KO mice), animals still respond to sugars, arguing for the presence of T1R-independent detection mechanism(s). Our previous findings that several glucose transporters (GLUTs), sodium glucose cotransporter 1 (SGLT1), and the ATP-gated K+ (KATP) metabolic sensor are preferentially expressed in the same taste cells with T1R3 provides a potential explanation for the T1R-independent detection of sugars: sweet-responsive taste cells that respond to sugars and sweeteners may contain a T1R-dependent (T1R2+T1R3) sweet-sensing pathway for detecting sugars and noncaloric sweeteners, as well as a T1R-independent (GLUTs, SGLT1, KATP) pathway for detecting monosaccharides. However, the T1R-independent pathway would not explain responses to disaccharide and oligomeric sugars, such as sucrose, maltose, and maltotriose, which are not substrates for GLUTs or SGLT1. Using RT-PCR, quantitative PCR, in situ hybridization, and immunohistochemistry, we found that taste cells express multiple α-glycosidases (e.g., amylase and neutral α glucosidase C) and so-called intestinal “brush border” disaccharide-hydrolyzing enzymes (e.g., maltase-glucoamylase and sucrase-isomaltase). Treating the tongue with inhibitors of disaccharidases specifically decreased gustatory nerve responses to disaccharides, but not to monosaccharides or noncaloric sweeteners, indicating that lingual disaccharidases are functional. These taste cell-expressed enzymes may locally break down dietary disaccharides and starch hydrolysis products into monosaccharides that could serve as substrates for the T1R-independent sugar sensing pathways.
In humans, the heteromeric combination of type 1 taste receptors 2 and 3 (T1R2+T1R3, encoded by TAS1R2 and TAS1R3) forms a sweet taste receptor responsive to sugars (e.g., glucose, fructose, sucrose), noncaloric sweeteners (e.g., aspartame, sucralose, saccharin, acesulfame K, rebaudioside A), and protein sweeteners (e.g., monellin, thaumatin, and brazzein), but not polysaccharides (1). The mouse sweet receptor (T1R2+T1R3) also responds to sugars, some of the same noncaloric sweeteners (e.g., sucralose, saccharin, acesulfame K, rebaudioside A), but not the protein sweeteners or polysaccharides. It is well established from multiple studies that T1R2+T1R3 is the major sweet taste receptor for sugars and likely the only sweet taste receptor for noncaloric sweeteners. For example, heterologous expression of human or mouse T1R2+T1R3 receptors in cultured cells recapitulates the host organism’s response to sweeteners (2–4). KO mice lacking Tas1r2 or Tas1r3 have generally diminished responses to most sweet compounds as assessed by brief access lick assays, two bottle preference tests, and gustatory nerve recordings (5, 6).
However, in some studies, Tas1r3 KO mice were found to still have significant behavioral and nerve responses to glucose and other sugars (5, 7). Many quantitative trait loci other than Tas1r3 contribute to sweet taste perception in mice (8, 9). From this we inferred the presence of a sweet-sensing pathway that is independent of T1R3 (5, 7). We showed that multiple glucose transporters (GLUT2, GLUT4, GLUT8, and GLUT9), sodium glucose cotransporter 1 (SGLT1), and ATP-gated K+ (KATP) channel subunits (KIR6.2 and SUR1) are present preferentially in the Tas1r3-expressing taste cells in mouse taste buds (10). Other groups (11–13) have confirmed some of these results. We proposed that the T1R-independent sweet pathway depends on uptake of glucose into Tas1r3-expressing taste cells, followed by its metabolism to ATP, which binds to KATP, closing the channel and depolarizing the sweet taste cell (10). The existence of two sweet pathways, both of which detect sugars, could explain why noncaloric sweeteners are fully cross-adapted by sugars, but sugars are only partially cross-adapted by noncaloric sweeteners (14, 15).
However, this proposed alternative pathway does not, on its own, explain the remaining taste responses of Tas1r3 KO mice to the disaccharides maltose (5) and sucrose (5, 7). Dietary carbohydrates are hydrolyzed into constituent monosaccharides before uptake by enterocytes. Starch is partially hydrolyzed by extracellular enzymes, first in the oral cavity by salivary amylase (AMY1), and then in the small intestine by pancreatic amylase (AMY2). The end products of amylase-catalyzed starch hydrolysis are disaccharides like maltose and higher-molecular-weight oligomers of glucose; amylase cannot generate glucose from starch. Disaccharidases localized to the apical plasma membrane of enterocytes (brush border enzymes), such as maltase-glucoamylase (MGAM), sucrase-isomaltase (SIS), lactase (LCT), and trehalase (TREH) hydrolyze the disaccharides maltose, sucrose, lactose, and trehalose, respectively, to generate monosaccharides (16–19). Here, we used PCR, in situ hybridization, and immunohistochemistry to determine that multiple sugar- and starch-hydrolyzing enzymes are expressed in taste cells. We found that Mgam, Sis, Lct, Treh, Amy1, and neutral α-glucosidase C (Ganc) are all expressed in taste cells. The majority of Tas1r3-expressing taste cells express Mgam and Sis, as we previously showed for GLUTs and KATP. Furthermore, inhibition of MGAM and SIS specifically decreased gustatory nerve responses to the disaccharides sucrose and maltose. Our results indicate that the actions of these orally expressed digestive enzymes may contribute to the unique sweet taste of sucrose and other sugars by generating monosaccharide substrates for the T1R-independent sweet pathway.
Results
Carbohydrate-Digesting Enzymes Are Expressed in Taste Cells.
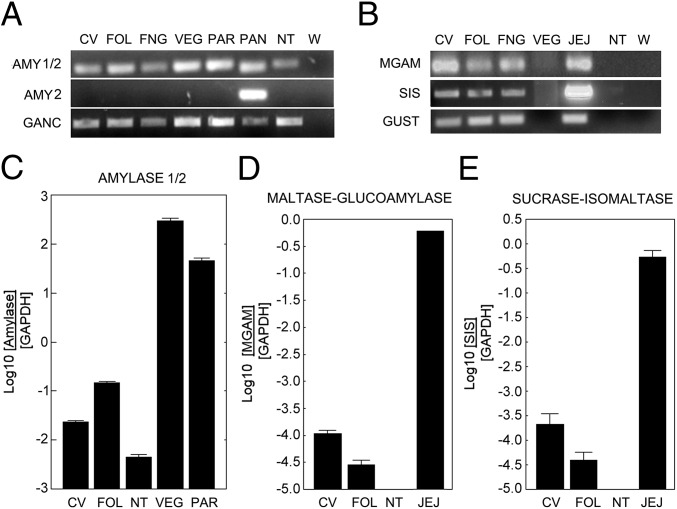
To gain insight into the T1R-independent taste of disaccharides, we examined expression in mouse taste tissue of several carbohydrate-hydrolyzing enzymes. We first examined expression of the enzymes Amy1 (salivary amylase), Amy2 (pancreatic amylase), and Ganc in taste and nontaste tissues: mRNAs were from taste bud-containing [circumvallate (CV), foliate (FOL), and fungiform (FNG)] papillae and nontaste lingual epithelium (NT) tissues, along with Von Ebners gland (VEG), parotid (PAR) gland, and pancreas (PAN). PCR assays were then performed using primer pairs specific for cDNAs corresponding to Amy1/2 (salivary and/or pancreatic forms), Amy2, and Ganc. By PCR the Amy2 product was detected only from pancreatic cDNA, whereas an Amy1/2 product was found in all tissues examined, indicating that all of the oral tissues tested (including the NT control) express only Amy1 (Fig. 1A). PCR indicated that Ganc mRNA was present in all oral tissues, as well as in pancreas (positive control) (Fig. 1A). PCR assays with primer pairs against Mgam and Sis showed that their mRNAs were present in all taste tissues tested and jejunum (positive control), but were absent from NT and VEG (Fig. 1B). Gustducin served as a positive control for the taste tissues and for jejunum and was not expressed in VEG or NT (Fig. 1B). Quantitative evaluation by real-time PCR demonstrated highest expression of Amy1 mRNA in VEG and PAR, followed by CV and FOL, with lowest expression in NT (Fig. 1C). Quantitation showed higher levels of Mgam and Sis mRNAs in CV and FOL papillae than in NT (Fig. 1 D and E).
Fig. 1.
Expression of mRNAs for α-glucosidases in gustatory and gastrointestinal tissues. (A and B) PCR amplification (35 cycles) of amylases (Amy1/2, salivary and pancreatic amylase; Amy2, pancreatic amylase), α-glucosidases (Ganc, neutral α-glucosidase C; Mgam, maltase-glucoamylase; Sis, sucrase-isomaltase), and gustducin (Gust) from mouse cDNAs from gustatory [CV, circumvallate papillae; FOL, foliate papillae; FNG, fungiform papillae; NT (non-taste lingual epithelium); PAR, parotid gland; VEG, Von Ebner’s glands] and gastrointestinal tissues (PAN, pancreas; JEJ, jejunum). Ganc and Amy1 are expressed in all gustatory tissues tested; Amy2 is expressed only in pancreas. Mgam and Sis are expressed in all three types of taste papillae, as well as in jejunum (positive control), but not in nontaste tissue. (C–E) Taqman real-time PCR was used to quantitate expression in gustatory and gastrointestinal tissue cDNAs of Amy1/2, Mgam, and Sis. Elevated expression in CV and FOL cDNAs vs. NT cDNA are observed for all three enzymes. The expression of each gene is plotted as the logarithm of the ratio between its cycle threshold value and that of Gapdh.
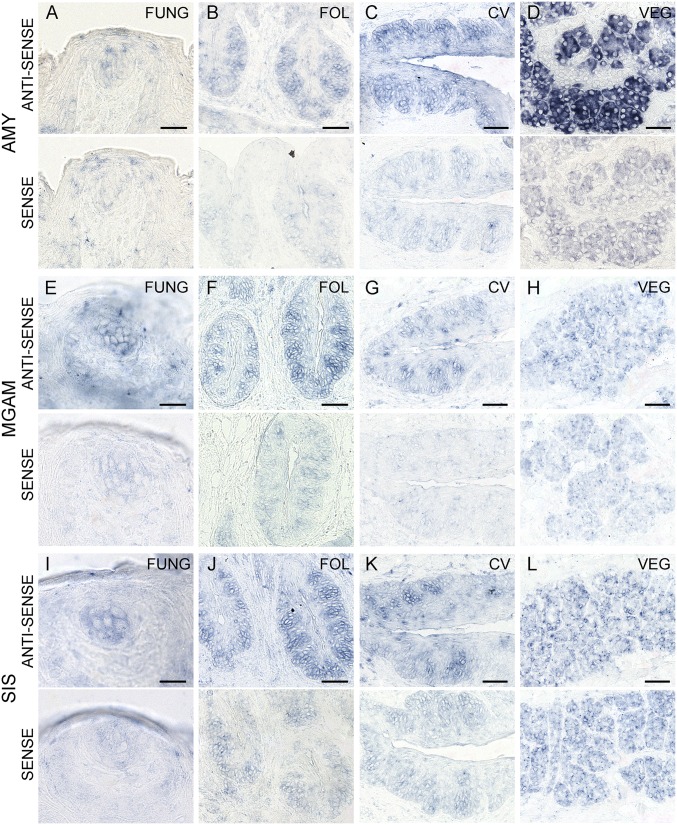
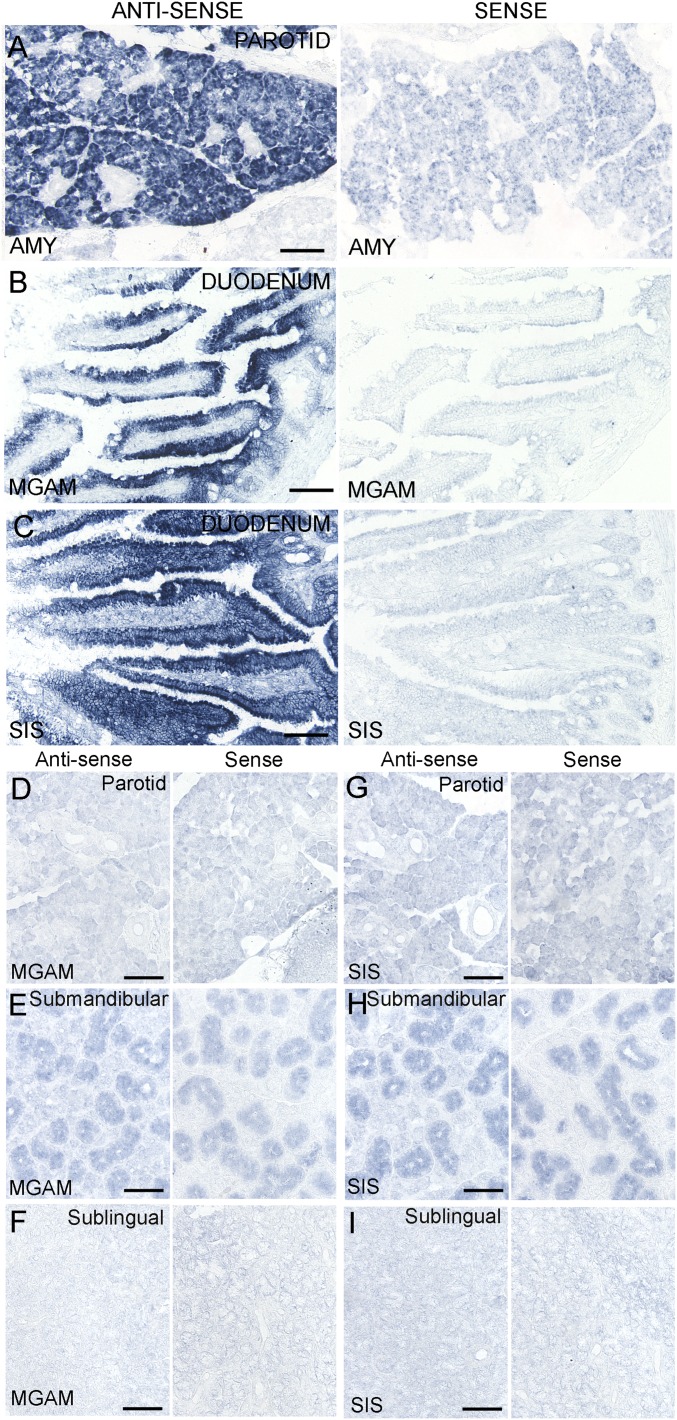
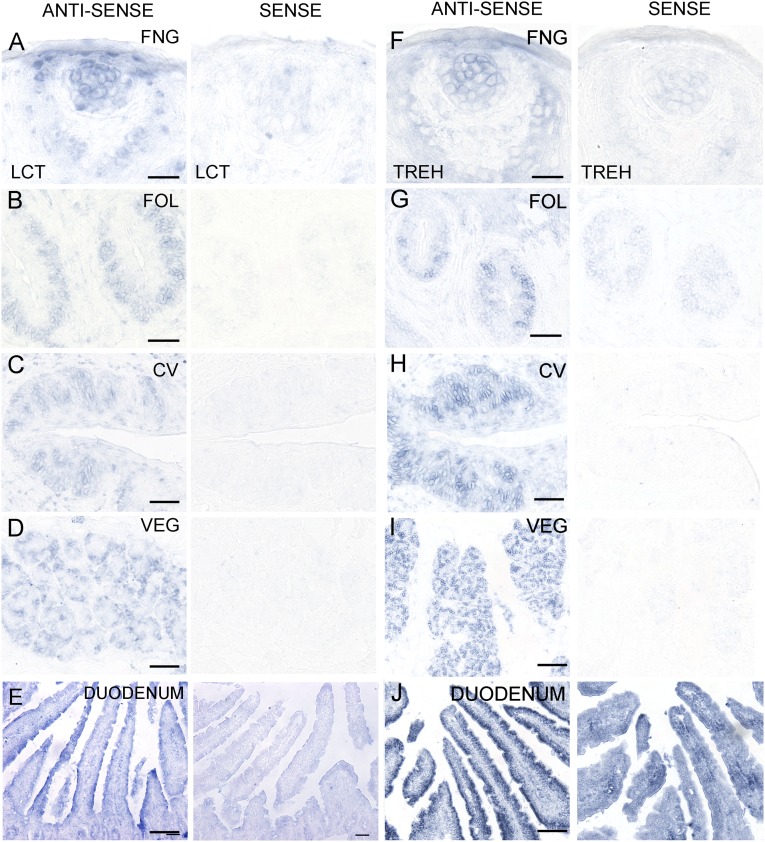
The cDNA templates for the PCR experiments were derived from taste tissue containing a mixture of taste cells and surrounding epithelial and connective cells, from negative control NT tissue devoid of taste cells, or from positive control tissues (e.g., VEG, PAR, JEJ, PAN). To determine whether the mRNAs for these genes are indeed expressed in the taste cells themselves and/or elsewhere in the oral cavity, we carried out in situ hybridization with antisense and sense (control) probes for Amy1/2, Mgam, and Sis. In situ hybridization to taste bud-containing sections indicated that mRNAs for Amy1/2, Mgam, and Sis are selectively expressed in mouse taste cells in FNG, FOL, and CV papillae (Fig. 2). Amy1/2 was also expressed in VEG (Fig. 2D), but Mgam and Sis were not (Fig. 2 H and L). Each antisense probe was validated in positive control tissues known to express these mRNAs: Amy1/2 in parotid gland and Mgam and Sis in duodenum (Fig. S1 A–C). Unlike Amy1/2, mRNAs for Mgam and Sis were not expressed in the parotid, submandibular, and sublingual glands (Fig. S1 D–I), indicating that they are not secreted by the major salivary glands. To determine whether mRNAs for additional carbohydrate-digesting enzymes are expressed in taste cells, we carried out in situ hybridization with probes for lactase (Lct) and trehalase (Treh). Both Lct and Treh are selectively expressed in mouse taste cells in FNG, FOL, and CV papillae (Fig. S2 A–D and F–I). The Lct and Treh probes were validated in duodenum as the positive control tissue (Fig. S2 E and J).
Fig. 2.
Expression of α-glucosidase mRNAs in taste cells. In situ hybridization to taste bud-containing tissues from mouse FNG, FOL, and CV papillae and VEG was carried out with digoxigenin-labeled RNA probes for Amy1/2 (A–D), Mgam (E–H), and Sis (I–L). Taste cell hybridization to antisense probes indicates expression of mRNAs for all three enzymes in FNG, FOL, and CV taste cells; Amy1/2 mRNA also is observed in VEG. Hybridization of sense probe controls in and around taste cells indicative of nonspecific background was generally lower than with corresponding antisense probes. [Scale bars, 20 (A, E, and I) and 40 μm (B–D, F–H, and J–L).]
Fig. S1.
In situ hybridization in control tissues and major salivary glands. Before use with taste bud-containing sections, all digoxigenin-labeled RNA probes were tested in tissues known to express the genes of interest. Antisense probes demonstrated the expected patterns of expression in parotid gland for Amy1/2 (A) and in duodenum for Mgam (B) and Sis (C). Sense probes were shown to have low nonspecific hybridization to these tissues. In situ hybridization was also carried out in the major salivary glands with digoxigenin-labeled RNA probes for Mgam (D–F) and Sis (G–I). No expression above the sense background was observed for either enzyme in the parotid, submandibular, or sublingual glands. [Scale bars, 40 (A–C) and 50 μm (D–I).]
Fig. S2.
Expression of lactase and threhalase mRNAs in taste cells. In situ hybridization to taste bud-containing tissues from FNG, FOL, and CV papillae, VEG, and positive control tissue was carried out with digoxigenin-labeled RNA probes for Lct (A–E) and Treh (F–J). Taste cell hybridization to antisense probes indicated expression of mRNAs for all three enzymes in FNG, FOL, and CV taste cells (A–C and F–H). For positive control tissues, Lct mRNA (E) and Treh mRNA (J) were examined in the duodenum. Hybridization of sense probe controls in and around taste cells indicative of nonspecific background was generally lower than with corresponding antisense probes. [Scale bars, 20 (A and F) and 40 μm (B–E and G–J).]
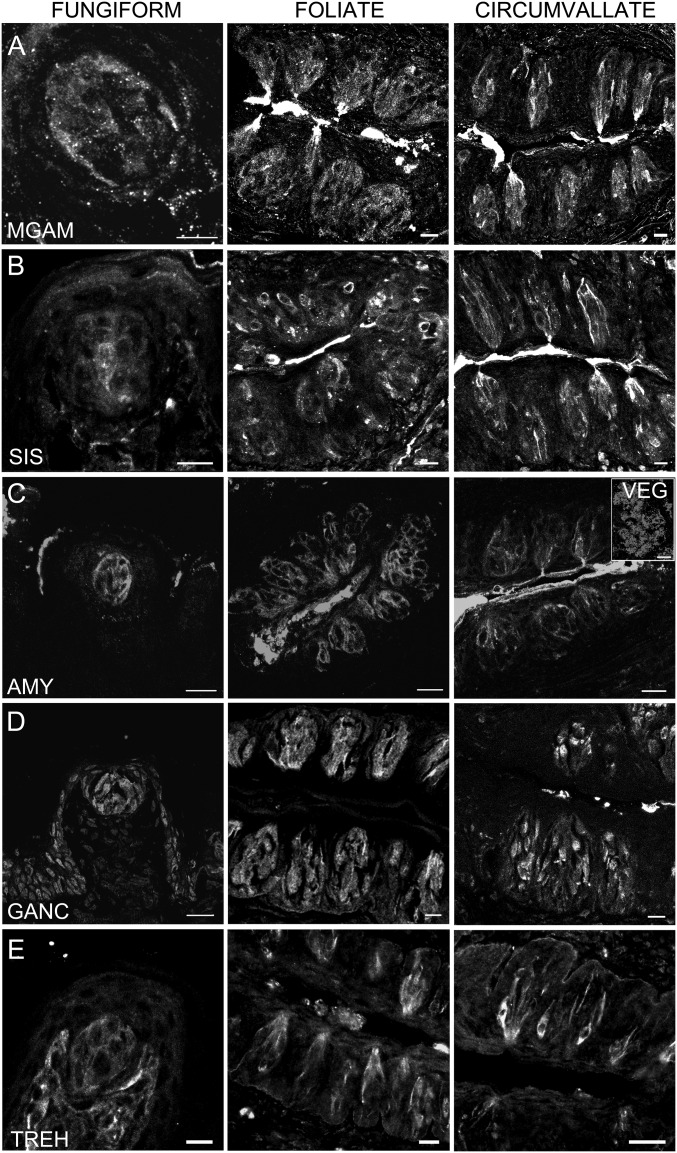
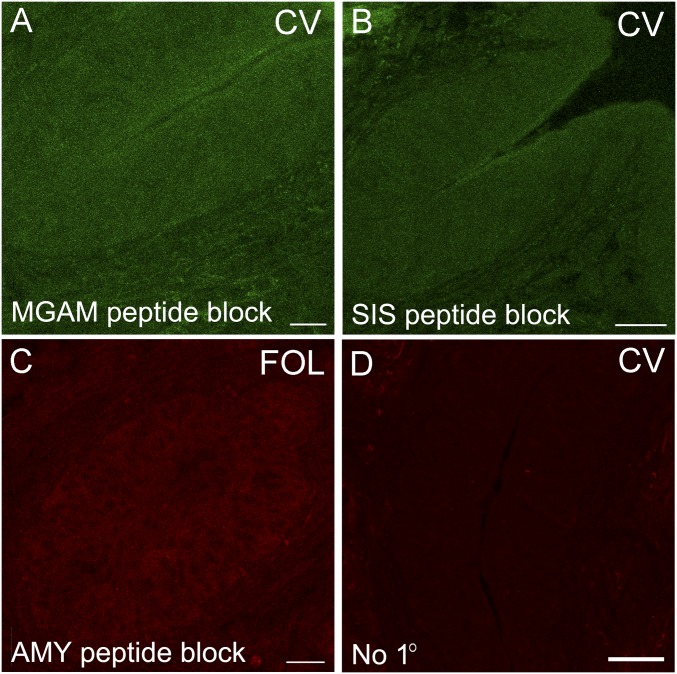
Given that mRNA expression demonstrated above may not necessarily be correlated with protein expression, we also performed indirect immunohistochemistry to confirm the expression of MGAM, SIS, AMY1/2, GANC, and TREH proteins in taste cells. Immunoreactivity to MGAM, SIS, AMY1/2, GANC, and TREH was observed in mouse taste cells from all three types of papillae (Fig. 3). Primary antibodies against MGAM and SIS were previously validated with intestinal tissues (20). The anti–AMY1/2 antibody was validated against VEG (Fig. 3C, Inset). In addition, the primary antibodies against MGAM, SIS, and AMY1/2 were shown to be specific by preincubation with an excess of the specific immunogenic peptides used to generate each antibody (Fig. S3 A–C). Secondary antibodies were shown to be free of nonspecific immunoreactivity in tissue controls with primary antibodies omitted (Fig. S3D).
Fig. 3.
Expression of α-glucosidase proteins in taste cells. Indirect immunofluorescence confocal microscopy of taste bud containing sections from mouse FNG, FOL, and CV taste papillae was carried out with specific polyclonal antibodies directed against AMY1/2, MGAM, SIS, GANC, and TREH. Immunofluorescence indicates expression in taste cells of all five enzymes. [Scale bars, A = 10 μm (FNG), 40 μm (FOL and CV); B = 40 μm (all); C = 80 μm (FNG), 20 μm (FOL and CV), and 40 μm (VEG); D = 80 μm (FNG), 40 μm (FOL and CV); E = 10 μm (FNG), 20 μm (FOL and CV).]
Fig. S3.
Indirect immunofluorescence controls. Incubation of primary antibodies against MGAM (A), SIS (B), and AMY1/2 (C) with the cognate peptides blocked specific staining in CV or FOL. The omission of the primary antibody (No 1°) yielded low nonspecific background from secondary antibodies in CV (D). [Scale bars, 20 (A and C), 40 (B), and 80 μm (D).]
Carbohydrate-Digesting Enzymes Are Expressed in Type II and III Taste Cells.
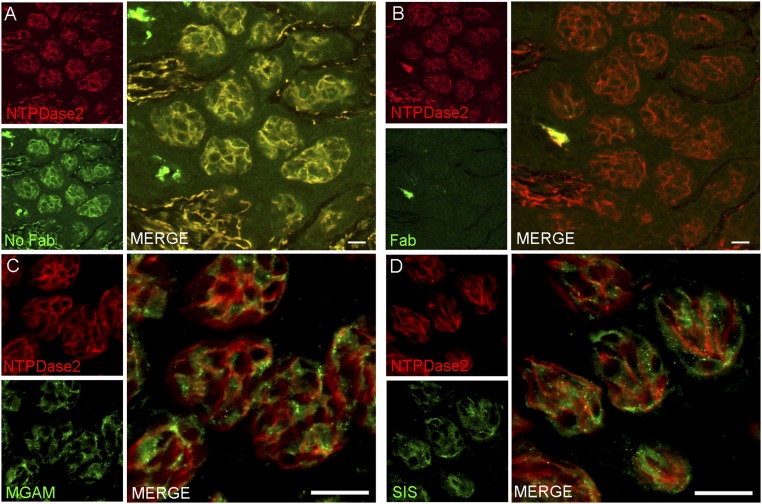
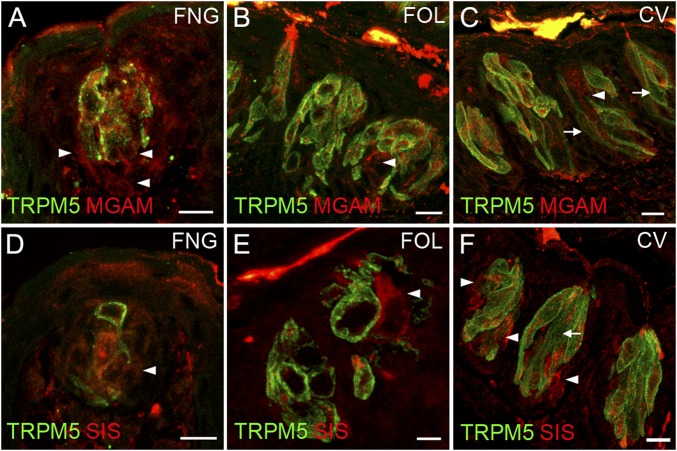
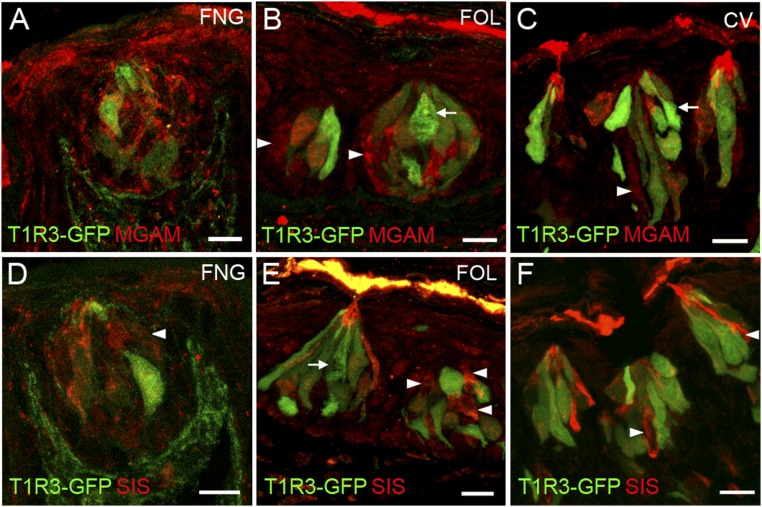
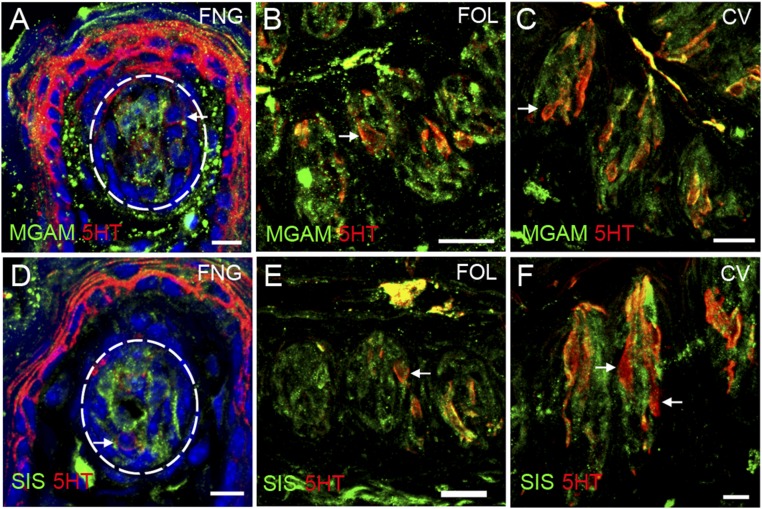
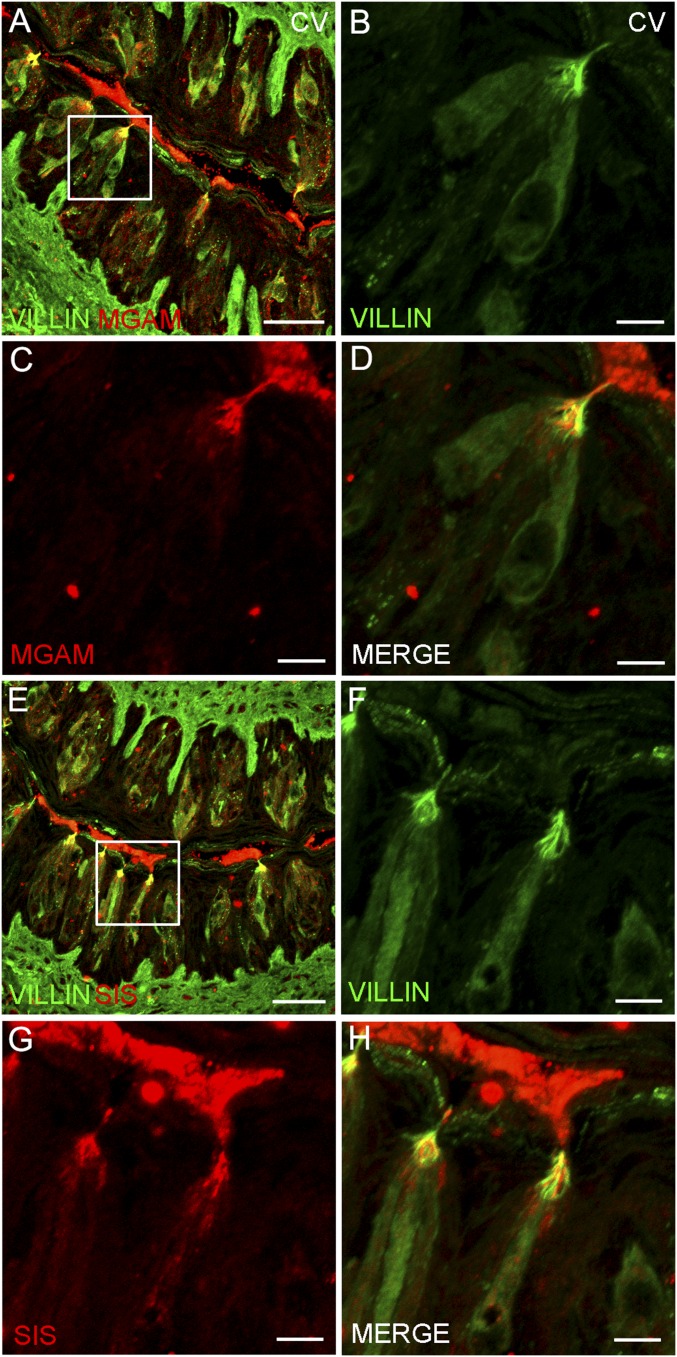
The data above indicate by multiple independent means that several carbohydrate-hydrolyzing enzymes are present in taste cells. Were any of these enzymes to contribute to taste sensing of sucrose, maltose, or other disaccharides, they would most likely be found within or in proximity to those taste cells that detect sweet compounds by T1R-dependent and T1R-independent pathways (i.e., the T1R2+T1R3-positive subset of type II taste cells that also express glucose and other monosaccharide transporters and KATP channels). To examine this, we double-stained taste cells using an antibody against either the MGAM or SIS enzymes, along with second antibodies or transgenes that mark specific taste cell types. Double-staining with markers for type I taste cells (an antibody against NTPDase2; Fig. S4), for all type II taste cells (an antibody against TRPM5; Fig. 4), for the T1R3-positive subset of type II taste cells (T1R3-GFP; Fig. S5), or for type III taste cells [an antibody against serotonin (anti-5HT); Fig. S6], showed that both MGAM and SIS were most often found in type II taste cells (in both anterior and posterior fields), but also frequently in type III taste cells. In the small intestine, disaccharidases are localized to the apical plasma membrane of enterocytes with their catalytic domain exposed to the intestinal lumen. To determine whether these enzymes are also localized apically to areas of the taste bud exposed to the contents of the oral cavity, we double-stained taste cells with antibodies against either MGAM or SIS along with an antibody against VILLIN, a marker that labels taste receptor cell microvilli (21). We detected colocalization of both MGAM and SIS proteins with VILLIN in apical taste cell microvilli at the taste pore (Fig. S7).
Fig. S4.
α-Glucosidases are not expressed in type I taste cells. Double indirect immunofluorescence confocal microscopy of taste bud-containing sections from mouse CV show cross-labeling when donkey Fab fragment is omitted (A), whereas adequate blocking of rabbit IgG is achieved with excess donkey Fab fragment indicating no cross-labeling of secondary antibodies (B). Double indirect immunofluorescence was carried out with antibodies against MGAM (C, green) and SIS (D, green) and a type 1 marker NTPDase2 (red). No double labeling was observed indicating that these two glucosidase enzymes are not expressed in type I taste cells (Merge). [Scale bars, 20 (A and B) and 40 μm (C and D).]
Fig. 4.
Coexpression in taste cells of brush border enzymes with TRPM5. Indirect immunofluorescence confocal microscopy of taste bud-containing sections from mouse FNG, FOL, and CV papillae was carried out with antibodies against the brush border enzymes (MGAM or SIS) along with TRPM5 (a marker for type 2 taste cells). Overlaid images indicate frequent coexpression of TRPM5 with MGAM (A–C) and SIS (D–F). Arrowheads, single immunolabeling of brush border enzymes; arrows, single immunolabeling of TRPM5. (Scale bars, 40 μm.)
Fig. S5.
α-Glucosidases are expressed in T1R3-GFP–positive taste cells. Colocalization of MGAM (A–C) and SIS (D–F) with T1R3-GFP is observed in FNG, FOL, and CV. Arrowhead, cells singly immunolabeled for α-glucosidases. Arrow, cells singly positive for T1r3-GFP. (Scale bars, 40 μm.)
Fig. S6.
α-Glucosidases are expressed in type III taste cells. Double indirect immunofluorescence confocal microscopy of taste bud containing sections from mouse FNG, FOL, and CV papillae was carried out with antibodies against MGAM (A–C, green) and SIS (D–F green) and the type III marker serotonin (5HT, red). Double staining indicates some coexpression in FNG, FOL, and CV taste cells of each of the α-glucosidase enzymes with 5HT. Arrows, cells singly immunolabeled for 5HT. [Scale bars, 10 (A, D, and F) and 20 μm (B, C, and E).]
Fig. S7.
α-Glucosidases are localized to the taste cell microvilli at the taste pore. Double indirect immunofluorescence confocal microscopy of taste bud-containing sections from CV papillae was carried out with antibodies against MGAM (A, C, and D; red), SIS (E, G, and H; red), and VILLIN, a marker for microvilli (A, B, D–F, and H; green). Double staining indicates colocalization of MGAM and SIS with VILLIN at the taste microvilli (merge). White box, area of higher magnification. [Scale bars, 200 (A and E) and 40 μm (B–D and F–H).]
Quantitation of taste cells in CV papillae that coexpress MGAM or SIS with TRPM5 or T1R3-GFP (Table S1) determined the following. (i) Among type II taste cells (assessed by their expression of TRPM5), 93% expressed MGAM, and 97% expressed SIS. Among the MGAM-expressing and SIS-expressing cells, 66% and 62%, respectively, were type II taste cells, based on expression of TRPM5. (ii) Among T1R3-GFP–expressing taste cells, 89% expressed MGAM, and 89% expressed SIS. Among the MGAM-expressing and SIS-expressing cells, 56% and 53% expressed T1R3-GFP, respectively. (iii) Forty-six percent of MGAM-expressing cells and 41% of SIS-expressing cells expressed 5HT, whereas 70% and 71% of 5HT-expressing type III cells expressed MGAM and SIS, respectively. In sum, most type II taste cells and the majority of T1R3-GFP expressing taste cells expressed the MGAM and SIS enzymes in CV papillae. Given the percentage of type II cells and T1R3 cells that express MGAM and SIS, many bitter responsive and potentially all umami responsive cells may also express both enzymes in addition to the sweet responsive cells. A similar pattern of expression was found in the FOL papillae. In addition, a majority of type III taste cells in CV and FOL papillae expressed both enzymes.
Table S1.
Coexpression of carbohydrate-digesting enzymes with TRPM5, T1R3-GFP, and 5HT in mouse foliate and circumvallate taste cells
| Number of taste cells expressing MGAM and TRPM5 | ||||
| Tissue | MGAM | TRPM5 | MGAM+TRPM5/MGAM | MGAM+TRPM5/TRPM5 |
| Foliate | 178 | 123 | 116/178 (65.2%) | 116/123 (94.3%) |
| CV | 151 | 106 | 99/151 (65.7%) | 99/106 (93.4%) |
| Number of taste cells expressing MGAM and T1R3-GFP | ||||
| Tissue | MGAM | T1R3-GFP | MGAM+T1R3-GFP/MGAM | MGAM+T1R3-GFP/T1R3-GFP |
| Foliate | 215 | 151 | 138/215 (64.2%) | 138/151 (91.4%) |
| CV | 133 | 84 | 75/133 (56.4%) | 75/84 (89.3%) |
| Number of taste cells expressing MGAM and 5HT | ||||
| Tissue | MGAM | 5HT | MGAM+5HT/MGAM | MGAM+5HT/5HT |
| Foliate | 90 | 36 | 26/90 (28.9%) | 26/36 (72.2%) |
| CV | 200 | 131 | 92/200 (46.0%) | 92/131 (70.2%) |
| Number of taste cells expressing SIS and TRPM5 | ||||
| Tissue | SIS | TRPM5 | SIS+TRPM5/SIS | SIS+TRPM5/TRPM5 |
| Foliate | 152 | 112 | 103/152 (67.8%) | 103/112 (92.0%) |
| CV | 283 | 180 | 174/283 (61.5%) | 174/180 (96.7%) |
| Number of taste cells expressing SIS and T1R3-GFP | ||||
| Tissue | SIS | T1R3-GFP | SIS+T1R3-GFP/SIS | SIS+T1R3-GFP/T1R3-GFP |
| Foliate | 123 | 95 | 86/123 (69.9%) | 86/95 (90.5%) |
| CV | 152 | 90 | 80/152 (52.6%) | 80/90 (88.9%) |
| Number of taste cells expressing SIS and 5HT | ||||
| Tissue | SIS | 5HT | SIS+5HT/SIS | SIS+5HT/5HT |
| Foliate | 90 | 45 | 38/90 (42.2%) | 38/45 (84.4%) |
| CV | 215 | 123 | 88/215 (40.9%) | 88/123 (71.5%) |
Mouse taste cells were doubly stained for MGAM or SIS and TRPM5 or singly stained for MGAM or SIS and T1R3-GFP cells in foliate and circumvallate taste cells, and doubly stained for MGAM or SIS and 5HT. Doubly labeled cells in all three taste papillae were counted. The percentage of coexpression is shown in parentheses.
Oral Carbohydrate-Digesting Enzymes Contribute to Taste Nerve Responses to Disaccharides.
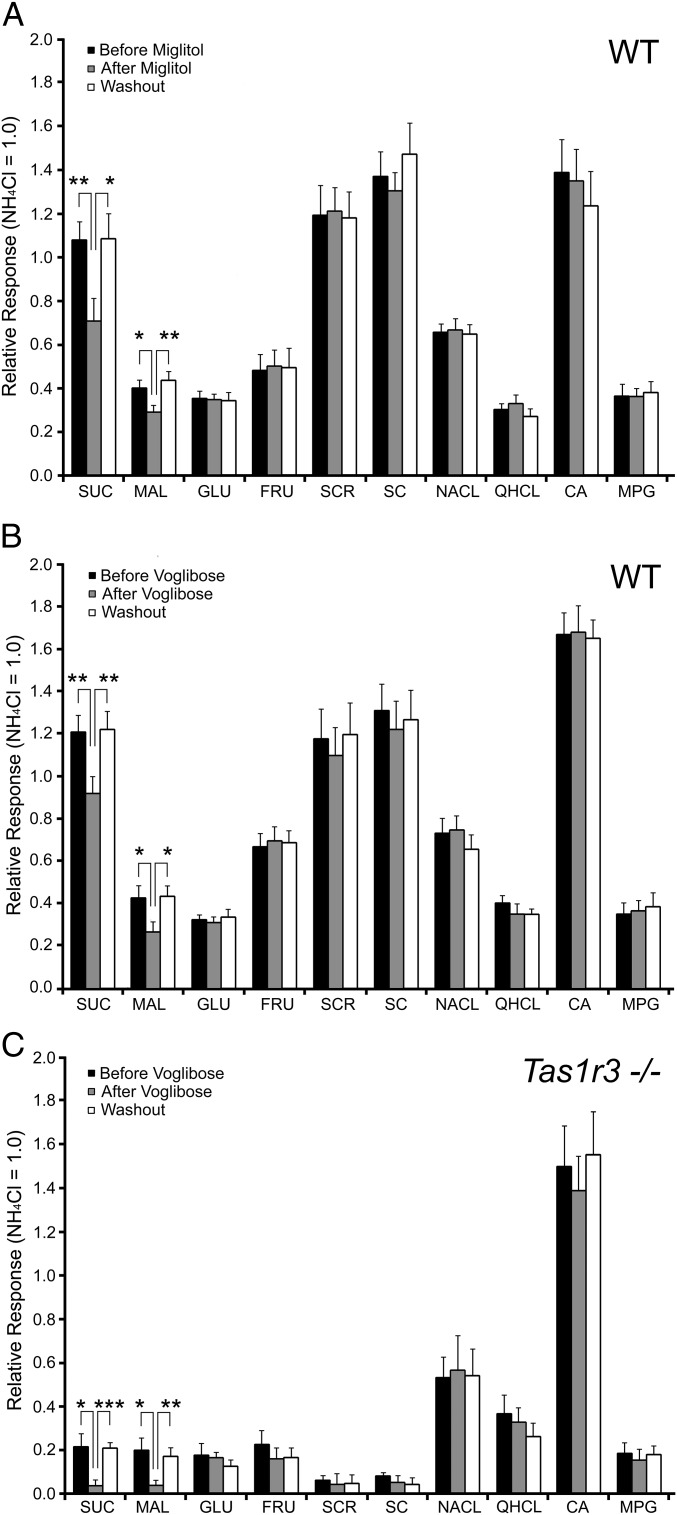
The data above show that carbohydrate-digesting enzymes MGAM and SIS are present in type II and type III taste cells, including nearly all T1R3-expressing taste cells. Were these enzymes to function in the oral cavity, we would expect them to be inhibited by α-glucosidase inhibitors. To test this possibility and to determine whether the activity of these enzymes might contribute to taste responses to disaccharides, we recorded chorda tympani nerve responses of WT (C57BL/6) mice to a series of tastants before treatment, after incubation, and after washout of two different brush border enzyme inhibitors, miglitol and voglibose, applied to the dorsal surface of the tongue (22). Pretreatment and posttreatment washout of the inhibitors had no effect on nerve responses of WT mice to any of the taste stimuli (Fig. 5 A and B). However, incubation of the tongue with either inhibitor led specifically to decreased chorda tympani nerve responses to the disaccharides sucrose and maltose, but had no effect on nerve responses to the monosaccharides glucose (GLU) and fructose (FRU), the noncaloric sweeteners SC45647 (SC) and sucralose (SCR), or control stimuli representative of nonsweet taste qualities (i.e., salty (NaCl), sour [citric acid (CA)], bitter [quinine hydrochloride (QHCl)], and umami [monopotassium glutamate (MPG); Fig. 5 A and B]. Miglitol (500 μM) reduced chorda tympani nerve responses (n = 7, 8) to sucrose by 40% (P < 0.01) and to maltose by 25% (P < 0.05). Voglibose (10 μM) similarly reduced chorda tympani nerve responses (n = 8, 9) to sucrose by 40% (P < 0.001) and to maltose by 25% (P < 0.05).
Fig. 5.
Integrated whole-nerve recording from chorda tympani taste nerves of mice stimulated by lingual application of taste stimuli in the presence or absence of α-glucosidase inhibitors. Relative responses were normalized to the response to 100 mM NH4Cl. Recordings from WT mice were taken before application (filled bars), after application (gray bars), and after 10-min wash out (open bars) of the α-glucosidase inhibitors (A) miglitol (500 μM) and (B) voglibose (10 μM). Both miglitol and voglibose significantly reduce the magnitude of nerve responses to sucrose (SUC) and maltose (MAL), but have no effect on the responses to other sugars, noncaloric sweeteners, or nonsweet tastants in WT mice. Recordings from Tas1r3 KO mice (Tas1r3−/−) were taken before application (filled bars), after application (gray bars), and after 10-min wash out (open bars) of voglibose (10 μM) (C). Voglibose significantly reduces the magnitude of nerve responses to SUC and MAL, but has no effect on the responses to other tastants in Tas1r3 KO mice. Taste stimuli: 100 mM NH4Cl, 500 mM SUC, 500 mM MAL, 500 mM glucose (GLU), 500 mM fructose (FRU), 1 mM SC45674 (SC), 100 mM NaCl, 10 mM quinine-HCl (QHCL), 10 mM citric acid (CA), 100 mM monopotassium glutamate (MPG). (n = 6–9; ***P < 0.001, **P < 0.01, *P < 0.05).
To determine whether this effect was via a T1R-independent mechanism, we measured sensitivity of chorda tympani nerve responses of Tas1r3 KO mice to the α-glucosidase inhibitor voglibose. Pretreatment and washout of voglibose had no effect on nerve responses of Tas1r3 KO mice to any of the taste stimuli (Fig. 5C). Incubation with voglibose decreased nerve responses of Tas1r3 KO mice (n = 6) to sucrose (P < 0.01) and maltose (P < 0.01) to background levels (i.e., comparable to their responses to the artificial sweeteners SC45647 and sucralose), but had no effect on nerve responses of these mice to the other sweet compounds (i.e., glucose, fructose, SC45647, and sucralose) or to the control nonsweet stimuli (i.e., NaCl, CA, QHCl, and MPG) (Fig. 5C). Thus, in the genetic absence of Tas1r3, pharmacological inhibition of disaccharidases eliminated all responses to the disaccharide sugars sucrose and maltose.
Discussion
Starch, a dietary staple for humans and rodents alike, is initially digested into oligo- and disaccharides by salivary and pancreatic amylases (23–25). The intestinal brush border enzymes MGAM, SIS, TREH, and LCT then convert disaccharides maltose, sucrose, trehalose, and lactose into readily absorbable monosaccharides (16, 17). In the small intestine, absorptive enterocytes take up free glucose and galactose via cotransport with sodium by SGLT1 and free fructose by GLUT5; these sugars are transported by GLUT2 across the basolateral aspect of the enterocytes into the bloodstream (26). We and others have shown that the sweet taste receptor T1R2+T1R3 and downstream signaling components, including gustducin and TRPM5, are present in enteroendocrine cells in the small intestine where they up-regulate enterocyte expression of SGLT1 and GLUT2 in response to dietary levels of sugars and sweeteners (27, 28).
The finding that taste cells express multiple carbohydrate-hydrolyzing enzymes previously thought to be present only in gut is striking, yet it seems unlikely that these taste cell-expressed enzymes play a significant role in nutrient absorption per se. It had previously been shown in rats that Amy1/2 was expressed in both the VEG and the taste buds of the CV papillae, although the relative or absolute level of expression had not been quantified nor was the identity of the amylase isoform determined (29). Our RT-PCR results show that Amy1 is most highly expressed in the parotid gland and VEG, with lower but clearly detectable expression in the CV and FOL taste bud-containing tissues. By in situ hybridization, Amy1/2 was found to be expressed in taste buds of the FNG, FOL, and CV papillae, but again at much lower levels than in VEG. The contents of the VEG are secreted directly into the trenches underlying the FOL and CV papillae (30), suggesting that AMY1 from the VEG and taste cells may act on dietary starch to generate locally elevated amounts of oligo- and disaccharides in close proximity to the taste buds. Our immunohistochemistry results show that the majority of taste cells that express MGAM and SIS are type II taste cells (TRPM5 positive), including nearly all T1R3-expressing taste cells. In addition, a sizable minority of the MGAM- and SIS-expressing cells is made up of 5HT-positive type III taste cells. That MGAM and SIS are localized at the taste pore and therefore exposed to the oral cavity may be crucial for their role in the T1R-independent pathway, as the monosaccharides released at the taste pore will be accessible to even those nearby cells that don't express these enzymes.
GANC is expressed in liver where it hydrolyzes terminal nonreducing (1–>4)-linked α-d-glucose residues from maltose and glycogen (31). Although glycogen phosphorylase catalyzes degradation of glycogen in the liver (32), GANC may also be involved in glycogen metabolism (31). GANC in taste cells is found predominantly within the nucleus, and we speculate that this may reflect a mechanism for regulating its activity, as in the case of the liver specific isoform of glucokinase (32).
Why are AMY1, GANC, and multiple brush border enzymes expressed in taste cells, particularly the T1R3-expressing type II taste cells? Likely they are contributing to the T1R-independent sweet sensing pathway in T1R3-positive taste cells and broadening the responsiveness of this pathway to carbohydrates and sugars beyond just glucose and any other monosaccharides that could be transported into these taste cells. In the absence of T1R3 (i.e., in Tas1r3 KO mice) animals lose responses to noncaloric sweeteners, but retain much of their responses to sugars (5). We proposed that there are two sweet-sensing pathways (10). The heterodimeric sweet receptor T1R2+T1R3 mediates the T1R-dependent pathway by which T1R3-positive cells respond to both caloric and noncaloric sweeteners. In contrast, the T1R-independent sweet pathway, also found in the T1R3-positive cells, depends on uptake of glucose and other monosaccharides into these taste cells, followed by metabolism to ATP, which binds to KATP, closing the channel and depolarizing the sweet taste cell, triggering release of neurotransmitters and neuro-peptides (10). Although the T1R-dependent pathway would respond to all sweeteners and all sugars that bind to T1R2+T1R3, the T1R-independent pathway would only respond to those sweet compounds that can be transported into the T1R3-positive taste cells and then metabolized. To a first approximation then, only glucose, fructose, and galactose would be likely substrates for the T1R3-independent pathway. However, the disaccharides sucrose and maltose elicit robust nerve responses and preference responses in Tas1r3 KO mice (5). We propose that the activity of MGAM and SIS can convert dietary oligosaccharides (including AMY1-generated starch hydrolysates) and disaccharide sugars in the oral cavity into monosaccharide substrates for taste cell-expressed monsaccharide transporters (e.g., GLUTs and SGLT1). Once transported into the taste cell, glucose and other monosaccharides would be metabolized to ATP, eliciting the closure of taste cell-expressed KATP and taste cell depolarization. Together, the T1R-dependent pathway and the T1R-independent pathway described here likely account for the entirety of taste responses to caloric sugars: simultaneously blocking both pathways reduces the response to sucrose and maltose to background levels.
Our discovery of MGAM and SIS in taste cells is unprecedented. Although the location of GLUTs and SGLT1 in human oral mucosa was reported as early as 1999 (13), and their location in T1R3-positive taste cells of rodents was confirmed in 2011 (10–12), those studies were limited to glucose uptake and did not test transport of disaccharides. A sucrose stimulated sodium-preferring ion-transport system in canine lingual epithelium was reported in 1988, but SGLT1 was not identified in taste tissue at that time (33). Similarly, sucrose was shown to have the same detection threshold in WT and Tas1r3 KO mice (7), and maltose and sucrose were shown to elicit nerve and preference responses in Tas1r3 KO mice (5), but the presence of GLUTs and SGLT1 was not recognized in those studies. Our discovery of MGAM and SIS expression in mammalian taste cells explains the connected observations between those previous studies.
What is the purpose of having a T1R-independent sweet-sensing pathway in the same cells that express the T1R-dependent pathway? Much as KATP serves in the pancreas as a metabolic sensor of blood glucose levels, so too would the T1R-independent pathway serve as a sensor of metabolizable sugars. Coexpression of the brush border disaccharidases in the T1R3-positive taste cells, along with GLUTs and SGLT1, provides these cells with the ability to detect the caloric value of oligosaccharides and disaccharides, as well as of the starch hydrolysis products. Together these two pathways may serve as “coincidence detectors” for substances that are both sweet and have caloric value to provide a mechanism to evaluate the caloric value of a sweet substance. Presumably, sufficiently inhibiting KATP channels in T1R3 taste cells by elevated ATP would depolarize these cells and elicit a perception of sweetness. However, at low sugar levels that would only submaximally inhibit KATP, the addition of a noncaloric sweetener acting via T1R2+T1R3 would likely provide enhanced perception of sweet taste over that achieved by either sweetener alone. Under low metabolic conditions, the tonic activity of KATP channels would hyperpolarize the T1R3-positive cells, making it less likely that sweetener activation of T1R2+T1R3 depolarizes the taste cell. Together these two pathways underlie the unique sensory response to sucrose and other sugars. Responses to many noncaloric sweeteners, in contrast to responses to sugars, display delayed onsets and offsets (34) and lower maximal sweetness intensity (35). The higher peak-magnitude sweetness responses displayed by sugars in vivo may be explained if sugars act via nonsaturable transporters and saturable T1R2+T1R3, whereas noncaloric sweeteners act only on T1R2+T1R3. Sucrose may be the most preferred sugar because it initially stimulates the T1R2+T1R3 pathway but then yields glucose and fructose that could be transported into sweet taste cells via the T1R-independent pathway. In addition to a purely sensory role, the T1R-independent pathway may also have a role in regulating metabolism. Indeed, a robust cephalic phase insulin release (CPIR) can be induced by oral administration of glucose or sucrose, but not fructose in WT and Tas1r3 KO mice (36). The CPIR improved glucose tolerance in both strains, buttressing the physiological importance of this pathway. Given our identification here of SIS in taste cells, particularly the T1R3-positive cells that also express GLUTs and KATP, orally administered sucrose would generate sufficient glucose to stimulate the T1R-independent pathway. All or at least a portion of the glucose-elicited CPIR may be in response to GLP-1 released directly from taste cells (37). Furthermore, leptin and other circulating hormones may affect sweet taste sensitivity by acting directly on KATP channels in the T1R3-positive cells (38).
Materials and Methods
All experiments were performed under National Institutes of Health guidelines for the care and use of animals in research and approved by the Institutional Animal Care and Use Committee of Monell Chemical Senses Center or Kyushu University. All mice used for this study were in the C57BL/6J background. Transgenic mice expressing GFP under the promoter for T1R3 (T1R3-GFP) were as previously described (39). RNAs were isolated using the Pure-Link RNA mini kit from Life technologies. RT-PCR was done using Phire hot start II DNA polymerase from Life Technologies using intron spanning primer pairs (Table S2). qPCR was done using Taqman Gene Expression assays (Applied Biosystems). RNA probes for in situ hybridization were transcribed as previously described (10). Tissues for in situ hybridization and immunohistochemistry were prepared as previously described (10). Further detailed methods are provided in SI Materials and Methods.
Table S2.
RT-PCR primers and Taqman assay IDs used in this study
| Gene | RT-PCR primer sequence | Product size (bp) | Taqman assay ID |
| Mgam | For: GCCACCTGGTACGACTATGAA | 122 | Mm01163791_m1 |
| Rev: TTGTGTGGGAAAGATGTAGCC | |||
| Sis | For: GTTCGAAGGAGAAGCACTGG | 330 | Mm01210305_m1 |
| Rev: TGCGGTAGGTTAGAGCAGGT | |||
| Treh | For: CCAAGTTCAGATGGCCCAGCTCTACCA | 200 | — |
| Rev: GTCCAGGACTGCAGCTCCTGCCCCAC | |||
| Lct | For: GGGGAGTTGCTTCCATTACA | 231 | — |
| Rev: CGTACAGCTTTGAGGGCTTC | |||
| Amy1/2 | For: AACCCAAATAACAGGGATTTCC | 123 | Mm00651542_m1 |
| Rev: AGACGACAATCTCTGACCTGA | |||
| Amy2 | For: ATATGACCCACATACTTCAGATGG | 171 | — |
| Rev: CCAAGGCCTTGATGGGTTATG | |||
| Ganc | For: CACCTGCTGAGCTCTTCAAA | 498 | — |
| Rev: GGATGTCCGTAGATCCCTGA | |||
| Gapdh | For: GCATGGCCTTCCGTGTTCCTA | 108 | Mm99999915_g1 |
| Rev: GATGCCTGCTTCACCACCTTCT | |||
| Gnat3 | For: CATGGCTACACTGGGGATTG | 118 | — |
| Rev: GATTTCAGCCAGCTGTGGAG |
SI Materials and Methods
RT-PCR.
cDNAs were prepared from total RNAs isolated from FNG, FOL, and CV papillae, and nontaste (NT) lingual epithelium as described (10), with the exception of VEG, which was prepared using the Ovation One Direct kit (Nugen; cat # 3500-12) starting with a VEG-specific tissue section isolated by laser capture microdissection with a PALM microbeam device (Carl Zeiss MicroImaging). End point PCR was used to detect gene expression as previously described (10). To distinguish between the closely related Amy1 and Amy2 genes, we used one primer set that amplifies both isoforms, followed by a second primer set specific for the Amy2 gene (40). Quantitative real-time PCR was as previously described (10). PCR primers and Taqman assays used are shown in Table S2.
RNA Probes.
Two commercially available Mammalian Gene Collection verified full-length mouse cDNAs for Amy1/2 (accession BE57618) and Treh (accession BC019214), and two IMAGE mouse cDNA clones of Lct (accession AA727780) and Sis (accession BF583802) were purchased from Thermo Scientific. An IMAGE predicted full-length cDNA clone of Mgam (accession BF582236) was purchased from ImaGenes GmbH. Each stock was grown in liquid medium, and plasmid DNAs were purified using a miniplasmid kit from Qiagen. Constructs were obtained in the pCMV-SPORT6 or pT7T3D-Pacl vector. Plasmid DNAs from the above clones were purified using a Qiagen midiprep kit and sequenced by the dye terminator method at the University of Pennsylvania DNA Sequencing Facility using an ABI 96-capillary 3730XL Sequencer (Applied Biosystems). Full-length probes were generated with the digoxigenin (DIG) RNA Labeling kit (Roche) and purified by ProbeQuant G-50 microcolumns (Amersham Biosciences). Concentration and A260/A280 optical density of labeled RNA probes were checked with an ND-1000 NanoDrop reader (Thermo Fisher).
Tissue Preparation.
Adult male mice (2- to 3-mo-old C57BL/6 WT and transgenic T1r3-GFP animals housed in a reversed light cycle room) were killed by cervical dislocation during their time of active feeding. The parotid gland, jejunum, and taste papillae-containing portions of the tongue were quickly removed and briefly rinsed in ice-cold PBS. For in situ hybridization, tissues were freshly frozen in Tissue-Tek O.C.T. mounting media (Sakura) using a 100% ethanol dry ice bath and then sectioned within 1 h after dissection. For immunohistochemistry, tissues were fixed for 1 h overnight at 4 °C in 4% paraformaldehyde/1× PBS and cryoprotected in 20% sucrose/1× PBS overnight at 4 °C before embedding in O.C.T. Sections (8–10 μm thickness) were prepared using a CM3050S cryostat (Leica Microsystems) and applied on precoated microscope slides (Superfrost plus; Fisher Scientific). Sections were dried at 40 °C for 20 min and immediately used for in situ hybridization or stored at −80 °C for immunohistochemistry.
In Situ Hybridization.
Fresh sections were fixed for 10 min in 4% paraformaldehyde/1× PBS, permeabilized by a 10-min incubation at 37 °C in 1 M Tris⋅HCl (pH 8.0)/0.5 M EDTA containing 10 μg/mL proteinase K (Boehringer Mannheim), postfixed for 10 min in 4% paraformaldehyde/1× PBS, and then acetylated for 10 min. All steps were followed by three 5-min washes with diethyl pyrocarbonate- (DEPC)-treated 1× PBS. Slides were then prehybridized for 1 h at room temperature in a mixture containing 50% deionized formamide, 5× saline/sodium citrate (SSC), 5× Denhardt’s solution, 50 μL/mL salmon sperm DNA, 2.5 μL/mL of yeast tRNA, and 2.5 M EDTA in DEPC-treated water. For hybridization, aliquots of the mixture were heated at 85 °C for 10 min to denature yeast tRNA, and full-length DIG-labeled RNA probe was added to yield a concentration of 0.5 μg/mL RNA probe mixtures were heated at 85 °C for 3 min to denature the probe and then immediately chilled on ice. Hybrislip plastic coverslips (Invitrogen) were used to keep sections from drying out during hybridization, and slides were placed in a humidified chamber, sealed in a large moist zip-lock bag, and incubated at 65 °C overnight. Plastic coverslips were removed by soaking in 5× SSC prewarmed to 65 °C. Slides were washed three times for 30 min each time in 0.2× SSC and once for 10 min in PBS with 0.1× Triton X-100 (PBST). The slides were then blocked for 1 h at room temperature with 10% heat-inactivated normal goat serum, followed by a 3-h incubation at room temperature with anti-DIG alkaline phosphatase (1:1,000; Boehringer) in blocking solution. Alkaline phosphate labeling was detected by incubation overnight at room temperature in the dark with a nitroblue tetrazolium plus 5-bromo-4-chloro-3 indolyl-phosphate mixture (Roche) with levamisole (Sigma). Slides were washed in PBST, rinsed in water, dehydrated with an increasing series of ethyl alcohol, cleared with Histoclear (National Diagnostics), and coverslipped with Permount (Fisher Scientific). Antisense and sense RNA probes were used at equivalent concentrations and run in parallel in the same experiment to ensure equivalent conditions. For each experiment, in situ hybridization with positive controls with Tas1r3 or gustducin antisense probes was done on taste tissue to ensure the hybridization worked properly. In addition, in situ hybridization experiments were done on positive control tissues to confirm the quality and specificity of the RNA probes.
Immunohistochemistry.
Standard immunohistochemical techniques were used as previously described (9). Briefly, frozen sections were rehydrated with PBS. Nonspecific binding was blocked with Superblock neat (Pierce) at room temperature for 1–2 h. Sections were incubated with rabbit polyconal antisera against the C termini of mouse MGAM and SIS (1:300) (41, 42), goat anti-TREH (1:200, Cat# sc-241089 N-15; Santa Cruz Biotechnology), rabbit anti–AMY1/2 (1:400, Cat# A8273 RRID:AB_258380; Sigma-Aldrich), or rabbit anti-GANC (1:200, Cat# ab126143 RRID:AB_11127828; Abcam) overnight at 4 °C in a humidified chamber. In control experiments with MGAM or SIS blocking peptides (41, 42), or AMY1/2 in lyophilized powder made from human saliva (Cat#: A1031-1KU; Sigma-Aldrich), the antibodies were preincubated at room temperature with a 10-fold excess of the respective blocking peptide for 1 h before incubation with tissue sections. Antibodies directed against taste cell type markers were used to label type I cells [rabbit anti-Ectonucleoside triphosphate diphosphohydrolase 2 (NTPDase2), 1:500; J. Sévigny, Laval University, Quebec, Canada; Cat# NTPDase2 RRID:AB_2314986; Centre de Recherche du CHUL, Quebec, Canada], type II cells [guinea pig anti-transient receptor potential cation channel subfamily M member 5 (TRPM5) (1:500, unpurified polyconal; Emily Liman, University of Southern California, Los Angeles)] (43), and type III cells [goat anti-serotonin (5HT), 1:500, Cat# ab66047 RRID:AB_1142794; Abcam]. For 5HT detection, mice were injected with 80 mg/kg of 5-hydroxy-l-tryptophan (H9772; Sigma-Aldrich) 1 h before death. A mouse anti-VILLIN antibody (1:500, Cat#sc-58897 RRID:AB_2304475; Santa Cruz Biotechnology) was used to label taste cell microvilli at the taste pore (21). After three 15-min washes with PBST, slides were incubated for 1 h at room temperature with one of the following fluorescent secondary antibodies (1:500) in blocking buffer. Alexa488 donkey anti-rabbit (Molecular Probes) was used for immunofluorescence of rabbit primaries. All double-immunofluorescent labeling was done with combinations of the secondary antibodies Alexa594 donkey ant-guinea pig and Alexa647 donkey anti-goat (1:500; all from Invitrogen), along with DAPI (1:1,000; Invitrogen) to label cell nuclei for cell counting. Double labeling with two antibodies made from the same host was done according to a procedure supplied by Jackson Immunoresearch. The secondary antibodies used were Dylight 488-conjugated and 649-conjugated AffiniPure Fab fragment donkey anti-rabbit. After blocking, the sections were incubated in succession: first primary anti-rabbit antibody overnight at 4 °C, first fluorescence Fab fragment secondary for 1 h at room temperature, unlabeled anti-rabbit antisera and AffiniPure Fab fragment donkey anti-rabbit IgG (H+L) for 2–3 h at room temperature to ensure that all rabbit sites are occupied, second primary anti-rabbit antibody overnight at 4 °C, and then second fluorescence Fab fragment secondary for 1 h at room temperature. Controls for the double immunohistochemistry experiments with two rabbit primary antibodies were done without donkey Fab fragment incubation following the first secondary antibody and omitting the second primary antibody (Fig. S4A) or with donkey Fab fragment incubation and omitting the second primary antibody (Fig. S4B) to show adequate blocking of rabbit IgG by donkey Fab fragment.
Imaging.
Bright-field images were visualized using either a Nikon DXM 1200C digital camera attached to a Nikon Eclipse 80i microscope and captured using Nikon NIS-Element F 3.00 software or a SPOT digital camera (Diagnostic Instruments) attached to a Nikon SA Microphot microscope and were minimally processed using Image-Pro Plus image analysis software (Media Cybernetics). Acquisition parameters were held constant for in situ hybridization with both antisense and sense probes. Fluorescent images were captured with the TCS SP2 Spectral Confocal Microscope (Leica Microsystems) using UV, Ar, GeNe, and HeNe lasers, as well as appropriate excitation spectra. Scanware software (Leica Microsystems) was used to acquire z-series stacks captured at a step size of 0.25–0.35 μm. Images were scanned using a 512 × 512 pixel format in which each line was scanned twice and each frame (a single complete scan) scanned three times to improve the quality of the image. Acquisition parameters (i.e., gain, offset, photomultiplier tube settings) were held constant for experiments with antibodies and for controls without antibodies. Digital images were cropped and arranged using Photoshop CS (Adobe Systems). Related antisense and sense images were adjusted at the same brightness and contrast. Fluorescence images within a figure were adjusted for brightness and contrast for background standardization.
Cell Counting.
Quantitative measurements were conducted to determine the percentage of singly and doubly labeled type II (TRPM5) and type III (5HT) taste cells that coexpressed MGAM or SIS. Taste bud-containing sections were scanned under a 20× objective on the Leica TCS SP2 confocal microscope and digitally zoomed to yield a 100- to 150-μm2 area in which individual taste cells could be easily distinguished; only those labeled taste cells for which the entire nucleus could be visualized by the presence of DAPI were counted. Sections from two mice were counted.
Chorda Tympani Nerve Recording.
Gustatory nerve responses to lingual application of tastants were recorded from the chorda tympani (CT) branch of the facial nerve as previously described (5). Under pentobarbital anesthesia (50–60 mg/kg body weight), the trachea of each mouse was cannulated, and the mouse was then fixed in the supine position with a head holder to allow dissection of the CT nerve. The right CT nerve was dissected free from surrounding tissues after removal of the pterygoid muscle and cut at the point of its entry to the bulla. The entire nerve was placed on an Ag/AgCl electrode. An indifferent electrode was placed in nearby tissue. Neural activities were fed into an amplifer (K-1; Iyodenshikagaku) and monitored on an oscilloscope and audiomonitor. Whole nerve responses were integrated with a time constant of 1.0 s and recorded on a computer using a PowerLab system (PowerLab/sp4; AD Instrument). For taste stimulation, the anterior half of the tongue was enclosed in a flow chamber made of silicone rubber. Taste solutions [100 mM NH4Cl, 500 mM sucrose, 500 mM maltose, 500 mM glucose, 500 mM fructose, 1 mM SC45674, 100 mM NaCl, 10 mM quinine-HCl, 10 mM citric acid, 100 mM monopotassium glutamate (MPG)] were delivered to the tongue by gravity flow and flowed over the tongue for 30 s. The tongue was washed with distilled water for an interval of ∼1 min between successive stimulation. Only responses from stable recordings were used in data analysis. Recordings were taken before application, after application, and after 10-min washing out the α-glucosidase inhibitors miglitol and voglibose. For the after inhibitor application condition, miglitol (500 μM) or voglibose (10 μM) was applied to the tongue using a saturated cotton swab for 60 s before testing taste stimuli, followed by rinsing the tongue for 30 s with distilled water, followed by application of taste stimuli for 30 s. Integrated whole nerve response magnitudes were measured 5, 10, 15, 20, and 25 s after stimulus onset, averaged, and normalized to responses to 100 mM NH4Cl to account for mouse to mouse variations in absolute response magnitudes. This relative response was used for statistical analysis. Two-way ANOVA and the post hoc t test were used to statistically evaluate the differences in responses to a series of tastants before treatment with inhibitor, after incubation with inhibitor, and after washout of α-glucosidase inhibitors applied to the tongue. Statistical analyses were performed using the statistical software packages IBM SPSS Statistics (IBM).
Acknowledgments
We thank Drs. Louise Slade, Juyun Lim, and Anthony Sclafani for carefully reading the manuscript and providing critical comments. This work was supported by National Institutes of Health-National Institution on Deafness and Other Communication Disorders (NIH-NIDCD) Grants R01DC03155 and R01DC014105 (to R.F.M.) and Japan Society for the Promotion of Science (JSPS) Grants KAKENHI 15H02571 and 26670810 (to Y.N.), 15K11044 (to N.S.), and 25.4608 (to S.I.). Imaging was performed at the Monell Histology and Cellular Localization Core, which is supported, in part, by funding from NIH-NIDCD Core Grant P30DC011735 and National Science Foundation Grant DBI-0216310 (to Gary Beauchamp).
Footnotes
The authors declare no conflict of interest.
This article is a PNAS Direct Submission.
This article contains supporting information online at www.pnas.org/lookup/suppl/doi:10.1073/pnas.1520843113/-/DCSupplemental.
References
- 1.Treesukosol Y, Smith KR, Spector AC. The functional role of the T1R family of receptors in sweet taste and feeding. Physiol Behav. 2011;105(1):14–26. doi: 10.1016/j.physbeh.2011.02.030. [DOI] [PMC free article] [PubMed] [Google Scholar]
- 2.Jiang P, et al. The cysteine-rich region of T1R3 determines responses to intensely sweet proteins. J Biol Chem. 2004;279(43):45068–45075. doi: 10.1074/jbc.M406779200. [DOI] [PubMed] [Google Scholar]
- 3.Jiang P, et al. Identification of the cyclamate interaction site within the transmembrane domain of the human sweet taste receptor subunit T1R3. J Biol Chem. 2005;280(40):34296–34305. doi: 10.1074/jbc.M505255200. [DOI] [PubMed] [Google Scholar]
- 4.Cui M, et al. The heterodimeric sweet taste receptor has multiple potential ligand binding sites. Curr Pharm Des. 2006;12(35):4591–4600. doi: 10.2174/138161206779010350. [DOI] [PubMed] [Google Scholar]
- 5.Damak S, et al. Detection of sweet and umami taste in the absence of taste receptor T1r3. Science. 2003;301(5634):850–853. doi: 10.1126/science.1087155. [DOI] [PubMed] [Google Scholar]
- 6.Zhao GQ, et al. The receptors for mammalian sweet and umami taste. Cell. 2003;115(3):255–266. doi: 10.1016/s0092-8674(03)00844-4. [DOI] [PubMed] [Google Scholar]
- 7.Delay ER, Hernandez NP, Bromley K, Margolskee RF. Sucrose and monosodium glutamate taste thresholds and discrimination ability of T1R3 knockout mice. Chem Senses. 2006;31(4):351–357. doi: 10.1093/chemse/bjj039. [DOI] [PubMed] [Google Scholar]
- 8.Reed DR, Bachmanov AA, Beauchamp GK, Tordoff MG, Price RA. Heritable variation in food preferences and their contribution to obesity. Behav Genet. 1997;27(4):373–387. doi: 10.1023/a:1025692031673. [DOI] [PMC free article] [PubMed] [Google Scholar]
- 9.Kitagawa M, Kusakabe Y, Miura H, Ninomiya Y, Hino A. Molecular genetic identification of a candidate receptor gene for sweet taste. Biochem Biophys Res Commun. 2001;283(1):236–242. doi: 10.1006/bbrc.2001.4760. [DOI] [PubMed] [Google Scholar]
- 10.Yee KK, Sukumaran SK, Kotha R, Gilbertson TA, Margolskee RF. Glucose transporters and ATP-gated K+ (KATP) metabolic sensors are present in type 1 taste receptor 3 (T1r3)-expressing taste cells. Proc Natl Acad Sci USA. 2011;108(13):5431–5436. doi: 10.1073/pnas.1100495108. [DOI] [PMC free article] [PubMed] [Google Scholar]
- 11.Merigo F, Benati D, Cristofoletti M, Osculati F, Sbarbati A. Glucose transporters are expressed in taste receptor cells. J Anat. 2011;219(2):243–252. doi: 10.1111/j.1469-7580.2011.01385.x. [DOI] [PMC free article] [PubMed] [Google Scholar]
- 12.Toyono T, Seta Y, Kataoka S, Oda M, Toyoshima K. Differential expression of the glucose transporters in mouse gustatory papillae. Cell Tissue Res. 2011;345(2):243–252. doi: 10.1007/s00441-011-1210-x. [DOI] [PubMed] [Google Scholar]
- 13.Oyama Y, et al. Carrier-mediated transport systems for glucose in mucosal cells of the human oral cavity. J Pharm Sci. 1999;88(8):830–834. doi: 10.1021/js980298f. [DOI] [PubMed] [Google Scholar]
- 14.McBurney DH. Gustatory cross adaptation between sweet-tasting compounds. Percept Psychophys. 1972;11(3):225–227. [Google Scholar]
- 15.Schiffman SS, Cahn H, Lindley MG. Multiple receptor sites mediate sweetness: Evidence from cross adaptation. Pharmacol Biochem Behav. 1981;15(3):377–388. doi: 10.1016/0091-3057(81)90266-5. [DOI] [PubMed] [Google Scholar]
- 16.Quezada-Calvillo R, et al. Contribution of mucosal maltase-glucoamylase activities to mouse small intestinal starch alpha-glucogenesis. J Nutr. 2007;137(7):1725–1733. doi: 10.1093/jn/137.7.1725. [DOI] [PubMed] [Google Scholar]
- 17.Robayo-Torres CC, Quezada-Calvillo R, Nichols BL. Disaccharide digestion: Clinical and molecular aspects. Clin Gastroenterol Hepatol. 2006;4(3):276–287. doi: 10.1016/j.cgh.2005.12.023. [DOI] [PubMed] [Google Scholar]
- 18.Dahlqvist A, Thomson DL. Separation and characterization of two rat-intestinal amylases. Biochem J. 1963;89:272–277. doi: 10.1042/bj0890272. [DOI] [PMC free article] [PubMed] [Google Scholar]
- 19.Simsek M, Quezada-Calvillo R, Ferruzzi MG, Nichols BL, Hamaker BR. Dietary phenolic compounds selectively inhibit the individual subunits of maltase-glucoamylase and sucrase-isomaltase with the potential of modulating glucose release. J Agric Food Chem. 2015;63(15):3873–3879. doi: 10.1021/jf505425d. [DOI] [PubMed] [Google Scholar]
- 20.Lin AH, et al. Unexpected high digestion rate of cooked starch by the Ct-maltase-glucoamylase small intestine mucosal α-glucosidase subunit. PLoS One. 2012;7(5):e35473. doi: 10.1371/journal.pone.0035473. [DOI] [PMC free article] [PubMed] [Google Scholar]
- 21.Höfer D, Drenckhahn D. Localisation of actin, villin, fimbrin, ezrin and ankyrin in rat taste receptor cells. Histochem Cell Biol. 1999;112(1):79–86. doi: 10.1007/s004180050394. [DOI] [PubMed] [Google Scholar]
- 22.Ghani U. Re-exploring promising α-glucosidase inhibitors for potential development into oral anti-diabetic drugs: Finding needle in the haystack. Eur J Med Chem. 2015;103:133–162. doi: 10.1016/j.ejmech.2015.08.043. [DOI] [PubMed] [Google Scholar]
- 23.Yook C, Robyt JF. Reactions of alpha amylases with starch granules in aqueous suspension giving products in solution and in a minimum amount of water giving products inside the granule. Carbohydr Res. 2002;337(12):1113–1117. doi: 10.1016/s0008-6215(02)00107-6. [DOI] [PubMed] [Google Scholar]
- 24.Robyt JF, French D. The action pattern of porcine pancreatic alpha-amylase in relationship to the substrate binding site of the enzyme. J Biol Chem. 1970;245(15):3917–3927. [PubMed] [Google Scholar]
- 25.Robyt JF, French D. Multiple attach hypothesis of alpha-amylase action: Action of porcine pancreatic, human salivary, and Aspergillus oryzae alpha-amylases. Arch Biochem Biophys. 1967;122(1):8–16. doi: 10.1016/0003-9861(67)90118-x. [DOI] [PubMed] [Google Scholar]
- 26.Ferraris RP. Dietary and developmental regulation of intestinal sugar transport. Biochem J. 2001;360(Pt 2):265–276. doi: 10.1042/0264-6021:3600265. [DOI] [PMC free article] [PubMed] [Google Scholar]
- 27.Margolskee RF, et al. T1R3 and gustducin in gut sense sugars to regulate expression of Na+-glucose cotransporter 1. Proc Natl Acad Sci USA. 2007;104(38):15075–15080. doi: 10.1073/pnas.0706678104. [DOI] [PMC free article] [PubMed] [Google Scholar]
- 28.Mace OJ, Affleck J, Patel N, Kellett GL. Sweet taste receptors in rat small intestine stimulate glucose absorption through apical GLUT2. J Physiol. 2007;582(Pt 1):379–392. doi: 10.1113/jphysiol.2007.130906. [DOI] [PMC free article] [PubMed] [Google Scholar]
- 29.Merigo F, et al. Amylase expression in taste receptor cells of rat circumvallate papillae. Cell Tissue Res. 2009;336(3):411–421. doi: 10.1007/s00441-009-0789-7. [DOI] [PubMed] [Google Scholar]
- 30.Sbarbati A, Crescimanno C, Osculati F. The anatomy and functional role of the circumvallate papilla/von Ebner gland complex. Med Hypotheses. 1999;53(1):40–44. doi: 10.1054/mehy.1997.0708. [DOI] [PubMed] [Google Scholar]
- 31.Lavrenova TP, Presnova VN. Rat liver neutral alpha-glucosidase: Isolation and characterization. Biochem Mol Biol Int. 1994;32(4):671–679. [PubMed] [Google Scholar]
- 32.Agius L. Glucokinase and molecular aspects of liver glycogen metabolism. Biochem J. 2008;414(1):1–18. doi: 10.1042/BJ20080595. [DOI] [PubMed] [Google Scholar]
- 33.Mierson S, DeSimone SK, Heck GL, DeSimone JA. Sugar-activated ion transport in canine lingual epithelium. Implications for sugar taste transduction. J Gen Physiol. 1988;92(1):87–111. doi: 10.1085/jgp.92.1.87. [DOI] [PMC free article] [PubMed] [Google Scholar]
- 34.DuBois GE, Lee JF. A simple technique for the evaluation of temporal taste properties. Chem Senses. 1983;7(3-4):237–247. [Google Scholar]
- 35.DuBois GE, et al. In: Sweeteners: Discovery, Molecular Design, and Chemoreception. Walters DE, Orthoefer FT, DuBois GE, editors. American Chemical Society; Washington, DC: 1991. pp. 261–276. [Google Scholar]
- 36.Glendinning JI, et al. Sugar-induced cephalic-phase insulin release is mediated by a T1r2+T1r3-independent taste transduction pathway in mice. Am J Physiol Regul Integr Comp Physiol. 2015;309(5):R552–R560. doi: 10.1152/ajpregu.00056.2015. [DOI] [PMC free article] [PubMed] [Google Scholar]
- 37.Kokrashvili Z, et al. Endocrine taste cells. Br J Nutr. 2014;111(Suppl 1):S23–S29. doi: 10.1017/S0007114513002262. [DOI] [PMC free article] [PubMed] [Google Scholar]
- 38.Yoshida R, et al. Leptin suppresses mouse taste cell responses to sweet compounds. Diabetes. 2015;64(11):3751–3762. doi: 10.2337/db14-1462. [DOI] [PMC free article] [PubMed] [Google Scholar]
- 39.Damak S, Mosinger B, Margolskee RF. Transsynaptic transport of wheat germ agglutinin expressed in a subset of type II taste cells of transgenic mice. BMC Neurosci. 2008;9:96. doi: 10.1186/1471-2202-9-96. [DOI] [PMC free article] [PubMed] [Google Scholar]
- 40.Sugino H. Comparative genomic analysis of the mouse and rat amylase multigene family. FEBS Lett. 2007;581(3):355–360. doi: 10.1016/j.febslet.2006.12.039. [DOI] [PubMed] [Google Scholar]
- 41.Ubelmann F, et al. Enterocyte loss of polarity and gut wound healing rely upon the F-actin-severing function of villin. Proc Natl Acad Sci USA. 2013;110(15):E1380–E1389. doi: 10.1073/pnas.1218446110. [DOI] [PMC free article] [PubMed] [Google Scholar]
- 42.Nichols BL, et al. Milk glucosidase activity enables suckled pup starch digestion. Mol Cell Pediatr. 2016;3(1):4. doi: 10.1186/s40348-016-0032-z. [DOI] [PMC free article] [PubMed] [Google Scholar]
- 43.Zhang Z, Zhao Z, Margolskee R, Liman E. The transduction channel TRPM5 is gated by intracellular calcium in taste cells. J Neurosci. 2007;27(21):5777–5786. doi: 10.1523/JNEUROSCI.4973-06.2007. [DOI] [PMC free article] [PubMed] [Google Scholar]


