Significance
It is well known that because of constant metabolic flow and interconnectivity, alteration of any one step in lipid metabolism can lead to changes in many lipid metabolites. Therefore, the exact metabolites causing lipid metabolic diseases are often elusive. By creating a new genetic model, we uncoupled the changes of long-chain bases and ceramide that are caused by ceramide synthase 1 deficiency. This work sheds light on the neurotoxicity of sphingolipid precursors, the long-chain bases, in neurodegenerative diseases.
Keywords: sphingolipid, ceramide synthase, ceramide, long-chain base, neurodegeneration
Abstract
Sphingolipids exhibit extreme functional and chemical diversity that is in part determined by their hydrophobic moiety, ceramide. In mammals, the fatty acyl chain length variation of ceramides is determined by six (dihydro)ceramide synthase (CerS) isoforms. Previously, we and others showed that mutations in the major neuron-specific CerS1, which synthesizes 18-carbon fatty acyl (C18) ceramide, cause elevation of long-chain base (LCB) substrates and decrease in C18 ceramide and derivatives in the brain, leading to neurodegeneration in mice and myoclonus epilepsy with dementia in humans. Whether LCB elevation or C18 ceramide reduction leads to neurodegeneration is unclear. Here, we ectopically expressed CerS2, a nonneuronal CerS producing C22–C24 ceramides, in neurons of Cers1-deficient mice. Surprisingly, the Cers1 mutant pathology was almost completely suppressed. Because CerS2 cannot replenish C18 ceramide, the rescue is likely a result of LCB reduction. Consistent with this hypothesis, we found that only LCBs, the substrates common for all of the CerS isoforms, but not ceramides and complex sphingolipids, were restored to the wild-type levels in the Cers2-rescued Cers1 mutant mouse brains. Furthermore, LCBs induced neurite fragmentation in cultured neurons at concentrations corresponding to the elevated levels in the CerS1-deficient brain. The strong association of LCB levels with neuronal survival both in vivo and in vitro suggests high-level accumulation of LCBs is a possible underlying cause of the CerS1 deficiency-induced neuronal death.
Sphingolipids carry out essential functions in eukaryotes (1). The hydrophobic moiety of sphingolipids, called ceramide, is a fatty acylated long-chain base (LCB). LCBs can differ in their degree of saturation (e.g., sphingosine vs. dihydrosphingosine/sphinganine) or hydroxylation (e.g., sphingosine vs. phytosphingosine) (2). LCBs and their phosphorylated derivatives are potent signaling molecules (3). Moreover, accumulation of aberrant deoxy-LCBs has recently been linked to hereditary sensory and autonomic neuropathy type 1 and taxane-induced peripheral neuropathy (4–6). Very high concentrations (100 µM) of regular LCBs are also toxic to cultured neurons (7, 8). In addition, intoxication with fumonisin B1, a fungal ceramide synthase inhibitor causing elevation of LCBs and reduction of ceramides, leads to neural tube and neurological defects in humans and cattle (9). However, whether accumulation of regular LCBs in vivo or LCB treatment at physiologically relevant concentrations in vitro causes neuron death or damage has not been thoroughly investigated.
The fatty acyl chain of ceramide can also vary in chain lengths, saturation, and hydroxylation (2). Emerging evidence suggests specific functions for different ceramide species. For instance, ceramide with a C18 fatty acyl chain (C18 ceramide) has been suggested to cause apoptosis in certain cancer cells, whereas ceramide with a C16 fatty acyl chain (C16 ceramide) has been considered prosurvival (10–12). The ceramide profile changes in aging and neurodegenerative brains, but whether these alterations contribute to the pathogenesis, and the biological significance of ceramide diversity, are unknown (13).
(Dihydro)ceramide synthase (CerS1–CerS6) isoforms synthesize (dihydro)ceramide, using a shared LCB substrate, dihydrosphingosine or sphingosine (14). Each CerS uses a selection of different, sometimes overlapping fatty acyl-CoA substrates, and therefore produces a spectrum of ceramide species (15). CerS1–CerS6 also display different expression patterns. For instance, CerS1 produces C18 ceramide and is neuron-specific in the brain, whereas CerS2 synthesizes C22 and C24 ceramides but is mainly present in oligodendrocytes in the brain (16, 17).
A Cers1 polymorphism resulting in increased CerS1 activity has been shown to correlate with enhanced longevity in humans (18). Conversely, a mutation reducing CerS1 activity has been associated with myoclonus epilepsy and dementia (19). In mice, we and others have shown that loss of CerS1 activity triggers early-onset cerebellar ataxia and cerebellar Purkinje cell degeneration, with ubiquitin-positive lipofuscin-like deposits in the brain (20, 21). Brain sphingolipid profiling revealed profound changes, including a >50% decrease of C18 ceramide species and, consequently, significant reduction of the total ceramide level and drastic increase of dihydrosphingosine and sphingosine, the LCB substrates shared by all CerS isoforms (20). However, it was not clear which of these changes (e.g., the increase in LCBs or the decrease in C18 ceramide) was causal to the pathologies. Also, it is not known whether ceramide species with different fatty acyl chains are interchangeable, nor do we know whether different ceramide synthases can be functionally interchangeable. To answer these questions, we set out to uncouple the production of C18 ceramide with accumulation of LCBs by modulating ceramide biosynthesis in Cers1-deficient mutant brains through ectopic expression of the nonneuronal CerS2 that produces C22 and C24 instead of C18 ceramides in the neurons (16, 17).
Results
Generation of Neuron-Specific Cers2 Transgenic Mice.
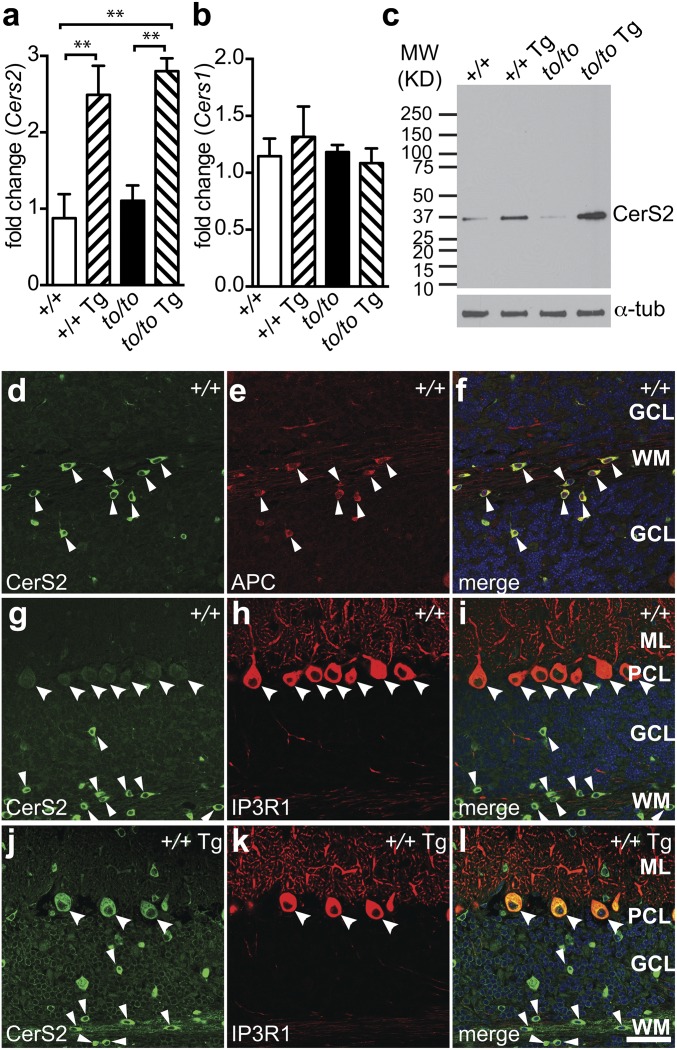
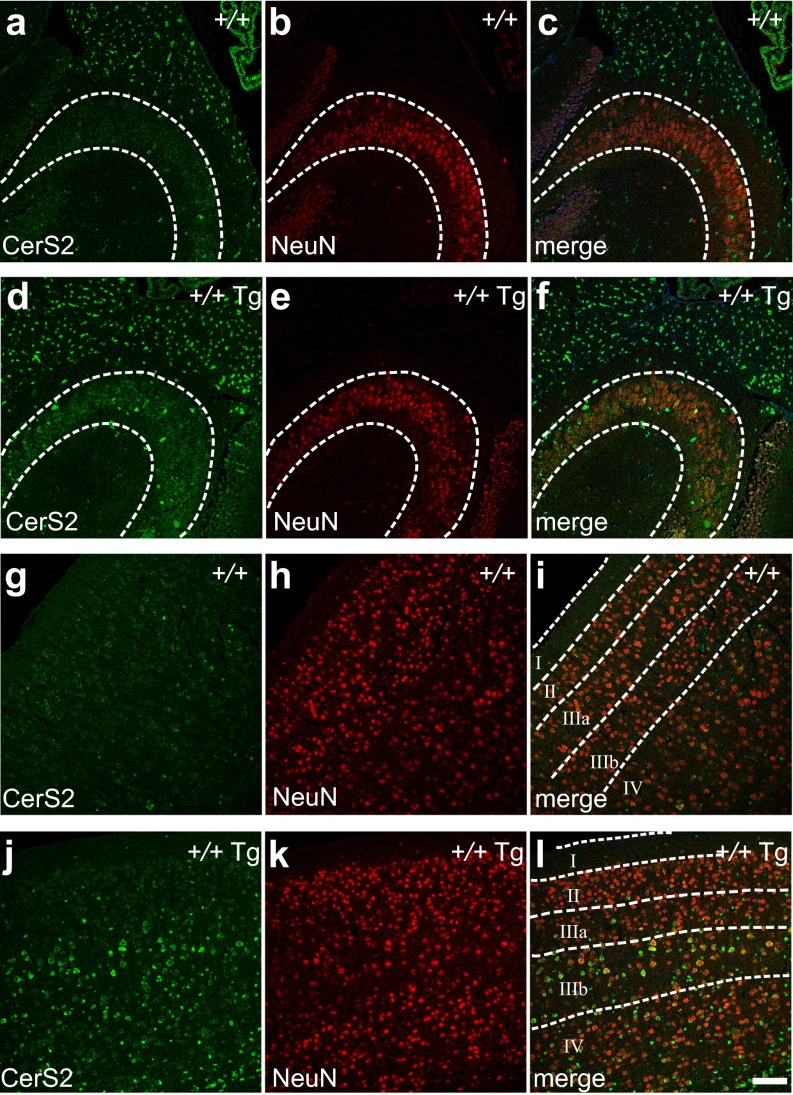
The Cers2 coding sequence was placed downstream of the rat neuron-specific enolase 2 promoter (Eno2) (22). A transgenic mouse line, C57BL/6J-Tg(Eno2-Cers2)7Pjn (hereafter referred to as Tg-Cers2), was selected to cross with the toppler (FVB/N-Cers1to) mutant, which bears a loss-of-function mutation of Cers1 (20). Whole brains of F2 mice were collected for analyses. Real-time quantitative PCR showed that Cers2 transcript levels were increased by two- to threefold in Cers1+/+;Tg-Cers2 or Cers1to/to;Tg-Cers2 brains compared with wild-type (Cers1+/+) or Cers1to/to mice (Fig. 1A), but the Cers1 mRNA level was unaffected (Fig. 1B). Consistently, CerS2 protein levels were also increased by expression of the transgene (Fig. 1C). In agreement with previous reports (17), in wild-type mice, CerS2 is only expressed in oligodendrocytes [adenomatous polyposis coli (APC)-positive] (Fig. 1 D–F), but not neurons such as Purkinje cells (IP3R1-positive) and granule neurons in the cerebellum (Fig. 1 G–I). In contrast, in Tg-Cers2 cerebella, strong CerS2 staining was found in Purkinje cells in addition to oligodendrocytes (Fig. 1 J–L). Cerebellar granule neurons also display clear increase of CerS2 protein expression (Fig. 1 J–L). Similarly, hippocampal neurons in wild-type mice displayed extremely low CerS2 protein level (Fig. S1 A–C), whereas Tg-Cers2 hippocampal neurons showed much increased CerS2 expression (Fig. S1 D–F). In addition, CerS2 level was low in wild-type cerebral cortical neurons (Fig. S1 G–I), but was strongly elevated in the Tg-Cers2 cortical neurons, except those in layers II and IIIa (Fig. S1 J–L). Thus, our results confirmed the pan-neuronal expression of CerS2 in mice carrying the Tg-Cers2 transgene.
Fig. 1.
Cerebellar neuronal expression of CerS2 from a transgene. (A and B) Real-time PCR results showing changes of the expression of Cers2 (A) and Cers1 (B) transcripts in brains of 4-wk-old Cers1 wild-type (+/+), Cers1 wild-type with the neuron-specific Cers2 transgene (+/+ Tg), homozygous Cers1 toppler mutant (to/to), and Cers1 toppler mutant with the Cers2 transgene (to/to Tg). Values are mean ± SD (three mouse samples, four technical replicates for each sample). **P ≤ 0.01 (one-way ANOVA, multiple comparisons). (C) A representative Western blot analysis showing the CerS2 protein level in the brain. Genotypes of mice are as described in A and B. The blot was redeveloped with an antibody against α-tubulin as a loading control. (D–l) Immunohistochemistry of brain sections from 4-wk-old wild-type (D–I, +/+) and Tg-CerS2 (J–L, +/+ Tg) mice, using antibodies against CerS2 (D, G, and J), APC (E), and IP3R (H and K). Merged images are also shown (F, I, and L). Purkinje cells and oligodendrocytes are marked with large and small arrowheads, respectively. Cerebellar cell layers are labeled as GCL (granule cell layer), WM (white matter), ML (molecular layer), or PCL (Purkinje cell layer). (Scale bar, 50 µm.)
Fig. S1.
Cerebral neuronal expression of CerS2 from a transgene. (A–F) CerS2 expression in the hippocampa (areas enclosed by dashed lines) from the wild-type (A–C, +/+) and Tg-CerS2 (D–F, +/+ Tg) mice, using antibodies against CerS2 (A and D) and NeuN (B and E). Merged images were shown (C and F). (G–L) CerS2 expression in the cerebral cortex from the wild-type (G–I, +/+) and Tg-CerS2 (J–L, +/+ Tg) mice using antibodies against CerS2 (G and J) and NeuN (H and K). Cortical layers (I–IV) are delineated by dashed lines in merged images (I and L). (Scale bar, 100 µm.)
Neuron-Specific Cers2 Expression Suppresses Cers1 Mutant Phenotype.
Cers1to/to mutants display early-onset ataxia (20), whereas Cers1to/to;Tg-CerS2 mice did not show cerebellar ataxia, even at 1 y of age. Moreover, none of the mice carrying the Tg-Cers2 transgene alone in the Cers1 wild-type background (Cers1+/+;Tg-Cers2) exhibited any locomotor defects. Thus, ectopic neuronal expression of Cers2 is sufficient to correct the behavioral defects caused by Cers1 deficiency in mice neurons.
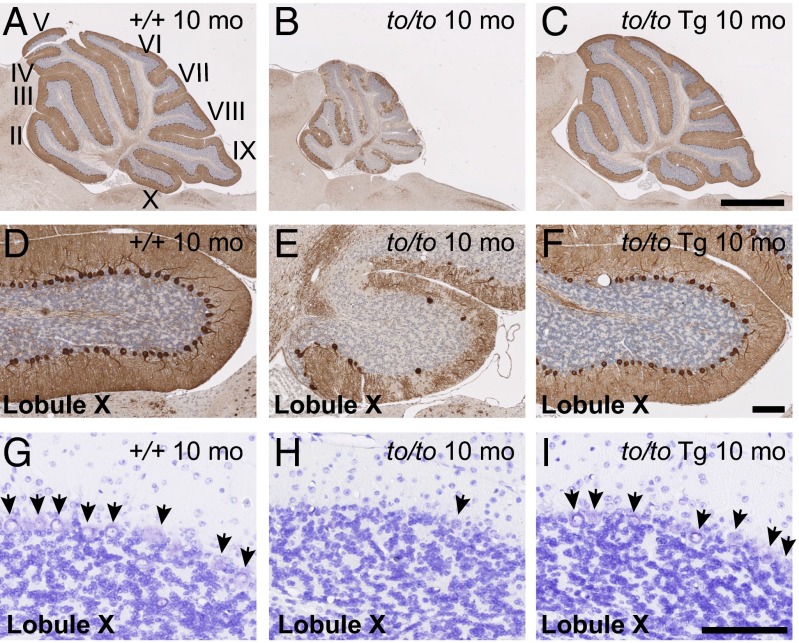
Purkinje cell loss in Cers1to/to mutants started around 3 wk after birth (20) and was quite obvious by 10 mo, as shown by immunohistochemistry with antibodies to Purkinje cell marker calbindin D-28 (Fig. 2 A and B). Tg-Cers2 alone did not cause visible changes in Purkinje cells in Cers1 wild-type mice. Importantly, in Cers1to/to;Tg-Cers2 cerebella, Purkinje cells were intact (Fig. 2C), and Cers2 transgene indeed suppressed Purkinje cell loss (Fig. 2 D–F). This was also confirmed by cresyl violet staining (Fig. 2 G–I). Thus, ectopic expression of CerS2 was sufficient to compensate for the loss of functional CerS1 that is critical for Purkinje cell survival.
Fig. 2.
Neuronal expression of Cers2 suppresses Purkinje cell death caused by Cers1-deficiency. (A–F) Calbindin D-28K immunohistochemistry of cerebella from 10-mo-old wild-type (A), Cers1to/to (B), and Cers1to/to;Tg-Cers2 (C) mice. Lobule X of each cerebellum was shown in detail (D–F). Sections are close to midline. [Scale bars, 1 mm (A–C) or 100 µm (D–F).] (G–I) Cresyl Violet staining of cerebella from 10-mo-old wild-type (G), Cers1to/to (H), and Cers1to/to;Tg-Cers2 (I) mice. Detail in Lobule X was shown. Arrows point to Purkinje cells. (Scale bar, 100 µm.)
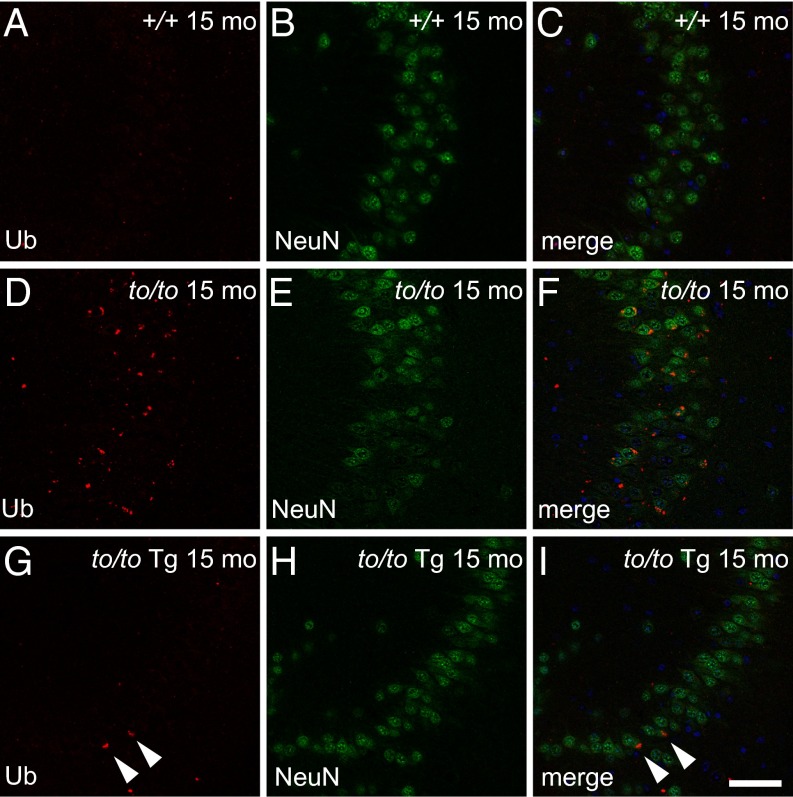
Previously, we had shown that ubiquitin-positive lipofuscin-like deposits were common in several brain regions, such as the hippocampus (20). Compared with the wild-type (Fig. 3 A–C), Cers1to/to mouse hippocampus harbored many ubiquitin-positive deposits (Fig. 3 D–F). In contrast, Cers1to/to;Tg-Cers2 mice had significantly fewer deposits in the hippocampus (Fig. 2 G–I). Therefore, neuronal expression of Cers2 greatly suppressed accumulation of ubiquitin-positive, lipofuscin-like deposits caused by Cers1 deficiency.
Fig. 3.
Neuronal expression of Cers2 suppresses accumulation of ubiquitin-positive deposits caused by Cers1 deficiency. Immunohistochemistry showing ubiquitin (A, D, and G), NeuN (B, E, and H) staining, or merge images (C, F, and I) of hippocampal CA3 region of 15-mo-old wild-type (A–C, +/+), Cers1to/to (D–F, to/to), and Cers1to/to;Tg-Cers2 (G–I, to/to Tg) mice. Two cells still harboring ubiquitin-positive deposits in the to/to Tg-Cers2 hippocampus are marked with arrowheads (G and I). Note the reduction of NeuN staining in the to/to hippocampus. (Scale bars, 50 µm.)
Neuronal Expression of CerS2 Modifies Brain Sphingolipid Profile.
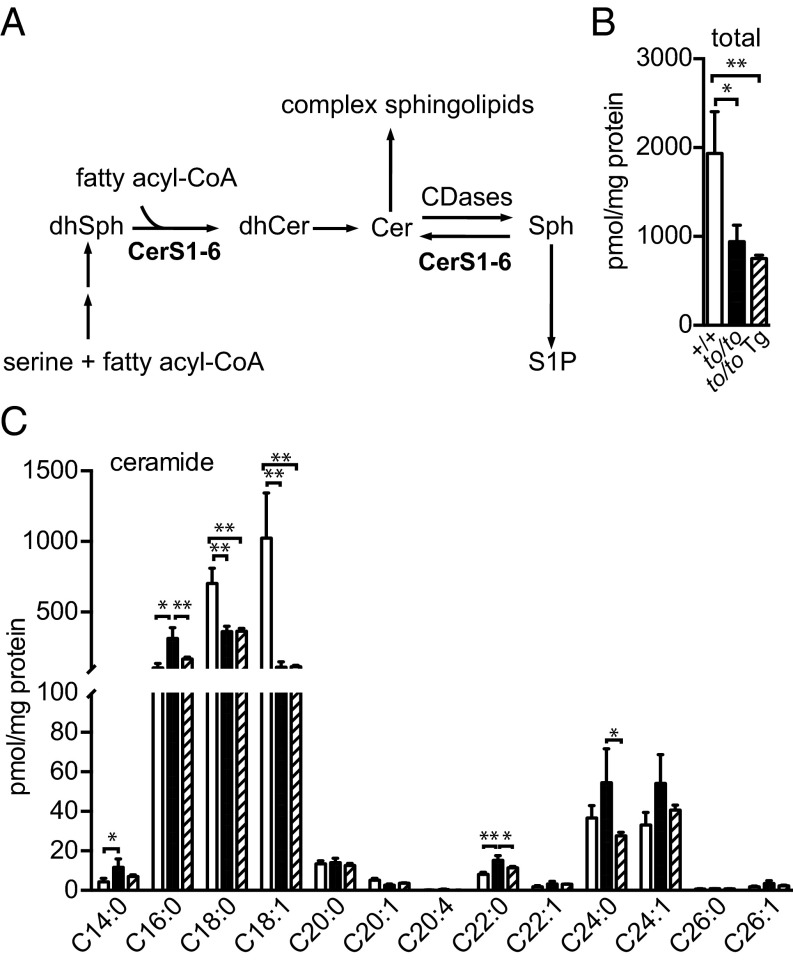
To find out how the Cers2 transgene rescued the Cers1 mutant phenotype, we examined brain sphingolipid profiles. CerSes produce (dihydro)ceramides by using LCBs (e.g., dihydrosphingosine or sphingosine) and fatty acyl-CoA as substrates (Fig. 4A). Previously, we have shown that in the brain, the loss-of-function Cers1to/to mutation caused reduction of C18 ceramide (CerS1 product), and as a result, reduction of total ceramide levels, and led to accumulation of the LCB substrates (20). To elucidate how ectopic Cers2 overexpression in Cers1to/to neurons alters sphingolipid metabolism, we compared sphingolipid profiles of Cers1to/to;Tg-Cers2 mouse brains with those of the wild-type and Cers1to/to brains.
Fig. 4.
Ceremide profiles in the brain with neuronal expression of Cers2. (A) Simplified schematic diagram of the sphingolipid biosynthesis pathway in mammal, showing key metabolites such as dihydrosphingosine (dhSph), dihydroceramide (dhCer), ceramide (Cer), sphingosine (Sph), and sphingosine-1-phosphate (S1P), as well as a few enzymes involved including ceramide synthase 1–6 (CerS1–CerS6) and ceramidases (CDases). (B and C) Brain ceramide levels of 40-d-old Cers1 wild-type (+/+, unfilled bars), homozygous Cers1to/to mutant (to/to, filled bars), and Cers1to/to;Tg-Cers2 (to/to Tg, hatched bars) mice. Profiles of total amounts of ceramides (B) and individual ceramides species (C) are shown. Three mice (n = 3) of each genotype were used. Values are mean ± SD. *P ≤ 0.05; **P ≤ 0.01 (one-way ANOVA, multiple comparisons).
To our surprise, the total amount of ceramide in Cers1to/to;Tg-Cers2 brains remained very similar to the Cers1to/to brain ceramide level, which was much lower than the ceramide level in wild-type brains (Fig. 4B). As expected, on the basis of the CerS2 substrate specificity for C22–C24 fatty acyl-CoA, C18:0 and C18:1 ceramide levels were not affected by Cers2 transgene expression (Fig. 4C). Previously, we observed that levels of C16, C22, and C24 ceramide species were increased in Cers1-deficient mouse brains, likely because of the surplus of LCBs available to other neuronal CerSes that use C16, C22, and C24 fatty acyl-CoA (20) or because of ceramidases capable of reverse activity (i.e., producing ceramides from LCBs and fatty acids) (23, 24). In this study, surprisingly, C22 and C24 ceramide species were not further elevated by transgenic expression of CerS2. Instead, the level of C16, C22, and C24 ceramide species were decreased to near wild-type levels in the Cers1to/to;Tg-Cers2 brains (Fig. 4C). Thus, similar to in Cers1to/to brains, the total amount of ceramide and the C18 ceramide level in particular were still low in Cers1to/to;Tg-Cers2 mouse brains and were not compensated by the increase of C22 and C24 ceramide species.
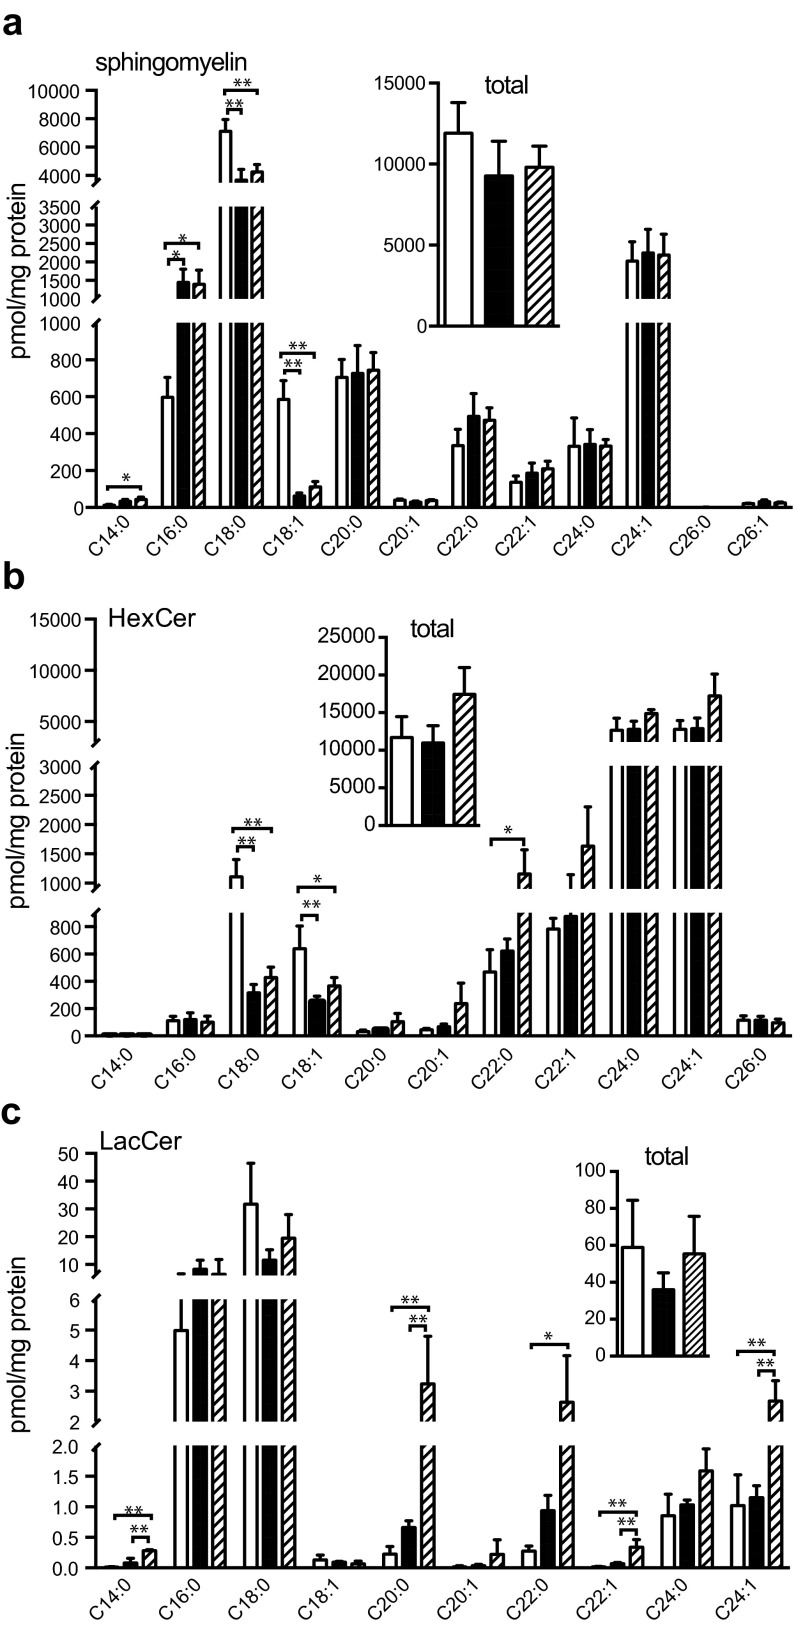
Next, we examined the levels of sphingomyelin, hexosylceramides, and the very low abundance lactosylceramides. We have shown previously that sphingomyelin species with C18 ceramide were decreased in Cers1-deficient brains, whereas those with C16 species tended to increase relative to levels in wild-type brains in parallel to the changes seen in ceramides (20). We found that transgenic expression of Cers2 did not change sphingomyelin species with different ceramide chains or the total amount of sphingomyelin in Cers1to/to brains (Fig. S2A, Inset). However, the Cers2 transgene expression did result in significant elevation of C22 and C24:1 hexosylceramides and the total amount of hexosylceramide (Fig. S2B, Inset). The rest of the hexosylceramide species were not significantly increased. Similarly, C22 and C24 lactosylceramide species displayed significant increase in Cers1to/to;Tg-Cers2 brains, although the total lactosylceramide levels were not significantly different in wild-type, Cers1to/to, and Cers1to/to;Tg-Cers2 brains (Fig. S2C, Inset). Our results indicate that neuronal Cers2 expression results in increased production of the simple C22 or C24 glycosphingolipids, presumably because the very long chain ceramides produced by CerS2 were channeled into glycosphingolipids instead of sphingomyelin. Taken together, our data showed that profiles of sphingomyelin, hexosylceramides, and lactosylceramides were not reverted to wild-type levels and were also different from those of the Cers1to/to brains, indicating that changes of these lipids are not likely to be causal to neuronal loss in Cers1 mutant mice.
Fig. S2.
Sphingomyelin and simple glycosphingolipid profiles in the brain with neuronal expression of Cers2. (A) Sphingomyelin species and total amount of sphingomyelin (Inset). (B) Hexosylceramide species and total amount of hexosylceramide (Inset). (C) Lactosylceramide species of 40-d-old Cers1 wild-type (+/+, unfilled bars), homozygous Cers1to/to mutant (filled bars), and Cers1to/to;Tg-CerS2 (hatched bars) mice. Three mice (n = 3) of each genotype were used. Values are mean ± SD. *P ≤ 0.05; **P ≤ 0.01 (one-way ANOVA, multiple comparisons).
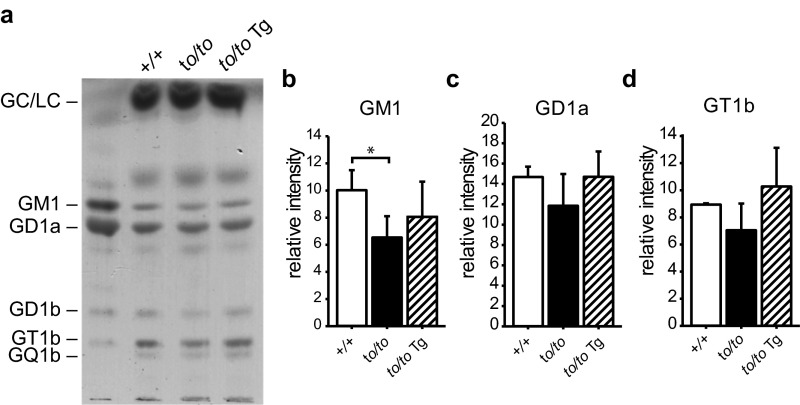
GM1 ganglioside has been reported to be lower in Cers1 knockout mouse brain (21). We observed a similar trend in the Cers1to/to mutant brain (Fig. S3 A and B). However, the reduction is minor and ectopic expression of CerS2 in neurons did not significantly change GM1 ganglioside compared with the wild-type or Cers1to/to mutant level. We did not observe significant changes of other ganglioside species such as GD1a and GT1b (Fig. S3 C and D) in the Cers1to/to mutant brains or Cers1to/to;Tg-Cers2 brains.
Fig. S3.
Gangliosides profiles in the brain with neuronal expression of Cers2. (A) TLC of gangliosides purified from the brains of 40-d-old wild-type (+/+), homozygous Cers1to/to mutant (to/to), and Cers1to/to;Tg-CerS2 (to/to Tg) mice. (B–D) Quantifications of GM1 (B), GD1a (C), and GT1b (D) gangliosides on the TLC. Three mice (n = 3) of each genotype were used. Values are mean ± SD. *P ≤ 0.05 (one-way ANOVA, multiple comparisons).
Neuronal Expression of CerS2 in the CerS1 Mutant Restored Free LCBs to Wild-Type Levels.
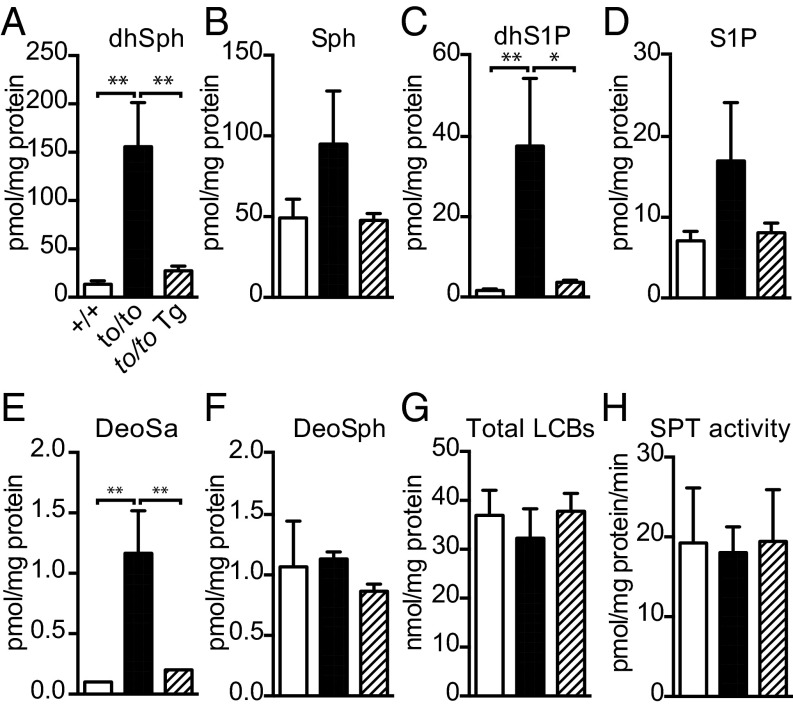
Previously, we showed that the Cers1to/to mutation also caused a drastic increase of CerS substrates, free LCBs (20). To determine whether the suppression of Cers1 mutant pathology by Tg-Cers2 might be associated with changes in free LCB levels, we quantified free LCBs in Cers1to/to;Tg-Cers2 mouse brains. Indeed, neuronal expression of Cers2 in Cers1to/to brains effectively reduced the levels of free dihydrosphingosine and sphingosine, as well as their phosphorylated metabolites, to wild-type levels (Fig. 5 A–D). We also examined 1-deoxy LCBs, including 1-deoxysphinganine (also known as spisulosine or ES-285 in chemotherapy), which has been shown to cause central nervous system neurotoxicity and peripheral neuropathy in humans (4, 5, 25–27). 1-Deoxysphinganine built up in Cers1to/to mouse brains, but the accumulation was suppressed by the Cers2 transgene expression (Fig. 5E). We did not observe significant differences of 1-deoxysphingosine in brains of different genotypes (Fig. 5F). Next, we examined the levels of total LCBs (e.g., free LCBs plus the LCB moieties in ceramides and complex sphingolipids) to assess the overall effect of CerS1 deficiency and ectopic CerS2 expression on LCB metabolism. Our data showed that, unlike free LCBs, the total LCB level was not significantly affected by CerS1 deficiency and ectopic CerS2 expression (Fig. 5G). Consistently, the SPT activity was similar in wild-type, Cers1to/to, and Cers1to/to;Tg-CerS2 mouse brains (Fig. 5H). Thus, the overall LCB metabolism was not significantly perturbed by CerS1 deficiency or CerS2 overexpression. Moreover, these results demonstrate that, unlike profiles of total ceramide, neutral glycosphingolipids, and complex sphingolipids, levels of free LCBs were fully reverted to wild-type levels by expression of the Cers2 transgene in Cers1-deficient neurons. Thus, the strong association of reduced free LCB levels with neuronal survival suggests that accumulation of free LCBs is most likely the cause of the CerS1-deficient neuropathology.
Fig. 5.
Sphingolipid metabolite profiles in the brain with neuronal expression of Cers2. (A–E) Free LCB levels in the brain, including dihydrosphingosine (dhSph; A), sphingosine (Sph, B), dihydrosphingosine-1-phosphate (dhS1P; C), sphingosine-1-phosphate (S1P; D), 1-deoxy-sphinganine (DeoSa; E), and 1-deoxy-sphingosine (DeoSph; F). (G) Total LCB levels, including free LCBs and LCB moieties in brain sphingolipids. (H) SPT activity of brain microsomes using 20 µM C16-CoA substrate. Four mice (n = 4) of wild type (+/+) and three mice (n = 3) of CerS1to/to or CerS1to/to;Tg-Cers2 were used. Values are mean ± SD. *P ≤ 0.05; **P ≤ 0.01 (one-way ANOVA, multiple comparisons).
LCBs Cause Neurite Fragmentation in Vitro.
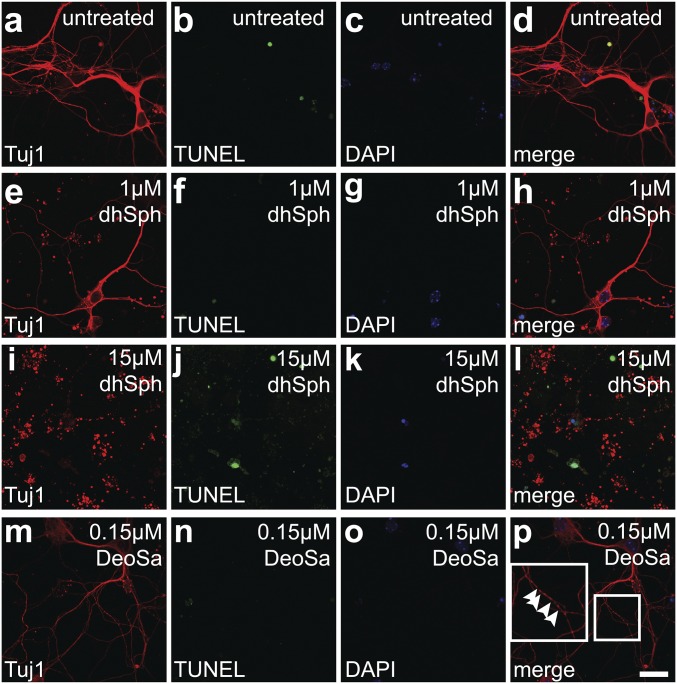
We then assessed neurotoxicity of LCBs to cultured primary neurons. To mimic the in vivo levels of LCBs, we calculated the concentrations of LCBs based on the mass spectrometry data (Fig. 5) and on the assumption that protein weight is about 10% of brain tissue wet weight, as reported previously (28). Our calculation indicated that tissue concentrations of dihydrosphingosine and 1-deoxysphinganine, two LCBs that showed most drastic increase in Cers1to/to brains, are 15 and 0.15 µM, respectively. We used these concentrations in the treatment of primary neurons. Similar to untreated neurons (Fig. 6 A–D), dihydrosphingosine at 1 µM, the concentration found in wild-type brain tissue, did not cause significant damage (Fig. 6 E–H). However, fragmentation of neurites and apoptosis were clearly visible at 15 µM, the concentration corresponding to the one in the Cers1to/to brains (Fig. 6 I–L). The 0.15-µM deoxysphinganine concentration, corresponding to the level in the CerS1-deficient brains, led to rather minor neurite damage or apoptosis, as visible by partially fragmented β tubulin III labeling or TUNEL assay, respectively (Fig. 6 M–P). Thus, our results confirmed that above physiological level, free LCBs, especially high-level dihydrosphingosine, are highly toxic to neurons.
Fig. 6.
Toxicity of LCBs to cultured neurons. (A–L). Dihydrosphingosine (dhSph) treatment of cortical neurons. Cortical neurons from E18 embryos were untreated (A–D), or treated with 1 µM (E–H) or 15 µM (I–L) dhSph. (M–P) Deoxysphinganine (DeoSa) treatment of cortical neurons. Neurons were treated with 0.15 µM DeoSa. An area is enlarged in the Inset in P to show axon fragmentation at its early stage (arrowheads). The rationale for using these dhSph and deoSa concentrations was explained in detail in the Results. Neurons, after fixation, were incubated with an antibody against neuron-specific class III β-tubulin (A, E, I, and M; Tuj1), and then subjected to TUNEL assay (B, F, J, and N) and counterstained with DAPI (C, G, K, and O). Merged images were shown (D, H, L, and P). (Scale bar, 20 µm.)
Discussion
We have generated a mouse model (Cers1to/to;Tg-Cers2) that uncoupled the changes of the shared CerS substrates, free LCBs, with the changes of the CerS products, ceramides, by ectopically expressing CerS2 in neurons of CerS1 mutant mice. The overall neurological phenotype of this model, unlike the CerS1 mutant that displays neurodegeneration, was nearly indistinguishable from that of the wild-type mice. To find out the sphingolipids causing neurodegeneration in CerS1 mutant brains and the mechanism of suppression of the CerS1 mutant pathology by ectopic expression of CerS2, we performed detailed sphingolipid profiling. Brain ceramide and sphingomyelin showed significant differences in wild-type and CerS1 mutant brains, but ectopic CerS2 expression did not significantly change the total level or the fatty acyl chain length profiles (Fig. 4 and Fig. S2A), strongly suggesting that changes in ceramide and sphingomyelin levels are likely not the cause of neurodegeneration in CerS1 mutant mice. Surprisingly, expression of Tg-CerS2 in CerS1-deficient neurons did not lead to an increase of CerS2 products, C22 and C24 ceramides. It is possible that, unlike C18 ceramide, which abundantly exists as free form in the brain, most C22 and C24 ceramides are preferably incorporated into complex sphingolipids. This hypothesis is supported by the observation that levels of C22 hexosylceramides and several very long chain lactosylceramide species are significantly increased in brains of Cers1to/to;Tg-Cers2 mice compared with the wild-type or the Cers1to/to mice (Fig. S2 B and C).
Pan-neuronal knockout of the gene encoding glucosylceramide synthase, the first enzyme in neutral and complex glycosphingolipid biosynthesis, during neural development has led to early Purkinje cell degeneration (29), but the pathogenic mechanism is not clear. It should be noted that the nestin-cre used to drive deletion of the gene is expressed in all neuronal and glia precursors, and the effect of this knockout to sphingolipid metabolism was not fully examined (i.e., whether simple sphingolipids and metabolites were affected is unclear). In contrast to the glucosylceramide synthase knockout, in our mouse models, however, the total level of hexosylceramides was not significantly altered, suggesting that in our model, reduction and replenishment of glucosylceramide is not the cause of Purkinje cell degeneration and suppression of degeneration, respectively. Particular hexosylceramides, namely, those derived from the C18 ceramide, were reduced in the CerS1-deficient mouse, but not replenished after expression of CerS2. Thus, it is unlikely that reduction of C18 hexosylceramide led to Purkinje cell degeneration. It should be noted that our data do not rule out the general importance of glucosylceramide for neural development. Similar to hexosylceramide, total lactosylceramide level was not changed by the CerS1 mutation. Furthermore, the profile of lactosylceramide species was not affected either. Therefore, lactosylceramide is likely irrelevant to CerS1 pathology.
Gangliosides, complex glycosphingolipids derived from glucosylceramide, have been found to be important for brain function. However, our data did not show significant changes in the levels of individual gangliosides, except GM1 gangliosides (Fig. S3), in contrast to the work of Ginkel et al., who reported that gangliosides were significantly reduced in CerS1 knockout brains (21). Although the model studied by Ginkel et al. is similar, it is not identical to the genetic model used in our studies; we used a CerS1 point mutant with impaired C18 ceramide synthase activity, but similar expression level as the wild-type (20). The differences in the two genetic models likely account for the discrepancies in the observed levels of the ganglioside classes. Moreover, relevant ganglioside-deficient mouse models do not recapitulate the Purkinje cell loss phenotype observed in CerS1-mutant mice (30). Although GM1-deficient mice show Wallerian degeneration and mice lacking all gangliosides display white matter vacuolization in the cerebellum, neither of these mice is known to have cerebellar Purkinje cell degeneration (31, 32). Therefore, it is unlikely that changes in ganglioside levels contributed to Purkinje cell degeneration. Most recently, an alkaline ceramidase 3 knockout mouse has shown elevation of ceramide, which was suggested to be linked to Purkinje cell degeneration (33). However, this mouse also showed elevation of LCBs, and the study did not clarify which of the elevated sphingolipids, ceramide or LCBs, was neurotoxic. In our model, the uncoupling of changes in the levels of shared substrates (LCBs) from changes in the levels of the products (ceramides with different fatty acid chain-length) strongly suggests that elevation of LCBs is the primary cause of the neuropathology in Cers1-deficient mice. Our treatments of cultured neurons using LCBs (dihydrosphingosine and 1-deoxysphinganine) at concentrations similar to the in vivo concentrations in Cers1to/to mouse brains showed that only dihydrosphingosine was highly toxic (Fig. 6 G–I), further suggesting that elevation of dihydrosphingosine is likely a major cause of neurotoxicity resulting from CerS1 deficiency.
Methods
Genetic Constructs, Mice, and Antibodies.
Primer sequences are listed in Table S1. The mouse Cers2 ORF was amplified from C57BL6/J brain cDNA, using primers LZO33 and LZO34, and inserted into the HindIII site of pNSE-Ex4 (20). Pronuclear injection was performed on fertilized C57BL/6J oocytes, as reported (20). Transgenic founders were genotyped using two sets of primers, LZO92 and LZO93 and LZO94 and LZO95. Two established transgenic lines, C57BL/6J-Tg(Eno-Cers2)7Pjn and C57BL/6J-Tg(Eno-Cers2)45Pjn, were selected to cross with the toppler (FVB/N-Cers1to) mutants. Genotyping of the toppler mutation was performed as described (20). The data obtained from the Tg(Eno-Cers2)7 line was used in this report, as the two lines have identical effects. Procedures involving mice were approved by The Jackson Laboratory’s institutional animal care and use committee according to national and international guidelines.
Table S1.
Oligo primers
| Oligo | Sequence |
| LZO33 | 5′-GATCGATCAAGCTTGACGCCGAGATGCTCCA-3′ |
| LZO34 | 5′-GATCGATCAAGCTTGCAGCTAGGACAATGGT-3′ |
| LZO92 | 5′-CATCCACCATGTGGCCACTATC-3′ |
| LZO93 | 5′-TGATAACCAGCCGAGTGATGATG-3′ |
| LZO94 | 5′-ACTGGCCTAGGCTCCACCCTTCTA-3′ |
| LZO95 | 5′-GCTTTGGCATAGACACGTCCAT-3′ |
| LZO174 | 5′-AGATGCGTGAACTGGAAGAC-3′ |
| LZO175 | 5′-GCTGAAGTTGAGGACAAGAGAC-3′ |
| LZO178 | 5′-GAACTTTCCTTCTACTGGTCCC-3′ |
| LZO179 | 5′-CGGACGTAATTGGCAAACC-3′ |
| LZO184 | 5′-CTTTGTCAAGCTCATTTCCTGG-3′ |
| LZO185 | 5′-TCTTGCTCAGTGTCCTTGC-3′ |
Primary antibodies were obtained and used as specified: rabbit polyclonal anti-CerS2 (Sigma, cat no. HPA027262; 1:1,000 dilution for Western blot, 1:500 for immunohistochemistry), rat monoclonal antibody against α-tubulin (Santa Cruz, cat no. sc-575; 1:1,000), rabbit antibody against Calbindin d-28 (Swant CB38; 1:1,000), mouse monoclonal antibody against IP3R1 (NeuroMab, clone L24-18; 1:200) (34), mouse monoclonal antibody against APC (EMD Millipore, cat no. OP80; 1:200) (35), and mouse monoclonal antibody against neuron-specific nuclear protein (NeuN; EMD Millipore, cat no. MAB377; 1:500). Mouse anti–β-tubulin III antibody was purchased from Millipore (Clone TU-20, 1:500 dilution). Peroxidase conjugated secondary antibodies (Cell Signaling) were used for Western blot, as suggested by the manufacturer. For immunohistochemistry, Alexa fluor-conjugated secondary antibodies (Life Technologies; 1:200) were used for fluorescent detection, and biotin-conjugated anti-rabbit secondary antibody (Sigma B-7264; 1:100), in combination with peroxidase conjugated ExtrAvidin (Sigma E-2886; 1:100), was used for colorimetric detection.
Quantitative Real-Time RT-PCR.
Brain total RNA was extracted using TRIzol reagent and used for cDNA synthesis with RetroScript cDNA synthesis kit (Life Technologies). Real-time PCR was conducted using iTaq Supermix on a CFX96 Real-Time PCR System (Bio-Rad). Three mice of each genotype were used, and four technical replicates were performed for each RNA sample. A Cers2 cDNA fragment was amplified with oligonucleotides LZO178 and LZO179. Gapdh, as an internal control, was amplified using primers LZO184 and LZO185. Primers LZO174 and LZO175 were used to amplify a Cers1 cDNA target fragment. Quantitation of gene expression was calculated using ∆∆Ct method, as described (36). Relative abundances of Cers2 and Cers1 transcripts were normalized to the amount of Gapdh.
Immunoblotting.
Protein was extracted from mouse brains with RIPA buffer (10 V of tissue weight) with protease inhibitor mixture III (EMD Millipore). Protein samples were incubated with loading dye containing 3.3 M urea and 10 mM DTT to fully denature CerS2 before Western analysis.
Histology and Immunohistochemistry.
Histology and immunohistochemistry were conducted as described (20). Mice were perfused intracardiacally with either 4% (wt/vol) paraformaldehyde (for CerS2, APC, and IP3R1 immunostaining) or 1:3 (vol/vol) acetic acid/methanol (for ubiquitin and NeuN staining). Fluorescent images were acquired using identical parameters with a Leica SP5 confocal microscope. For colorimetric detection of Calbindin D-28, mice were perfused with Bouin’s fixative.
Lipid Extraction and Analyses of Sphingolipids.
Lipid extraction and analyses of sphingolipids including free LCBs, except gangliosides, were conducted essentially as described (6, 20). Total LCBs were analyzed as previously described (37). Mouse brain microsome preparation and SPT assay were conducted as described (38). Extraction and analysis of gangliosides are described in SI Methods.
Neuron Culture and Treatment.
Primary cortical neurons were derived from E18 wild-type C57BL/6J mouse embryos as described (39). Dihydrosphingosine, sphingosine, and deoxysphinganine were purchased from Avanti Polar Lipids and used at specified concentrations.
Statistical Analysis.
Statistical analysis for the real-time RT-PCR, sphingolipid profiles (except gangliosides), and SPT activity were performed by ordinary one-way ANOVA (Graphpad Prism 5). Adjusted P values (Tukey correction, 95% confidence interval) of multiple comparisons between any two of the three groups were used. Statistical analysis for gangliosides was performed using Sigma Plot.
SI Methods
Ganglioside extraction and analysis using high-performance TLC (HPTLC) were performed as previously described (40). Neutral glycolipids and gangliosides were visualized by staining with orcinol spray reagent, followed by heating at 120 °C for 20 min. Relative band intensities were calculated from scanning densitometry and ImageJ analysis. Ganglioside standards (human brain ganglioside extract) were a kind gift from Dr. R. K. Yu (Georgia Regents University).
Acknowledgments
We would like to thank Dr. Patsy M. Nishina for her tremendous support. We thank The Jackson Laboratory Scientific Services, including Genetic Engineering Technologies, Sequencing, Histology and Imaging Sciences, and Multimedia Services, for its services and the Medical University of South Carolina Lipidomics Core for the mass spectrometry analyses. We also thank Drs. Patsy M. Nishina, Jürgen K. Naggert, and Robert W. Burgess for editorial comments and Ms. Alicia Valenzuela for advice on nomenclature. We thank Drs. Guanghu Wang and Michael Dinkins (E.B. laboratory) for cultivation of neurons. This work is supported by NIH Grant NS075447 (to L.Z.) and in part by pilot research funding from Hollings Cancer Center’s Cancer Center Support Grant P30 CA138313 and pilot research funding from COBRE for Lipidomics and Pathobiology NIH Grant 5P30GM103339-03 at the Medical University of South Carolina (to S.D.S.). The Jackson Laboratory Scientific Services is supported by NIH Grant CA034196. Partial funding by NIH Grant R01 AG034389 (to E.B.) and NIH Grant HD080181 (to T.M.D.) are acknowledged.
Footnotes
The authors declare no conflict of interest.
This article is a PNAS Direct Submission.
This article contains supporting information online at www.pnas.org/lookup/suppl/doi:10.1073/pnas.1522071113/-/DCSupplemental.
References
- 1.Bartke N, Hannun YA. Bioactive sphingolipids: Metabolism and function. J Lipid Res. 2009;50(Suppl):S91–S96. doi: 10.1194/jlr.R800080-JLR200. [DOI] [PMC free article] [PubMed] [Google Scholar]
- 2.Merrill AH., Jr Sphingolipid and glycosphingolipid metabolic pathways in the era of sphingolipidomics. Chem Rev. 2011;111(10):6387–6422. doi: 10.1021/cr2002917. [DOI] [PMC free article] [PubMed] [Google Scholar]
- 3.Hannun YA, Obeid LM. Principles of bioactive lipid signalling: Lessons from sphingolipids. Nat Rev Mol Cell Biol. 2008;9(2):139–150. doi: 10.1038/nrm2329. [DOI] [PubMed] [Google Scholar]
- 4.Gable K, et al. A disease-causing mutation in the active site of serine palmitoyltransferase causes catalytic promiscuity. J Biol Chem. 2010;285(30):22846–22852. doi: 10.1074/jbc.M110.122259. [DOI] [PMC free article] [PubMed] [Google Scholar]
- 5.Penno A, et al. Hereditary sensory neuropathy type 1 is caused by the accumulation of two neurotoxic sphingolipids. J Biol Chem. 2010;285(15):11178–11187. doi: 10.1074/jbc.M109.092973. [DOI] [PMC free article] [PubMed] [Google Scholar]
- 6.Kramer R, et al. Neurotoxic 1-deoxysphingolipids and paclitaxel-induced peripheral neuropathy. FASEB J. 2015;29(11):4461–4472. doi: 10.1096/fj.15-272567. [DOI] [PMC free article] [PubMed] [Google Scholar]
- 7.Kanno T, Nishizaki T. Sphingosine induces apoptosis in hippocampal neurons and astrocytes by activating caspase-3/-9 via a mitochondrial pathway linked to SDK/14-3-3 protein/Bax/cytochrome c. J Cell Physiol. 2011;226(9):2329–2337. doi: 10.1002/jcp.22571. [DOI] [PubMed] [Google Scholar]
- 8.Moore AN, Kampfl AW, Zhao X, Hayes RL, Dash PK. Sphingosine-1-phosphate induces apoptosis of cultured hippocampal neurons that requires protein phosphatases and activator protein-1 complexes. Neuroscience. 1999;94(2):405–415. doi: 10.1016/s0306-4522(99)00288-2. [DOI] [PubMed] [Google Scholar]
- 9.Marasas WF, et al. Fumonisins disrupt sphingolipid metabolism, folate transport, and neural tube development in embryo culture and in vivo: A potential risk factor for human neural tube defects among populations consuming fumonisin-contaminated maize. J Nutr. 2004;134(4):711–716. doi: 10.1093/jn/134.4.711. [DOI] [PubMed] [Google Scholar]
- 10.Koybasi S, et al. Defects in cell growth regulation by C18:0-ceramide and longevity assurance gene 1 in human head and neck squamous cell carcinomas. J Biol Chem. 2004;279(43):44311–44319. doi: 10.1074/jbc.M406920200. [DOI] [PubMed] [Google Scholar]
- 11.Senkal CE, Ponnusamy S, Bielawski J, Hannun YA, Ogretmen B. Antiapoptotic roles of ceramide-synthase-6-generated C16-ceramide via selective regulation of the ATF6/CHOP arm of ER-stress-response pathways. FASEB J. 2010;24(1):296–308. doi: 10.1096/fj.09-135087. [DOI] [PMC free article] [PubMed] [Google Scholar]
- 12.Senkal CE, et al. Role of human longevity assurance gene 1 and C18-ceramide in chemotherapy-induced cell death in human head and neck squamous cell carcinomas. Mol Cancer Ther. 2007;6(2):712–722. doi: 10.1158/1535-7163.MCT-06-0558. [DOI] [PubMed] [Google Scholar]
- 13.Ben-David O, Futerman AH. The role of the ceramide acyl chain length in neurodegeneration: Involvement of ceramide synthases. Neuromolecular Med. 2010;12(4):341–350. doi: 10.1007/s12017-010-8114-x. [DOI] [PubMed] [Google Scholar]
- 14.Stiban J, Tidhar R, Futerman AH. Ceramide synthases: Roles in cell physiology and signaling. Adv Exp Med Biol. 2010;688:60–71. doi: 10.1007/978-1-4419-6741-1_4. [DOI] [PubMed] [Google Scholar]
- 15.Levy M, Futerman AH. Mammalian ceramide synthases. IUBMB Life. 2010;62(5):347–356. doi: 10.1002/iub.319. [DOI] [PMC free article] [PubMed] [Google Scholar]
- 16.Laviad EL, et al. Characterization of ceramide synthase 2: Tissue distribution, substrate specificity, and inhibition by sphingosine 1-phosphate. J Biol Chem. 2008;283(9):5677–5684. doi: 10.1074/jbc.M707386200. [DOI] [PubMed] [Google Scholar]
- 17.Becker I, Wang-Eckhardt L, Yaghootfam A, Gieselmann V, Eckhardt M. Differential expression of (dihydro)ceramide synthases in mouse brain: Oligodendrocyte-specific expression of CerS2/Lass2. Histochem Cell Biol. 2008;129(2):233–241. doi: 10.1007/s00418-007-0344-0. [DOI] [PubMed] [Google Scholar]
- 18.Jazwinski SM, et al. Georgia Centenarian Study and the Louisiana Healthy Aging Study HRAS1 and LASS1 with APOE are associated with human longevity and healthy aging. Aging Cell. 2010;9(5):698–708. doi: 10.1111/j.1474-9726.2010.00600.x. [DOI] [PMC free article] [PubMed] [Google Scholar]
- 19.Vanni N, et al. Impairment of ceramide synthesis causes a novel progressive myoclonus epilepsy. Ann Neurol. 2014;76(2):206–212. doi: 10.1002/ana.24170. [DOI] [PubMed] [Google Scholar]
- 20.Zhao L, et al. A deficiency of ceramide biosynthesis causes cerebellar purkinje cell neurodegeneration and lipofuscin accumulation. PLoS Genet. 2011;7(5):e1002063. doi: 10.1371/journal.pgen.1002063. [DOI] [PMC free article] [PubMed] [Google Scholar]
- 21.Ginkel C, et al. Ablation of neuronal ceramide synthase 1 in mice decreases ganglioside levels and expression of myelin-associated glycoprotein in oligodendrocytes. J Biol Chem. 2012;287(50):41888–41902. doi: 10.1074/jbc.M112.413500. [DOI] [PMC free article] [PubMed] [Google Scholar]
- 22.Mucke L, et al. Synaptotrophic effects of human amyloid beta protein precursors in the cortex of transgenic mice. Brain Res. 1994;666(2):151–167. doi: 10.1016/0006-8993(94)90767-6. [DOI] [PubMed] [Google Scholar]
- 23.Mao C, Xu R, Bielawska A, Obeid LM. Cloning of an alkaline ceramidase from Saccharomyces cerevisiae. An enzyme with reverse (CoA-independent) ceramide synthase activity. J Biol Chem. 2000;275(10):6876–6884. doi: 10.1074/jbc.275.10.6876. [DOI] [PubMed] [Google Scholar]
- 24.Spassieva SD, Mullen TD, Townsend DM, Obeid LM. Disruption of ceramide synthesis by CerS2 down-regulation leads to autophagy and the unfolded protein response. Biochem J. 2009;424(2):273–283. doi: 10.1042/BJ20090699. [DOI] [PMC free article] [PubMed] [Google Scholar]
- 25.Baird RD, et al. Phase I safety, pharmacokinetic, and pharmacogenomic trial of ES-285, a novel marine cytotoxic agent, administered to adult patients with advanced solid tumors. Mol Cancer Ther. 2009;8(6):1430–1437. doi: 10.1158/1535-7163.MCT-08-1167. [DOI] [PubMed] [Google Scholar]
- 26.Massard C, et al. Phase I dose-escalating study of ES-285 given as a three-hour intravenous infusion every three weeks in patients with advanced malignant solid tumors. Invest New Drugs. 2012;30(6):2318–2326. doi: 10.1007/s10637-011-9772-8. [DOI] [PubMed] [Google Scholar]
- 27.Schöffski P, et al. Spisulosine (ES-285) given as a weekly three-hour intravenous infusion: Results of a phase I dose-escalating study in patients with advanced solid malignancies. Cancer Chemother Pharmacol. 2011;68(6):1397–1403. doi: 10.1007/s00280-011-1612-1. [DOI] [PubMed] [Google Scholar]
- 28.Scandroglio F, et al. Lipid content of brain, brain membrane lipid domains, and neurons from acid sphingomyelinase deficient mice. J Neurochem. 2008;107(2):329–338. doi: 10.1111/j.1471-4159.2008.05591.x. [DOI] [PMC free article] [PubMed] [Google Scholar]
- 29.Yamashita T, et al. Conditional LoxP-flanked glucosylceramide synthase allele controlling glycosphingolipid synthesis. Genesis. 2005;43(4):175–180. doi: 10.1002/gene.20167. [DOI] [PubMed] [Google Scholar]
- 30.Takamiya K, et al. Mice with disrupted GM2/GD2 synthase gene lack complex gangliosides but exhibit only subtle defects in their nervous system. Proc Natl Acad Sci USA. 1996;93(20):10662–10667. doi: 10.1073/pnas.93.20.10662. [DOI] [PMC free article] [PubMed] [Google Scholar]
- 31.Sheikh KA, et al. Mice lacking complex gangliosides develop Wallerian degeneration and myelination defects. Proc Natl Acad Sci USA. 1999;96(13):7532–7537. doi: 10.1073/pnas.96.13.7532. [DOI] [PMC free article] [PubMed] [Google Scholar]
- 32.Yamashita T, et al. Interruption of ganglioside synthesis produces central nervous system degeneration and altered axon-glial interactions. Proc Natl Acad Sci USA. 2005;102(8):2725–2730. doi: 10.1073/pnas.0407785102. [DOI] [PMC free article] [PubMed] [Google Scholar]
- 33.Wang K, et al. Alkaline ceramidase 3 deficiency results in Purkinje cell degeneration and cerebellar ataxia due to dyshomeostasis of sphingolipids in the brain. PLoS Genet. 2015;11(10):e1005591. doi: 10.1371/journal.pgen.1005591. [DOI] [PMC free article] [PubMed] [Google Scholar]
- 34.Miyata M, Miyata H, Mikoshiba K, Ohama E. Development of Purkinje cells in humans: An immunohistochemical study using a monoclonal antibody against the inositol 1,4,5-triphosphate type 1 receptor (IP3R1) Acta Neuropathol. 1999;98(3):226–232. doi: 10.1007/s004010051073. [DOI] [PubMed] [Google Scholar]
- 35.Bhat RV, et al. Expression of the APC tumor suppressor protein in oligodendroglia. Glia. 1996;17(2):169–174. doi: 10.1002/(SICI)1098-1136(199606)17:2<169::AID-GLIA8>3.0.CO;2-Y. [DOI] [PubMed] [Google Scholar]
- 36.Livak KJ, Schmittgen TD. Analysis of relative gene expression data using real-time quantitative PCR and the 2(-Delta Delta C(T)) method. Methods. 2001;25(4):402–408. doi: 10.1006/meth.2001.1262. [DOI] [PubMed] [Google Scholar]
- 37.Harmon JM, et al. Topological and functional characterization of the ssSPTs, small activating subunits of serine palmitoyltransferase. J Biol Chem. 2013;288(14):10144–10153. doi: 10.1074/jbc.M113.451526. [DOI] [PMC free article] [PubMed] [Google Scholar]
- 38.Zhao L, et al. Elevation of 20-carbon long chain bases due to a mutation in serine palmitoyltransferase small subunit b results in neurodegeneration. Proc Natl Acad Sci USA. 2015;112(42):12962–12967. doi: 10.1073/pnas.1516733112. [DOI] [PMC free article] [PubMed] [Google Scholar]
- 39.Seibenhener ML, Wooten MW. Isolation and culture of hippocampal neurons from prenatal mice. J Vis Exp. 2012;(65):e3634. doi: 10.3791/3634. [DOI] [PMC free article] [PubMed] [Google Scholar]
- 40.Bieberich E, MacKinnon S, Silva J, Yu RK. Regulation of apoptosis during neuronal differentiation by ceramide and b-series complex gangliosides. J Biol Chem. 2001;276(48):44396–44404. doi: 10.1074/jbc.M107239200. [DOI] [PubMed] [Google Scholar]


