Significance
Most physiological processes exhibit circadian oscillations, which are synchronized by a central pacemaker located in the hypothalamic suprachiasmatic nucleus (SCN). For this pacemaker to be biologically relevant, it must be entrained with external environmental cues such as the daily light/dark cycle. At present, details of how photic information is relayed from the retina to the SCN remain unclear. Using an array of genetic mouse lines, we found that the major peptidergic SCN neurons receive direct retinal input and that a single intrinsically photosensitive retinal ganglion cell (ipRGC) bilaterally targets the SCN and sends axonal collaterals to several non-SCN regions. Together, our results suggest that the retina provides multifaceted synaptic inputs to the brain to mediate proper photic inputs to coordinately influence non-image–forming visual functions.
Keywords: melanopsin, circadian, suprachiasmatic nucleus, non-image–forming functions, ipRGCs
Abstract
The suprachiasmatic nucleus (SCN) receives direct retinal input from the intrinsically photosensitive retinal ganglion cells (ipRGCs) for circadian photoentrainment. Interestingly, the SCN is the only brain region that receives equal inputs from the left and right eyes. Despite morphological assessments showing that axonal fibers originating from ipRGCs cover the entire SCN, physiological evidence suggests that only vasoactive intestinal polypeptide (VIP)/gastrin-releasing peptide (GRP) cells located ventrally in the SCN receive retinal input. It is still unclear, therefore, which subpopulation of SCN neurons receives synaptic input from the retina and how the SCN receives equal inputs from both eyes. Here, using single ipRGC axonal tracing and a confocal microscopic analysis in mice, we show that ipRGCs have elaborate innervation patterns throughout the entire SCN. Unlike conventional retinal ganglion cells (RGCs) that innervate visual targets either ipsilaterally or contralaterally, a single ipRGC can bilaterally innervate the SCN. ipRGCs form synaptic contacts with major peptidergic cells of the SCN, including VIP, GRP, and arginine vasopressin (AVP) neurons, with each ipRGC innervating specific subdomains of the SCN. Furthermore, a single SCN-projecting ipRGC can send collateral inputs to many other brain regions. However, the size and complexity of the axonal arborizations in non-SCN regions are less elaborate than those in the SCN. Our results provide a better understanding of how retinal neurons connect to the central circadian pacemaker to synchronize endogenous circadian clocks with the solar day.
The suprachiasmatic nucleus (SCN) houses a central pacemaker that orchestrates circadian (circa: “about” and diem: “day”) behaviors that cycle with a period close to 24 h. This endogenous clock is self-sustained even in the complete absence of external stimuli, but can be entrained to the light/dark cycle of the solar day in a process defined as circadian photoentrainment (1). In mammals, phototransduction solely occurs in the retina (2). Retinal ganglion cells (RGCs) are projection neurons of the retina that send light information to brain targets (3). Although the majority of RGCs project to brain areas involved in object tracking and image formation, some RGCs also innervate non-image–forming brain regions to influence circadian activity, sleep, the pupillary light response, mood, and learning functions (4).
Recent studies showed that a small subpopulation of RGCs expresses a photopigment called melanopsin (Opn4), making these cells intrinsically photosensitive (ip)RGCs (5–7). It is now known that there are at least five different ipRGC subtypes (M1–M5) (8, 9). Using genetic tracing techniques, it was shown that ipRGCs send projections to non-image–forming centers in the brain, including the SCN, which receives retinal input predominantly from M1 ipRGCs (10–12) and to a lesser extent from M2 ipRGCs (12). The SCN is a small nucleus located in the anterior hypothalamus and contains diverse subpopulations of neurons (13). Studies in rodents indicate that the core region located in the ventral portion of the SCN is composed of neurons that express vasoactive intestinal polypeptide (VIP) or gastrin-releasing peptide (GRP) (14, 15). This core region is surrounded by a shell region that contains neurons expressing arginine vasopressin (AVP) and calretinin (16). To deconstruct the SCN circuitry, the rhythmic expression of clock genes and the photic induction of immediate early genes have been evaluated in different subpopulations of SCN neurons. Those studies gave rise to a functional description of the SCN, in which neurons in the shell region are classified as circadian oscillators, whereas neurons in the ventral region are light-responsive (17). In rats, it was shown that specific cell types in the core region, such as VIP- and GRP-expressing cells, receive direct retinal input (18–20), which led to the idea that the core region of the SCN is the only retinorecipient area. However, those results were inconsistent between different rodent species, as no retinal-VIP–positive (VIP+) cell contacts were observed in hamsters (21). Furthermore, this simple demarcation of the SCN was challenged by studies showing that the entire mouse SCN receives dense innervation from ipRGCs (11). Because of the dense retinal innervation pattern, it has been difficult to decipher the identity of SCN neurons innervated by ipRGCs (22–24). Therefore, little is known about which cell types in the SCN receive retinal input. In addition, the SCN is the only region in the mouse brain that receives nearly equal inputs from the ipsilateral and contralateral eyes. This is quite surprising because all other retinorecipient brain regions are innervated ∼95% contralaterally (23). The importance of and the mechanism of how the SCN receives equal input from both eyes are essentially unexplored.
Here, we used single ipRGC tracing and confocal microscopic methods to show that ipRGCs have elaborate patterns of SCN innervation and found that several kinds of peptidergic neurons, located in topographically distinct areas of the SCN, receive direct retinal input. In addition, we uncovered the mechanism of how the SCN receives equal inputs from both eyes and showed that a single ipRGC sends axonal collateral projections to multiple brain regions. Together, our studies provide strong anatomical evidence for how ipRGCs project to the brain to influence light-mediated behaviors.
Results
A Single M1 ipRGC Projects to Multiple Brain Nuclei.
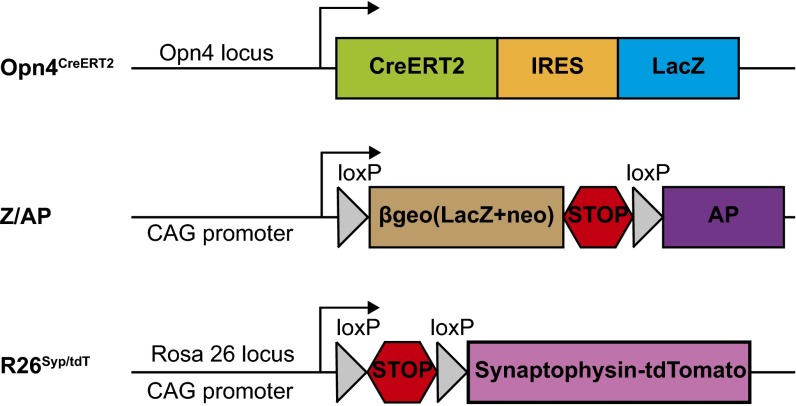
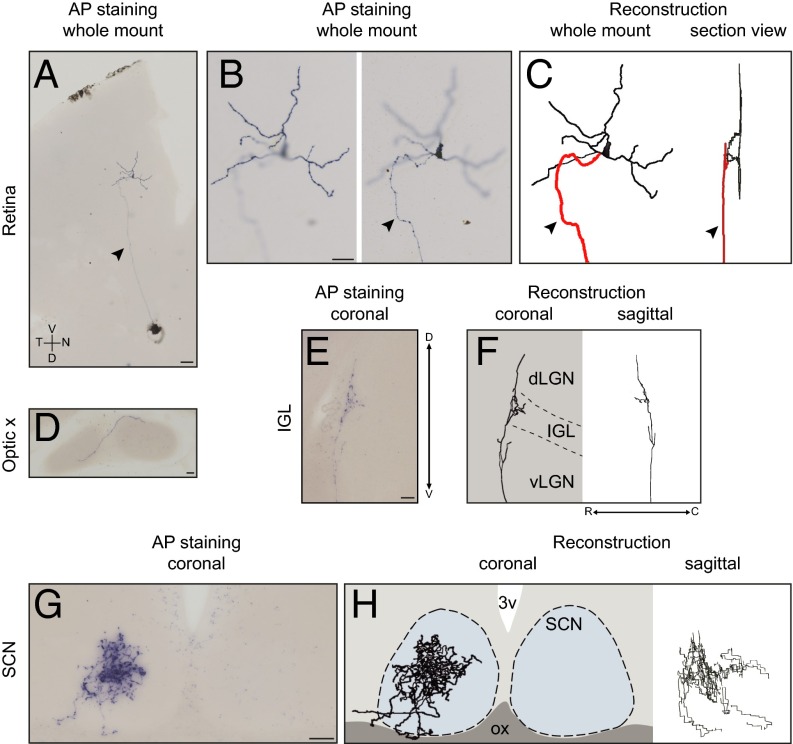
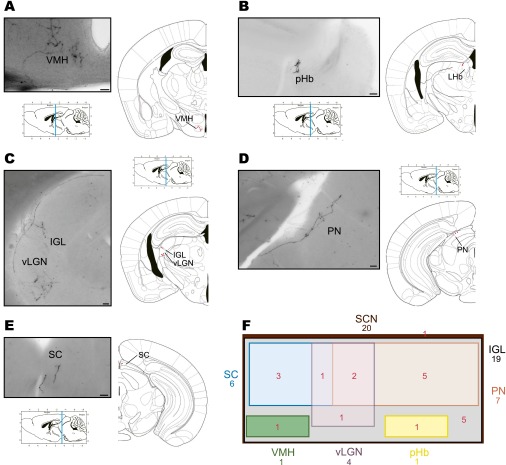
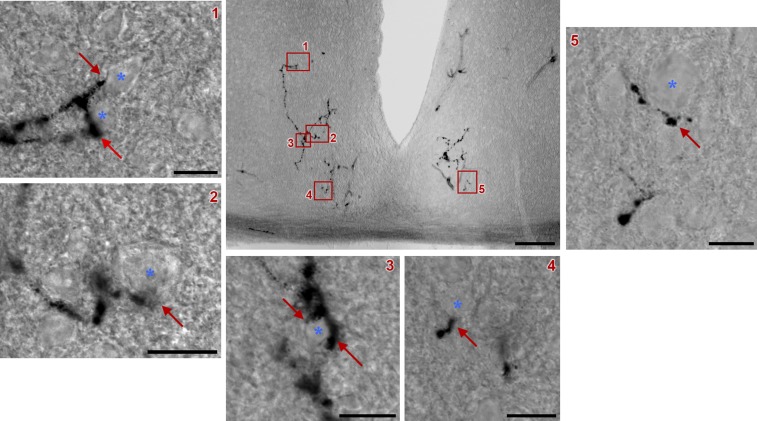
To reveal the axonal terminal fields of a single ipRGC, we crossed an Opn4CreERT2 mouse line with a Z/AP reporter line to generate Opn4CreERT2/+;Z/AP mice (Fig. S1). In these mice, depending on the injected concentration of tamoxifen, we were able to label a single ipRGC or up to several hundred ipRGCs with alkaline phosphatase. Specifically, with a low dose of tamoxifen, we were able to label a single ipRGC (Fig. 1A), revealing its dendritic structure in the retina and its axonal architecture in the brain. We further obtained a 3D reconstruction for each single ipRGC (Fig. 1 C, F, and H). In total, we evaluated 20 ipRGCs, all of which were of the M1 subtype as confirmed by their dendrites that stratified in the OFF sublamina of the inner plexiform layer of the retina (Fig. 1 B and C). Axonal labeling was evident in the optic chiasm (Fig. 1D) and was traced to the brain. All labeled ipRGCs innervated the SCN, and as expected, fibers targeted the ventral SCN through the optic chiasm (Fig. 1G). A single ipRGC can also send collateral axonal projections to multiple brain nuclei, which include the intergeniculate leaflet (IGL) (Fig. 1E), the ventral medial hypothalamus (VMH) (Fig. S2A), the peri-habenular region (pHb) (Fig. S2B), the ventral division of the lateral geniculate nucleus (vLGN) (Fig. S2C), the pretectal nucleus (PN) (Fig. S2D), and/or the superior colliculus (SC) (Fig. S2E). Although an individual ipRGC has a distinct innervation pattern to various brain targets in addition to the SCN (up to five nuclei), almost all ipRGCs (19/20) sent collateral projections to the IGL. In contrast, only 1 of 20 labeled ipRGCs had axon collaterals terminating in the pHb or VMH (Fig. S2F and Table S1). Furthermore, we found that the axonal terminal fields from ipRGCs to non-SCN targets were simple yet variable. In the IGL, ipRGC fibers either spread throughout the thin sheet of the leaflet (Fig. S3) or made branches that innervated only a small region of the leaflet (Fig. 1E). In the SC, the innervation pattern was even simpler than that of the IGL, and ipRGCs formed one or two thin straight lines that extended to deep layers of the SC (Fig. S2E), as was previously shown (11). In contrast, branching patterns of ipRGC fibers to the SCN were much more elaborate (Fig. 1 G and H). Specifically, retinal fibers within the SCN were tortuous and covered a large volume of the nucleus with prominent terminal swellings (Fig. S4). In fact, the estimated volume of the axonal terminal (axon volume 3.4 × 10⁶ ± 0.60 × 106 μm3) coverage from an individual ipRGC was a remarkable ∼14.4% of the total SCN volume (SCN volume 23.6 × 10⁶ ± 0.75 × 106 μm3) (Materials and Methods).
Fig. S1.
Schematic representation of the mouse genetic lines. Opn4CreERT2, which was previously validated, has Cre recombination upon tamoxifen injection. Z/AP is a Cre-dependent reporter line. This inducible Cre-LoxP system functions in a dose-dependent manner; therefore, we could control the number of ipRGCs that express AP in Opn4CreERT2/+; Z/AP mice. R26Syp/tdT is another Cre-dependent reporter line (Jackson Laboratory, stock no. 012570). With a high dose of tamoxifen, most ipRGCs express Synaptophysin–tdTomato in axonal terminals in Opn4CreERT2/+; R26Syp/tdT mice.
Fig. 1.
Dendritic and axonal reconstruction of a single M1 ipRGC. Representative images of alkaline phosphatase staining and 3D reconstruction from a single ipRGC are shown. A single M1 ipRGC was labeled in the left retina (A–C); its axon crossed the midline in the optic chiasm (D), extensively innervated the contralateral side of the SCN (G and H), and collaterally projected to the IGL (E and F). C, caudal; D, dorsal; dLGN, dorsal part of the lateral geniculate nucleus; N, nasal; ox, optic chiasm; 3v, third ventricle; V, ventral; vLGN, ventral part of the lateral geniculate nucleus; R, rostral; T, temporal. The arrowheads and red trace indicate the axon. Dashed lines are estimations of the boundary of the SCN and IGL. [Scale bars: 100 μm (A); 50 μm (B–G).]
Fig. S2.
A single M1 ipRGC innervates multiple brain targets. Representative images of brain targets from a single ipRGC in the mouse are shown in A–E. Single ipRGCs innervate the SCN and send collateral projections to the ventral medial hypothalamus (VMH) (A), peri-Habenular region (pHb) (B), intergeniculate leaflet (IGL) and ventral part of the lateral geniculate nucleus (vLGN) (C), pretectal nucleus (PN) (D), and superior colliculus (SC) (E). (F) Venn diagram showing the overlap between brain nuclei innervated from 20 individual ipRGCs. The surface is proportional to the percentage of ipRGC innervation to brain targets. (Scale bars: 50 μm.)
Table S1.
Summary of brain targets of individual ipRGCs
| Innervation patterns | SCN, % | IGL, % | vLGN, % | PN, % | SC, % | VMH, % | pHb, % | Total no. |
| Total | 100 | 95 | 20 | 50 | 30 | 5 | 5 | 20 |
| With SCN innervation | NA | 95 | 20 | 50 | 30 | 5 | 5 | 20 |
| With IGL innervation | 100 | NA | 21 | 53 | 32 | 5 | 5 | 19 |
| With vLGN innervation | 100 | 100 | NA | 75 | 75 | 0 | 0 | 4 |
| With PN innervation | 100 | 100 | 30 | NA | 30 | 10 | 0 | 10 |
| With SC innervation | 100 | 100 | 50 | 50 | NA | 0 | 0 | 6 |
Shown is the quantification of innervation pattern from M1 ipRGCs to different brain regions in this study. IGL: intergeniculate leaflet; pHb: peri-Habenular region; PN: pretectal nucleus; SC: superior colliculus; SCN: suprachiasmatic nucleus, vLGN: ventral part of the lateral geniculate nucleus, VMH: ventral medial hypothalamus. NA, not applicable.
Fig. S3.
Axonal architectures of a single ipRGC in the IGL. A single ipRGC densely innervated the thin sheet IGL. (A–C) Series of coronal sections of IGL were shown from the rostral (A) to the caudal (C). Dashed lines are estimations of the boundary of the IGL. (Scale bar: 50 μm.)
Fig. S4.
ipRGC axonal terminals within the SCN. A representative coronal section of the SCN after AP staining is shown (Scale bar: 100 μm.) Retinal fibers from a single ipRGC (arrows) are in close contact with neurons (asterisks) located in different SCN regions (Scale bars: 10 μm.) In most cases, clear terminal swellings were observed. Red boxes 1–5 from the central image are magnified for better viewing.
A Single ipRGC Can Bilaterally Innervate the SCN.
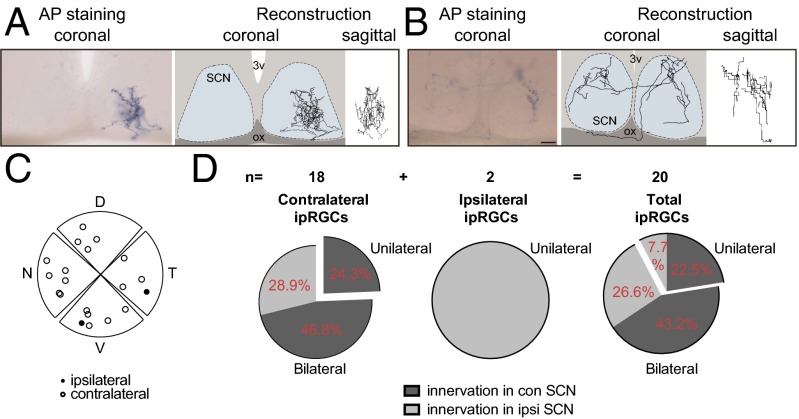
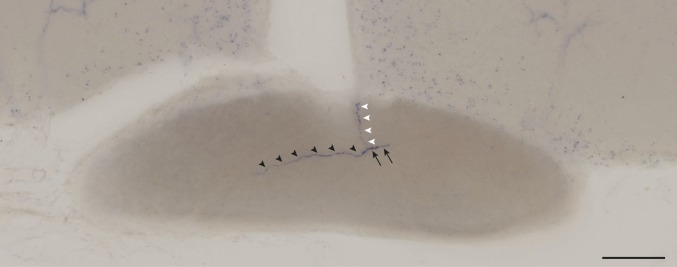
The complexity of the retinal terminal fields in the SCN was not the only defining factor that was specific to this brain region. Retinal innervation to the IGL, vLGN, PN, and/or SC was either ipsilateral or contralateral with a 1:9 ratio. Innervation to the ipsilateral and contralateral parts of the SCN from ipRGCs, however, was nearly equal with a 4:6 ratio. We discovered that ipRGCs innervate the SCN in two distinct ways. First, similar to other brain regions, ipsilaterally projecting ipRGCs (2/20) only innervated the SCN unilaterally (Fig. 2 A and D). Ipsilaterally projecting ipRGCs were located in the ventral-temporal part of the retina (Fig. 2C), similar to conventional RGCs that project ipsilaterally (25). This suggests that ipRGCs may also follow classical rules of ipsilateral targeting. Second, we found that 66.7% of contralaterally projecting ipRGCs (12 of 18) used atypical pathways by which axonal projections course through the midline to innervate the ipsilateral portion of the SCN (Fig. 2B) or through branching axons at the optic chiasm (Fig. S5). Therefore, the total axonal volume from ipRGCs to the ipsilateral and contralateral parts of the SCN is close to 4:6 (Fig. 2D). Together, these classical and atypical ipsilateral projection patterns to the SCN explain why the SCN is equally innervated, as published in previous reports (11, 16, 26).
Fig. 2.
Bilateral innervation of a single ipRGC contributes to the symmetrical input to the SCN. (A and B) Representative images showing a single unilateral ipRGC innervating the ipsilateral side of the SCN (A) and a bilateral ipRGC innervating both contralateral and ipsilateral sides of the SCN (B). (C) Spatial distribution of cell bodies in the retina for ipsilaterally (closed circles) and contralaterally (open circles) projecting ipRGCs. (D) Pie charts of innervation percentages in the contralateral and ipsilateral SCN from ipRGCs. n = 20. (Scale bar: 50 μm.)
Fig. S5.
The axon branches at the optic chiasm. An ipRGC axon (black arrow) crossed the midline and formed an axon branch at the optic chiasm. One axon innervated the contralateral side (black arrowheads) and the other axon innervated the ipsilateral side (white arrowheads). (Scale bar: 100 μm.)
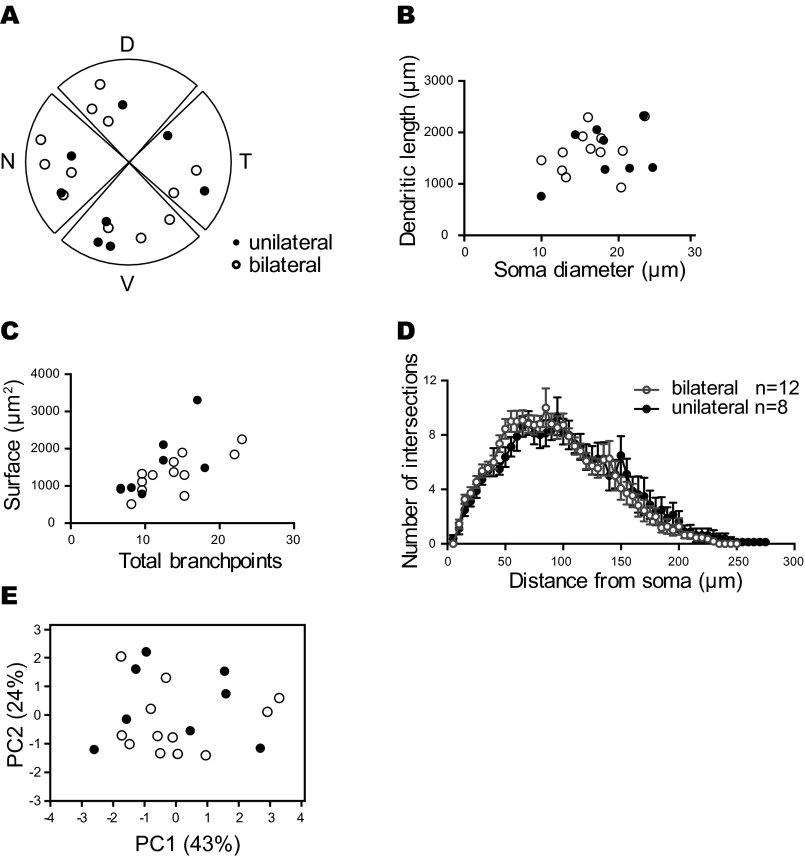
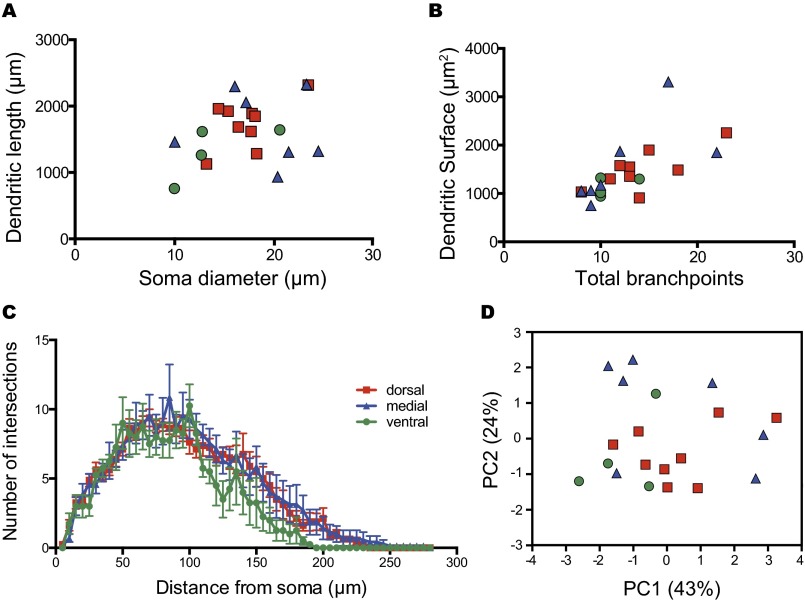
To evaluate whether the atypically projecting ipRGCs constitute a unique retinal neuronal subtype with a distinct dendritic morphology, we analyzed and compared somato-dendritic morphological characteristics of ipRGCs based on their bilateral or unilateral features. We found no significant differences in any somato-dendritic morphological property between bilaterally and unilaterally projecting ipRGCs (Fig. S6).
Fig. S6.
Unilateral and bilateral projecting ipRGCs have similar somato-dendritic features. (A) Composed spatial distribution of the cell bodies from unilateral (closed circle) and bilateral (open circle) projecting ipRGCs. Although unilateral and bilateral ipRGCs showed distinct axonal architectures in the SCN, they were similarly distributed in the retina. (B–E) Dendritic morphology of unilateral (closed circle) and bilateral (open circle) projecting ipRGCs showed similar properties in x–y scatter plot with soma diameter versus dendritic length (B), total branch points versus dendritic surface (C), and dendritic Sholl analysis (D). In addition, unilateral and contralateral projecting cells are clustered together in the PCA plotted with components 1 (PC1, 43% of explained variance) and 2 (PC2, 24% of explained variance) using all somato-dendritic features from 20 cells (E).
Individual ipRGCs Project to Specific SCN Regions.
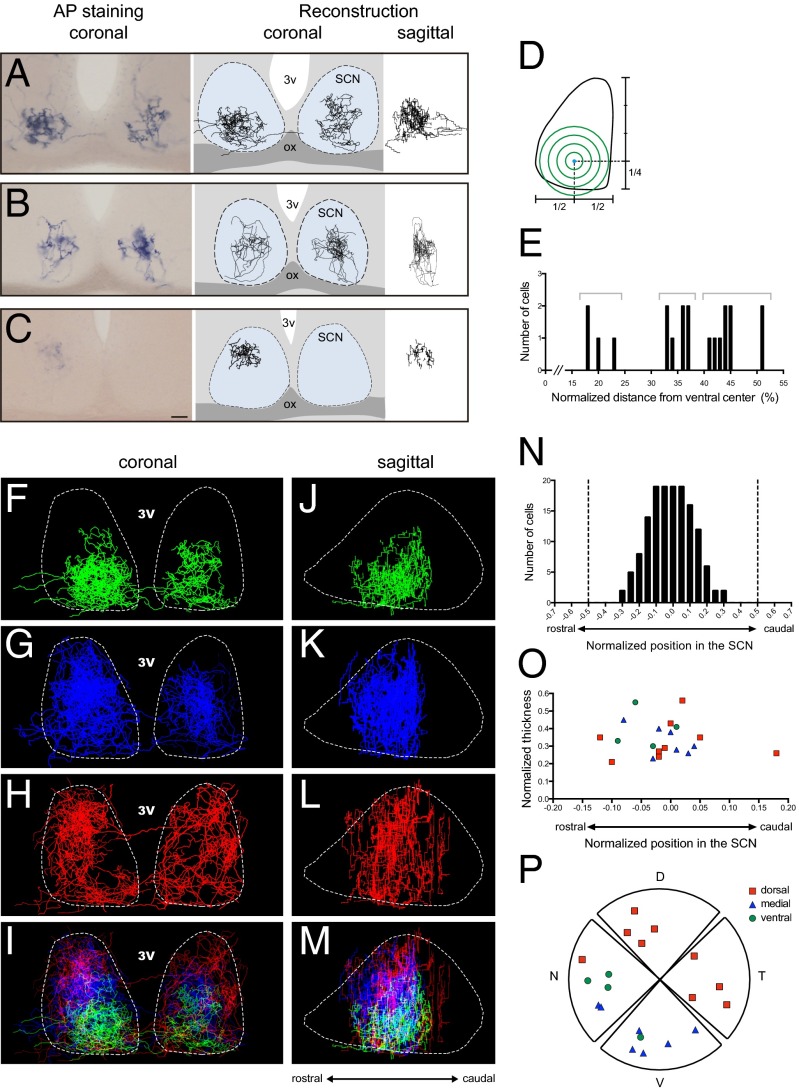
We then investigated topographical patterns of ipRGC projections to the SCN. ipRGC axonal fields innervated all regions of the SCN, including the ventral (Fig. 3A and Movie S1), medial (Fig. 3B and Movie S2), and dorsal (Fig. 3C and Movie S3) regions. We used an axonal Sholl analysis to define the architecture of axonal terminals of ipRGCs by arbitrarily assigning the zero point as the center of the ventral region of the SCN (Fig. 3D). Therefore, ipRGCs that innervate the ventral SCN region will have a peak number of intersections from the axonal Sholl analysis closer to 0, whereas ipRGCs that innervate primarily the dorsal region of the SCN will be further away from 0. A small group of ipRGCs (4 of 20) showed an intersection peak lower than 23% of the normalized distance from the center, indicating that these cells preferentially targeted the ventral SCN. Another group of ipRGCs (7 of 20) had an intersection peak of 33–37% of the normalized distance, which we defined as the medial SCN. The last group of ipRGCs (9 of 20) showed intersection peaks of >41% of the normalized distance from the center, which we defined as the dorsal SCN (Fig. 3E). Remarkably, when we overlaid ipRGC axons together, each group of ipRGC axons seemed to cluster at a particular SCN region (Fig. 3 F–I) with a minimum overlap between the dorsal (Fig. 3 H and I) and ventral innervating groups (Fig. 3 F and I). In addition, the sagittal view showed that axonal fields of ventral and medial innervating ipRGCs were less spread out compared with dorsal innervating ipRGCs (Fig. 3 J–M). We also observed a lack of ipRGC axons in the most rostral and caudal parts of the SCN (Fig. 3N), similar to previous reports (22). As in uni- and bilaterally projecting ipRGCs, the somato-dendritic properties from ipRGCs targeting different areas of the SCN were similar, including total branch points, the dendritic surface, total dendritic length, and soma sizes (Fig. S7). Furthermore, the rostral-to-caudal thickness of the axonal field from individual ipRGCs seemed to show no obvious changes (Fig. 3O). Intriguingly, the cell-body location in the retina of dorsal-SCN–innervating ipRGCs seemed to cluster at the dorsal-temporal region of the retina, whereas ventral and medial-SCN–innervating ipRGCs seemed to cluster at the ventral-nasal region of the retina (Fig. 3P and Fig. S8). This indicates the possibility of a crude retinotopic map in the SCN. Therefore, our results provide evidence that the retinorecipient region of the SCN is more widespread than originally thought and does not simply conform to core and shell demarcations.
Fig. 3.
A single ipRGC preferentially innervates a specific region of the SCN. (A–C) Representative images of single ipRGCs that innervate the ventral (A), medial (B), or the dorsal (C) SCN region. (Scale bar: 50 μm.) (D) Scheme of the axonal Sholl analysis with the center in the ventral region of the SCN. (E) The intersection peak distribution of the axonal Sholl analysis from the ventral region of the SCN. (F–M) Superimposed images of axon fibers of ventrally targeting (F and J), medially targeting (G and K), dorsally targeting (H and L), and total (I and M) ipRGC projections (F–H and J–L merged by maximum intensity, I and M merged by summation). (N) Accumulation plot of ipRGC axon fields in the SCN in sagittal view. Dashed lines indicate the rostral and caudal boundaries of the SCN. (O) Relative sagittal position of each ipRGC axonal field center and their thicknesses in the SCN (in N and O, position was normalized to the total SCN thickness). (P) Spatial distribution of cell bodies from ventral (green), medial (blue), and dorsal (red) SCN-targeting ipRGCs. ox, optic chiasm; 3v, third ventricle.
Fig. S7.
Ventral, medial, and dorsal SCN-targeting ipRGCs have similar somato-dendritic features. Dendritic morphology of ventral (green circle, n = 4), medial (blue triangle, n = 7), and dorsal (red rectangle, n = 9) SCN-targeting ipRGCs showed similar properties in x–y scatter plot with soma diameter versus dendritic length (A), total branch points versus dendritic surface (B), and dendritic Sholl analysis (C). In addition, ventral, medial, and dorsal SCN-targeting ipRGCs are clustered together in the PCA plotted with components 1 (PC1, 43% of explained variance) and 2 (PC2, 24% of explained variance) using all somato-dendritic features from 20 cells (D).
Fig. S8.
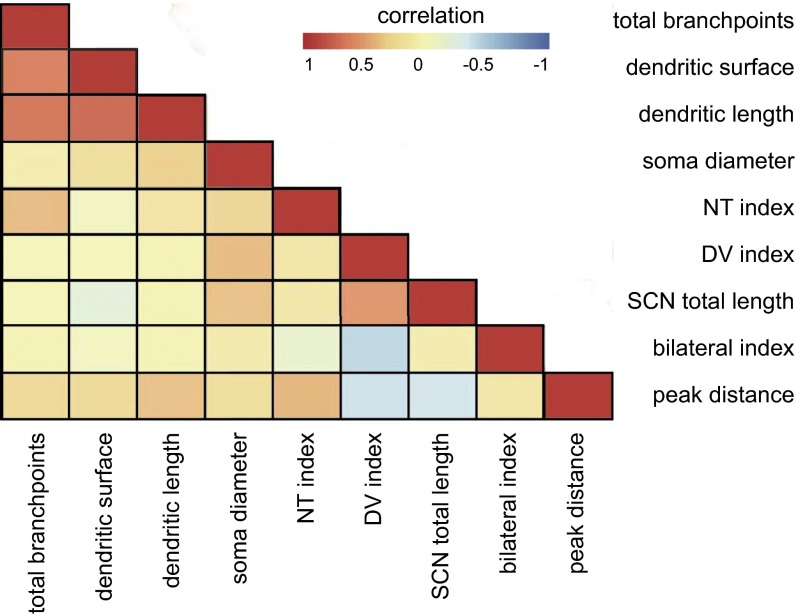
Dendritic-axonal correlation of ipRGCs. Heat map shows the correlation between all of the dendritic and axonal properties of ipRGCs. Red indicates strong positive correlation and blue indicates strong negative correlation. DV index: dorsal-ventral index; NT index: nasal-temporal index; peak distance: the distance of the peak intersection of axonal Scholl analysis in the SCN; SCN total length: total axonal length in the SCN; total branchpoints: total dendritic branchpoints.
Retinal Projections to the SCN: Identification of Postsynaptic Cell Types.
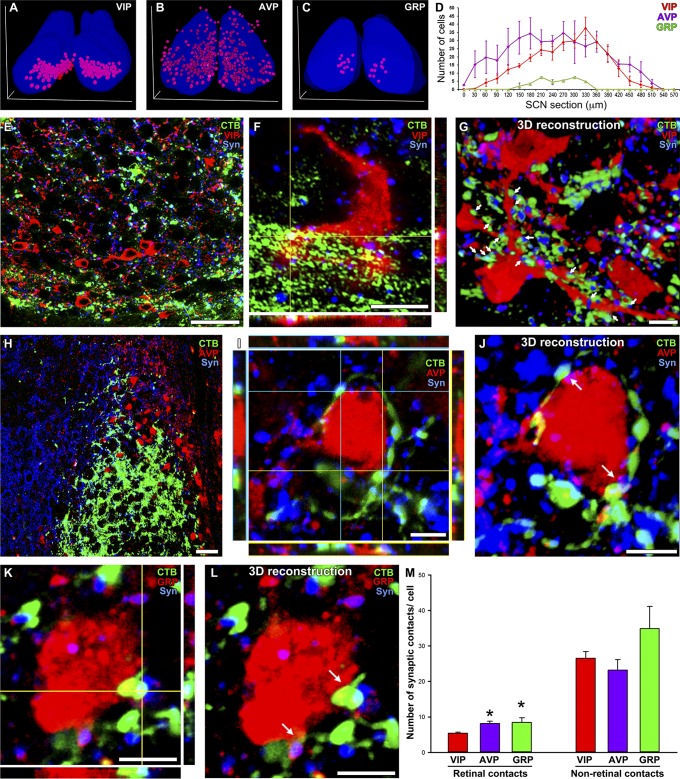
The widespread projection pattern of ipRGCs in the SCN prompted us to ask whether VIP and GRP cells, comprising the core of the SCN, are the only retinorecipient neurons of the SCN. To reveal the retina to SCN synaptic contacts, eyes from wild-type mice were intravitreally injected with the cholera toxin β-subunit (CTβ), and coronal SCN sections were colabeled with VIP, GRP, or AVP antibodies (Fig. 4 A–D). VIP-immunopositive (VIP+) cells were densely distributed in the ventral part of the SCN from the rostral to the caudal axis (Fig. 4 A and E and Fig. S9), as previously shown (15). A confocal z-stack analysis using triple labeling for VIP, a presynaptic marker (synaptophysin), and retinal axonal CTβ fluorescence revealed potential synaptic contacts between retinal axons and VIP+ neurons (Fig. 4E). Only a few retinal synaptic contacts were observed in the soma of VIP+ cells (Fig. 4F). Retinal contacts provided only a small portion of the synaptic input to VIP+ cells, as nonretinal synaptic contacts (VIP-synaptophysin colocalization) were much more abundant (Fig. 4M). Interestingly, a high number of retinal synaptic contacts was observed on processes of VIP+ cells (Fig. 4G). A similar analysis was performed using anti-GRP antibodies. GRP-immunopositive (GRP+) cells in the medial area of the SCN were sparse (Fig. 4 C and D), and the majority of GRP+ cells received retinal synaptic contacts (Fig. 4 K and L). As in the case of VIP+ cells, nonretinal synaptic contacts of GRP were higher than retinal inputs (Fig. 4M). Interestingly, VIP+ cells, which were classically considered to be the principal retinal target, received a significantly lower number of retinal contacts at the soma level compared with GRP+ cells (Fig. 4M). Unfortunately, we were unable to trace the processes of GRP+ neurons to compare them to the retinal synaptic input to VIP+ neurons.
Fig. 4.
Retinal postsynaptic targets in the SCN. (A–D) Quantification and topographic distributions of vasoactive intestinal polypeptide (VIP+), arginine vasopressin (AVP+), and gastrin-releasing peptide (GRP+) cells in the SCN. (E and F) A representative confocal image showing VIP+ cells innervated by retinal axons. A colocalization analysis for VIP (cell-type marker), synaptophysin (presynaptic marker), and CTβ (retinal axonal marker) was applied to determine a synaptic contact (triple-colocalization point). Only a few retinal synaptic contacts were observed in the somas of VIP+ cells. (G) The 3D reconstruction of a VIP+ cell showing that most of the retinal contacts were on the processes of the cell (arrows). (H and I) A representative confocal image showing that AVP+ cells are located in the shell of the SCN and have received direct retinal innervation. (J) The 3D reconstruction of a AVP+ cell showing that many retinal contacts were on the cell body (arrows). (K and L) Similarly, most GRP+ cells, which are located in the medial core area, received retinal inputs (arrows). (M) Quantification analysis of the total retinal and nonretinal synaptic contacts per cell type. *P < 0.05 vs. VIP+ cells by Tukey’s test. Data are the mean ± SE (n = 25–30 cells). [Scale bars: 5 μm (F, G, and I–L); 25 μm (E and H).]
Fig. S9.
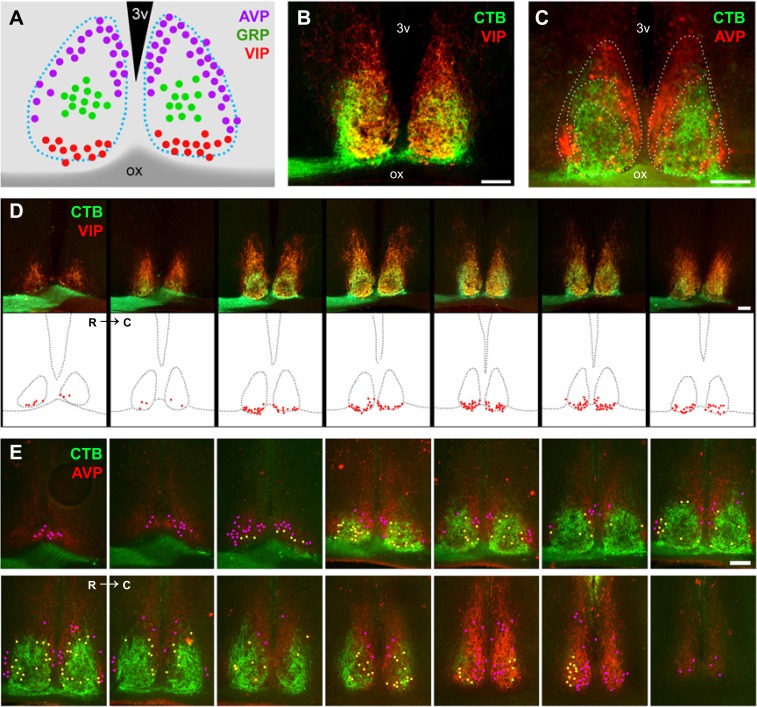
Topography of peptidergic neurons in the SCN. (A) VIP, GRP, and AVP cells show a particular topography in the SCN. VIP cells (B and D) are located in the most ventral SCN. Most VIP cells are in close contact with retinal fiber coming from the optic chiasm. AVP cells (C and E) were found in the shell area. Based on retinal projections and the potential innervation, AVP cells were divided into two distinct populations: AVP cells located in the outer nonretinorecipient shell (cells in magenta) and AVP cells located in the internal shell region that receives retinal innervation (cells in yellow). C, caudal; ox, optic chiasm; R, rostral; 3v, third ventricle. (Scale bars: 100 μm.)
Previously, it was assumed that AVP neurons do not receive synaptic input from the retina (22). Using serial sectioning and SCN reconstruction, we found, as previously reported (22), AVP-immunopositive (AVP+) cells to be located in two distinct shell regions: an outer shell region that is nonretinorecipient and an internal shell region that receives retinal input (Fig. 4H and Fig. S9). In the internal shell region, the majority of AVP+ cells receive direct synaptic input from retinal axons (Fig. 4 I and J), as suggested by our single ipRGC projection to the dorsal region of the SCN (Figs. 2B and 3C). As in the case of VIP+ cells, nonretinal synaptic contacts of AVP+ cells were higher than retinal inputs (Fig. 4M). Importantly, as in the case of GRP+ cells, AVP+ cells received higher synaptic contacts on the soma than did VIP+ cells. Together, our data showed that all three SCN cell types received input from the retina and that VIP+ cells may receive the most input to their processes instead of their somas.
Genetic Labeling of ipRGC Synaptic Contacts in the SCN.
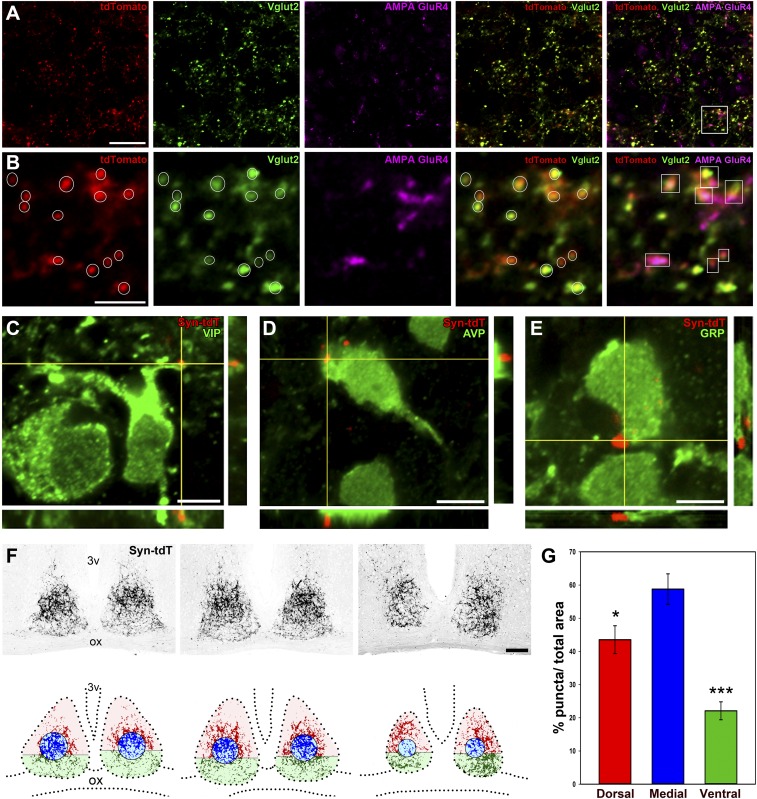
CTβ injections provided unexpected retinal synaptic contacts with a population of AVP+ neurons. To confirm these results using a genetic method, we generated an Opn4CreERT2/+;ROSASynaptophysin–tdTomato mouse line that expresses a synaptophysin–tdTomato fusion protein exclusively in ipRGC axonal terminals (Fig. S1). The use of this line with the melanopsin conditional Cre line allowed us to label only presynaptic terminals originating from ipRGCs. For the success of these experiments, it is essential to label the majority of ipRGCs, and hence we injected a high dose of tamoxifen that led to the labeling of hundreds of ipRGCs in the retina. This synaptophysin–tdTomato protein was shown to localize to presynaptic terminals (27) and was confirmed here by colocalizing tdTomato with Vglut2 staining (Fig. S10 A and B). We observed a dense pattern of presynaptic retinal terminals across the entire SCN (Fig. S10F), similar to our previous analysis using single ipRGC tracings and CTβ injections. The presynaptic localization of tdTomato expression was evaluated by taking SCN sections from Opn4CreERT2/+;ROSASynaptophysin–tdTomato mice and coimmunostaining them with the glutamatergic marker Vglut2 (Fig. S10 A and B). We found that the great majority of tdTomato puncta (Fig. S10B, white circles) colocalized with Vglut2 puncta [Mander’s coefficient (M1) = 0.785 ± 0.055; mean ± SEM; n = 4 mice]. ipRGC-SCN glutamatergic synapses were identified as presynaptic colocalization of tdTomato and Vglut2-positive puncta that were in close apposition with postsynaptic AMPA GluR4 staining (Fig. S10 A and B, white boxes). GluR4 is expressed in the SCN; however, not all SCN neurons express GluR4 (28). Therefore, some of the tdTomato and Vglut2 double-positive puncta did not show apposition with GluR4. Regardless, we observed a clear apposition of tdTomato and Vglut2 double-positive puncta with GluR4 staining, indicating that synaptophysin–tdTomato expressed in ipRGCs made synaptic contact with SCN neurons. To determine which SCN neurons receive input from ipRGCs using the synaptophysin–tdTomato method, we evaluated tdTomato focal expression with VIP, GRP, or AVP immunostaining. We found synaptic contacts with all three subtypes of SCN neurons (Fig. S10 C–E). Quantification of the number of synaptic contacts per cell (VIP+ cells = 5.50 ± 1.93; GRP+ cells = 8.20 ± 2.95; AVP+ cells = 7.43 ± 1.69; mean ± SEM; n = 5 cells per group) revealed a similar innervation pattern compared with CTβ injections, confirming that ipRGCs innervate all different cell types in the SCN. In addition, we found that the medial SCN area received dense innervation that was significantly higher than those of the ventral and dorsal innervation (Fig. S10 F and G), as observed with single ipRGC tracings.
Fig. S10.
ipRGC presynaptic map into the SCN. The pattern of retinal synaptic input was evaluated using Opn4CreERT2/+;ROSASynaptophysin–tdTomato mice, in which the synaptophysin–tdTomato fusion protein is expressed under the control of the melanopsin promoter after a tamoxifen injection. Coronal SCN sections were immunostained with Vglut2 and AMPA GluR4 antibodies (A). Higher-magnification details are shown in B. We found that most tdTomato puncta colocalized with Vglut2 puncta (white circles) in close apposition with AMPA GluR4 puncta (white boxes). Representative confocal images from a vasoactive intestinal polypeptide (VIP+) cell (C), an arginine vasopressin (AVP+) cell (D), and a gastrin-releasing peptide (GRP+) cell (E) receiving direct ipRGC inputs are shown. A dense synaptic map of retinal-SCN connectivity was observed (F); tdTomato expression was found throughout the entire SCN. Three representative images from the rostral, medial, and caudal portions of the SCN are shown (F, Upper). A binary mask of tdTomato expression is presented (F, Lower). The SCN was divided into medial (blue), ventral (green), and dorsal (red) areas, and the percentage of the total area covered by tdTomato was quantified (G). A higher density of tdTomato puncta was observed in the medial SCN region, compared with the ventral and dorsal SCN areas. *P < 0.05 and ***P < 0.001 vs. the medial SCN by Tukey’s test. Data are the mean ± SE (n = 5). C, caudal; ox, optic chiasm; R, rostral; 3v, third ventricle. [Scale bars: 5 μm (B–E); 20 μm (A); 100 μm (F).]
Synaptic Input from ipRGCs to the SCN Targets a Restricted Cell Domain.
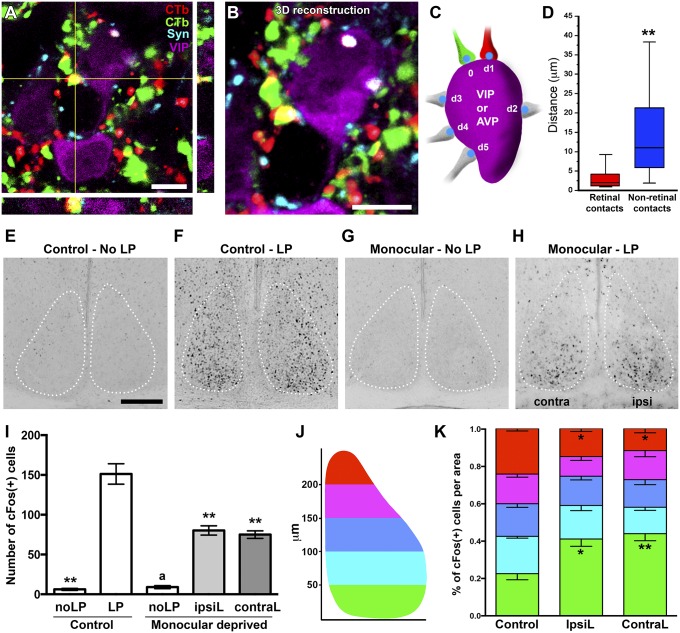
Because ipRGCs bilaterally innervate the SCN, we evaluated whether single SCN neurons received input from both eyes and whether the input was localized to specific domains of SCN neurons. We injected CTβ tagged with different fluorophores (488 and 594 nm) into each eye, and SCN sections were immunostained with anti-synaptophysin, anti-VIP, or anti-AVP antibodies. We found that for both VIP+ and AVP+ cells, most SCN neurons received innervation from both eyes (Fig. 5A). Using a 3D reconstruction of neurons, we measured the distribution of synaptic contacts per cell and the spatial relationship between them (Fig. 5 B and C). We found a significant association between synaptic contacts originating from both eyes, and in most cases, synaptic contacts from RGC axons from the ipsi- and contralateral eyes were in close proximity (Fig. 5D). This was in contrast to the diffuse location of synapses originating from nonretinal input (Fig. 5D). This suggests that retinal input to the SCN neurons has spatially restricted domains.
Fig. 5.
Bilateral retinal innervation to the SCN. A representative confocal image (A) and 3D reconstruction (B) showing VIP cell receiving innervation from both retinas (red CTβ from right eye and green CTβ from left eye). (C) The diagram for distribution analysis. (D) Retinal inputs displayed a particular pattern of innervation with both retinal synaptic contacts in close apposition. n = 15–20 cells, **P < 0.01, by Student’s t test. (E and F) c-Fos immunostaining of the SCN from mouse received no light (E) or a light pulse (1,000 lx) during the active phase (CT 14) (F). (G and H) In monocular-deprived mice, a similar light pulse stimulus still induced a sustained number of c-Fos+ cells. (I) Quantification of c-Fos+ cell number in the SCN from E–H. No significant differences were observed between the ipsilateral (IpsiL) and contralateral (ContraL) sides of the SCN in monocular-deprived mice. n = 5; **P < 0.001 vs. control-LP and aP < 0.001 vs. monocular-deprived mice (IpsiL and ContraL) by Tukey’s test. (J) The diagram for topographic distribution analysis. (K) Quantification of the c-Fos(+) cells topographic distribution in the SCN from control mice and the IpsiL or ContraL SCN regions from monocular-deprived mice. *P < 0.05 and **P < 0.001 vs. the control by Tukey’s test. [Scale bars: 5 μm (A and B); 100 μm (E).] Data are the mean ± SE.
Monocular and Binocular Light Stimulations Induce Distinct c-Fos Activation Patterns in the SCN.
Based on the innervation pattern to the SCN from both eyes, we decided to evaluate the functional implications of such inputs. Induction of the immediate-early gene, c-Fos, after a light pulse applied during the active phase of rodents is a commonly used method to evaluate neuronal activation (29). We presented a light pulse (1,000 lx at CT14) to control and monocular-deprived mice and measured induction of c-Fos in the SCN. Remarkably, in monocular-deprived mice, cFos was equally induced in both hemispheres of the SCN consistent with our morphological analyses that the SCN receives equal inputs from both eyes (Fig. 5 E–I). However, in monocular-deprived mice, cFos levels were significantly reduced compared with those of control mice (Fig. 5 E–I). In addition, c-Fos induction was observed throughout the SCN in control animals, whereas in monocular-deprived mice, its induction was localized mainly to the ventral part of the SCN (Fig. 5 E–H, J, and K). These functional data in conjunction with the spatially restricted input of SCN neurons provide evidence that the dorsal part of the SCN possibly requires synergistic inputs from both eyes to activate SCN neurons.
Discussion
Multiple Brain Nuclei Are Innervated by a Single M1 ipRGC.
In this study, we were able to evaluate the axonal structure of a single ipRGC in the SCN and compare axonal fields to other retinorecipient areas that received collateral input from the same ipRGC. Using this conditional approach, we were able to trace M1 ipRGCs, which are exclusively labeled probably due to their high levels of expression of melanopsin (9). Consistent with earlier reports (30, 31), we found that ipRGCs that innervate the SCN send collateral projections to the IGL. However, the complexity of the terminal fields was much less pronounced in the IGL compared with the SCN. In addition, we observed that ipRGCs also had collateral axons that targeted other brain nuclei such as the vLGN, which is part of the lateral geniculate complex for visual function; the VMH, which is involved in appetite and body weight control; the habenular complex implicated in the limbic system; the olivary pretectal nucleus, which controls the pupillary light reflex; the SC, which is important for visual-motor coordination (11); and the pretectum/SC region, which was shown to be involved in sleep regulation (32). Similar to IGL innervation, we also found that ipRGC axonal terminal fields in these regions were less elaborate, compared with the SCN. It is important to note that some conventional RGCs projecting to the LGN also send collaterals to the midbrain, including the pretectum and SC, with different axonal arbors in each region (33, 34). Interestingly, we observed that up to five different brain targets received input from a single ipRGC. These results indicate that a single retinal cell can affect brain areas involved in many distinct light-mediated behaviors.
The Major Peptidergic Neurons of the SCN Receive Retinal Input.
VIP+ cells were classically described as the principal retinal target in the SCN (19, 20). About 60% of VIP+ cells show c-Fos induction after a light pulse stimulation (21). VIP+ cells are located in the ventral part of the SCN, in apposition with the optic chiasm, making these cells the best candidates for receiving light input. VIP+ cells send projections to the entire SCN, affecting the functions of other VIP+ cells and clock cells located in the shell of the SCN (15). Here, we showed that in mice ipRGCs form direct synaptic connections with VIP cells, but also with somas of AVP and GRP neurons. These results are the first demonstration, to our knowledge, of a direct retinal input to AVP cells, suggesting that ipRGCs are poised to provide direct light inputs to several peptidergic neuronal populations in the SCN.
Consistent with the innervation of several neuronal populations in the SCN, our single-cell labeling revealed that ∼20% of ipRGCs innervate the ventral part of the SCN, whereas ∼80% innervate the medio-dorsal region. This result was confirmed with the synaptophysin–tdTomato-inducible system in which we labeled the majority of ipRGC presynaptic terminals in the SCN, indicating that the medio-dorsal SCN region receives the strongest retinal input.
Previous studies indicated that light-induced c-Fos expression is located primarily in the ventral part of the SCN (35). Because our morphological data indicated that neurons in the medio-dorsal SCN, such as AVP and GRP, receive direct retinal input as strongly as VIP cells, we wondered why previous studies had shown stronger cFos induction in VIP cells. One possibility is that the threshold for induction in the dorsal region of the SCN requires stimulation from both eyes. Our results support this hypothesis, as we observed only c-Fos induction in the dorsal part of the SCN under binocular but not monocular stimulation. This, in conjunction with the spatially restricted pattern of innervation of SCN neurons from the retina, indicates possible convergent activation of AVP neurons by ipRGCs. This could be a built-in mechanism whereby VIP neurons can be activated at low light levels whereas AVP neurons require higher light intensities to stimulate the majority of ipRGCs in the retina due to their low photon catch (36).
Atypical ipRGC Ipsilateral Projection Patterns to the SCN.
The mouse retina is divided into four quadrants, based on nasal-temporal and dorso-ventral axes. It was shown that RGCs that project ipsilaterally are located in the ventro-temporal quadrant of the retina (25, 37). The results presented here indicate that ipsilaterally projecting ipRGCs were also located in the ventro-temporal part of the retina, although our low number of cells (two in total) precluded us from drawing a stronger conclusion. In the mouse, it was shown that RGCs project to visual targets with a 9:1 contralateral:ipsilateral ratio (25, 38). ipRGCs with ipsilateral projections (unilaterally) or with contralateral projections follow the same contralateral: ipsilateral ratio as conventional RGCs. Therefore, contralateral and ipsilateral ipRGCs could use Ist2 and Zic2 programs similar to regular RGCs for path finding at the midline in the optic chiasm during development (37). However, uniquely to ipRGCs, a subset (66.7%) of contralateral ipRGC axons cross the midline and bilaterally innervate the SCN. Thus, this bilateral innervation equalizes the final innervation volume from one eye to both sides of the SCN, despite the 9:1 contralateral-to-ipsilateral cell number. However, this causes a conundrum of how the contralaterally projecting ipRGCs can recross the midline. Although detailed mechanistic understanding is currently lacking for retinal ganglion cells, it is well established that commissure axons that cross the midline do not recross back due to activation of robo1-slit-repulsive signals (39). We propose that the targeting of the ipsilateral SCN by the contralateral ipRGCs occurs later in development when the robo1-slit or analogous repulsive signals have been down-regulated. Consistent with this idea, the SCN is fully innervated by retinal fibers only ∼10 d after birth (40).
We also observed that the dorsal SCN-targeting ipRGCs were clustered in the dorsal-temporal region of the retina, whereas ventral and medial SCN-targeting ipRGCs were clustered at the ventral-nasal region of the retina. This pattern suggests a crude topographic map of ipRGC innervation in the SCN for non-image–forming functions, similar to regular RGCs for image-forming visual functions (41). Because RGCs use the Ephrin/Eph gradient to establish topographic maps between the retina and LGN/SC, ipRGCs could also use the same Eph receptor to guide them to specific regions in the SCN. Under environmental conditions, the sun provides overhead illumination, and therefore the ventral retina should receive the highest light input. Thus, ipRGCs located in the ventral retina could be the primary ipRGCs that project to VIP and GRP neurons in the ventral SCN for circadian photoentrainment in the wild.
In this study, we provide the first evidence, to our knowledge, highlighting the elaborate axonal fields of ipRGC innervation specifically to the SCN and show how the SCN is unique in receiving equal innervation from both eyes compared with other retinorecipient regions. We also uncovered that AVP neurons do receive direct retinal input and that equal innervation from both eyes may be essential for activating AVP neurons in response to environmental light input.
Materials and Methods
All animals were handled in accordance with guidelines of the Animal Care and Use Committees of Johns Hopkins University and were approved by the Institutional Animal Care and Use Committees of National Taiwan University. Additional materials and methods are described in SI Materials and Methods.
SI Materials and Methods
Animals.
Mice of a mixed background (BL/6; 129SvJ) and aged 3–5 mo were used in this study. All mice were housed under a 12-h light:12-h dark cycle at a temperature of 22 °C with food and water ad libitum. The Opn4CreERT2/+;Z/AP mouse line was previously described to trace labeled ipRGCs induced by tamoxifen (42). Opn4CreERT2/+ mice were mated with ROSASynaptophys–tdTomato (fluorescent loxP-flanked reporter under control of a general promoter from Jackson Laboratory, stock no. 012570). This generated a mouse line (Opn4CreERT2/+;ROSASynaptophysin–tdTomato) in which most ipRGCs expressed the fused proteins (induced by high doses of tamoxifen) in axonal terminals.
Tamoxifen Injection.
For single-cell tracing experiments and to reduce the probability of labeling multiple ipRGCs, the right eye of each mouse was enucleated 1 d before the tamoxifen injection. In Opn4CreERT2/+;Z/AP mice, cre recombinase was induced in a tamoxifen dose-dependent manner, so the amount of tamoxifen determined the number of labeled ipRGCs. With ∼0.05 mg tamoxifen/g body weight (by s.c. injection), we were able to label a single ipRGC. Because the efficiency of tamoxifen is important, we prepared fresh tamoxifen every 2–3 mo and stored it at −80 °C before use.
Alkaline Phosphatase Staining.
With the aim of fully tracing projections of a single ipRGC, mice were killed 2 wk after the tamoxifen injections. Mice were deeply anesthetized by an i.p. injection of Avertin (20 mg/mL) and then intracardially perfused with PBS followed by 4% (wt/vol) paraformaldehyde. Retinas were isolated as eye cups, and the nasal sides of the retinas were labeled with a small cut. Brains were dissected out and cut into coronal sections (200 μm) using a vibratome. To inactivate endogenous alkaline phosphatase activity, samples were put into a 65 °C water bath for 1 h. Samples were incubated overnight with NBT/BCIP tablets (Roche, 11697471001) in darkness at room temperature. Samples were then washed with PBS supplemented with 0.5% (vol/vol) Triton-X 100. Retinas were cut into quadrants and flat-mounted. Both retinas and brains sections were postfixed in 4% paraformaldehyde and then dehydrated in an ethanol series. The following day, all samples were cleared and mounted in a mixture of benzyl benzonate and benzyl alcohol (BB:BA, 2:1 vol/vol). Samples were imaged with a Zeiss AxioOberver Z1 inverted microscope with 1-μm Z-stack interval using a 40× objective lens (N.A. 0.75).
Eye Injections.
To visualize retinofugal projections originating from each eye, intravitreal injections (1 μL) of the fluorescently conjugated (Alexa Fluor 488 and 594) anterograde tracer cholera toxin β-subunit (CTβ) were performed. Animals were given 3–4 d for tracer to reach axon terminals and perfused as described above.
Immunohistochemistry.
After perfusion, brains were dissected out and postfixed overnight. Tissue was cryosectioned at 40 μm in the coronal plane, blocked for 1.5 h in PBS containing 0.3% Triton X-100 and 3% (vol/vol) heat-inactivated goat serum (Invitrogen), and stained using the following antibodies (in 0.1 M PBS with 3% goat serum and 0.3% Triton X-100): rabbit α-VIP (1: 500; ImmunoStar 20077); rabbit α-GRP (1: 500; ImmunoStar 20073); rabbit α-AVP (1: 800; ImmunoStar 20069); mouse α-synaptophysin (1: 300; Cell Signaling 9020); guinea pig α-Vglut2 (1: 1000; Millipore AB2251); and rabbit α-AMPA GluR4 (1: 100; Cell Signaling D41A11). Sections were incubated for 1–2 d at 4 °C. The following secondary antibodies were used (1: 500; Molecular Probes): goat anti-rabbit Alexa 350; goat anti-rabbit Alexa 488; goat anti-rabbit Alexa 546; goat anti-mouse Alexa 647; and goat anti-guinea pig Alexa 647. Finally, slides were mounted in AntiFade medium (Molecular Probes).
To assess light-induced c-Fos expression in the SCN, mice were subjected to a 15-min light pulse (of 1,000 lx) 2 h after the onset of activity (CT 14). Mice were then kept in darkness for 90 min and perfused (in darkness) as previously described. Brains were postfixed overnight in the same fixative, and coronal sections (50 μm) were obtained using a vibratome. Sections were blocked for 1.5 h in PBS containing 0.3% Triton X-100 and 3% heat-inactivated goat serum and then incubated using a rabbit anti-cFos antibody (Calbiochem Ab-5; 1: 2 × 10⁴ in 0.1 M PBS with 3% goat serum and 0.3% Triton X-100) for 1–2 d at 4 °C. Immunohistochemistry detection was performed using a Vectastain HRP kit (Vector Labs) based on biotin–streptavidin–peroxidase and visualized using 3,3′-diaminobenzidine as the chromogen. Finally, sections were mounted on microscope slides, dehydrated, and sealed with a coverslip.
Morphometric Analysis.
All images obtained were assembled and processed in Adobe Photoshop (Adobe Systems) to adjust the brightness and contrast. No other adjustment was made. For all morphometric image processing and analysis, digitalized captured TIF images were transferred to ImageJ software (NIH). All of the nomenclature used in this article follows that of Paxinos and Franklin’s The Mouse Brain in Stereotaxic Coordinates (43). In some cases, channels were randomly rotated (90° clockwise or counterclockwise) to confirm a lack of colocalization.
Retinal postsynaptic targets in the SCN.
VIP-, GRP-, and AVP-immunostained cells were analyzed using a confocal z-stack reconstruction. Triple colocalization points (CTβ + synaptophysin + a cell marker) were considered a retinal synaptic contact. Results obtained from 25 to 30 cells were averaged and used as a representative value per group. Five or six animals per group were used.
Map of ipRGC presynaptic terminals in the SCN.
Coronal SCN sections obtained from Opn4CreERT2/+;ROSASynaptophysin–tdTomato mice were costained using anti-Vglut2 and AMPA GluR4 antibodies. Using high-resolution confocal images, a tdTomato–Vlgut2 colocalization analysis (Manders’ coefficients) was conducted using Carl Zeiss Zen 2012 (Black edition) software. Results obtained from 7 to 10 images were averaged and used as a representative value per mouse. Four animals per group were used. For the tdTomato topographic analysis, images obtained from the medial SCN were converted to an 8-bit gray scale, and a threshold value was applied to obtain binary images. The SCN was divided into ventral, medial, and dorsal regions. Finally, tdTomato puncta were quantified and expressed as a percentage of the total area occupied. Results obtained from three to five sections were averaged. Five animals per group were used.
Bilateral retinal innervation.
Single-cell reconstructions were performed using a confocal z-stack analysis. Ipsilateral retinal innervation was defined as the center point, and distances to the contralateral retinal and nonretinal synaptic contacts were measured. Results obtained from 15 to 20 cells were averaged and used as a representative value per group. Five or six animals per group were used.
Assessment of light-induced c-Fos expression.
Serial coronal sections were analyzed, and the total number of c-Fos(+) neurons in the SCN area was counted. Results obtained from three to five sections were averaged and used as a representative value per group. Five animals per group were used.
Single-cell reconstruction.
Stacked images of whole-mount retina or coronal brain slices with AP staining was transferred to Neurolucida software (MBF Bioscience) for 3D reconstruction. The dendritic and axonal properties were calculated with Neurolucida Explore program (MBF Bioscience). Specifically, the axon volume was calculated using a convex hull analysis. The total SCN volume was estimated by assuming the SCN to be a triangular prism. Values of the base area and height used to calculate the SCN volume were average numbers from all SCNs analyzed in this study. The principal component analysis (PCA) analysis was generated by the statistics software PAST (44) using somato-dendritic properties as input features including the relative location of cell in the retina [dorsal-ventral index (DV index) and nasal-temporal index (NT index)], soma size, dendritic length, dendritic surface, and total branch points. Correlation of soma, dendrite, and axon morphology were calculated and plotted with software R. DV index is the normalized location of cell body in the retinal dorsal-to-ventral axis. NT index is the normalized location of cell body in the retinal nasal-to temporal axis. Bilateral index is the percentage of ipsilateral axon length of total axon length in the SCN for contralateral projecting ipRGCs.
Statistical Analysis.
Statistical analysis of results was made by a Student’s t test or a two-way analysis of variance followed by Tukey’s test or the post hoc Bonferroni test, as stated in Figs. S6D and S7C.
Supplementary Material
Acknowledgments
We thank the Technology Commons, College of Life Science at National Taiwan University for technical assistance with single-cell reconstruction and Johns Hopkins University Mouse Tri-Lab for support and discussion. This work was supported by generous contributions from the PEW Charitable Trusts (D.C.F.), National Institutes of Health Grant GM076430 (to S.H.), and Taiwan Ministry of Science and Technology Grant MOST 101-2311-B-002-023-MY2 (to S.-K.C.).
Footnotes
The authors declare no conflict of interest.
This article is a PNAS Direct Submission.
This article contains supporting information online at www.pnas.org/lookup/suppl/doi:10.1073/pnas.1523629113/-/DCSupplemental.
References
- 1.DeCoursey PJ. Circadian photoentrainment: Parameters of phase delaying. J Biol Rhythms. 1986;1(3):171–186. doi: 10.1177/074873048600100301. [DOI] [PubMed] [Google Scholar]
- 2.Hattar S, et al. Melanopsin and rod-cone photoreceptive systems account for all major accessory visual functions in mice. Nature. 2003;424(6944):76–81. doi: 10.1038/nature01761. [DOI] [PMC free article] [PubMed] [Google Scholar]
- 3.Wässle H. Parallel processing in the mammalian retina. Nat Rev Neurosci. 2004;5(10):747–757. doi: 10.1038/nrn1497. [DOI] [PubMed] [Google Scholar]
- 4.Morin LP. Neuroanatomy of the extended circadian rhythm system. Exp Neurol. 2013;243:4–20. doi: 10.1016/j.expneurol.2012.06.026. [DOI] [PMC free article] [PubMed] [Google Scholar]
- 5.Hattar S, Liao HW, Takao M, Berson DM, Yau KW. Melanopsin-containing retinal ganglion cells: Architecture, projections, and intrinsic photosensitivity. Science. 2002;295(5557):1065–1070. doi: 10.1126/science.1069609. [DOI] [PMC free article] [PubMed] [Google Scholar]
- 6.Berson DM, Dunn FA, Takao M. Phototransduction by retinal ganglion cells that set the circadian clock. Science. 2002;295(5557):1070–1073. doi: 10.1126/science.1067262. [DOI] [PubMed] [Google Scholar]
- 7.Provencio I, et al. A novel human opsin in the inner retina. J Neurosci. 2000;20(2):600–605. doi: 10.1523/JNEUROSCI.20-02-00600.2000. [DOI] [PMC free article] [PubMed] [Google Scholar]
- 8.Schmidt TM, Chen SK, Hattar S. Intrinsically photosensitive retinal ganglion cells: Many subtypes, diverse functions. Trends Neurosci. 2011;34(11):572–580. doi: 10.1016/j.tins.2011.07.001. [DOI] [PMC free article] [PubMed] [Google Scholar]
- 9.Ecker JL, et al. Melanopsin-expressing retinal ganglion-cell photoreceptors: Cellular diversity and role in pattern vision. Neuron. 2010;67(1):49–60. doi: 10.1016/j.neuron.2010.05.023. [DOI] [PMC free article] [PubMed] [Google Scholar]
- 10.Güler AD, et al. Melanopsin cells are the principal conduits for rod-cone input to non-image-forming vision. Nature. 2008;453(7191):102–105. doi: 10.1038/nature06829. [DOI] [PMC free article] [PubMed] [Google Scholar]
- 11.Hattar S, et al. Central projections of melanopsin-expressing retinal ganglion cells in the mouse. J Comp Neurol. 2006;497(3):326–349. doi: 10.1002/cne.20970. [DOI] [PMC free article] [PubMed] [Google Scholar]
- 12.Baver SB, Pickard GE, Sollars PJ, Pickard GE. Two types of melanopsin retinal ganglion cell differentially innervate the hypothalamic suprachiasmatic nucleus and the olivary pretectal nucleus. Eur J Neurosci. 2008;27(7):1763–1770. doi: 10.1111/j.1460-9568.2008.06149.x. [DOI] [PubMed] [Google Scholar]
- 13.Welsh DK, Takahashi JS, Kay SA. Suprachiasmatic nucleus: Cell autonomy and network properties. Annu Rev Physiol. 2010;72:551–577. doi: 10.1146/annurev-physiol-021909-135919. [DOI] [PMC free article] [PubMed] [Google Scholar]
- 14.Karatsoreos IN, Yan L, LeSauter J, Silver R. Phenotype matters: Identification of light-responsive cells in the mouse suprachiasmatic nucleus. J Neurosci. 2004;24(1):68–75. doi: 10.1523/JNEUROSCI.1666-03.2004. [DOI] [PMC free article] [PubMed] [Google Scholar]
- 15.Kalamatianos T, Kalló I, Piggins HD, Coen CW. Expression of VIP and/or PACAP receptor mRNA in peptide synthesizing cells within the suprachiasmatic nucleus of the rat and in its efferent target sites. J Comp Neurol. 2004;475(1):19–35. doi: 10.1002/cne.20168. [DOI] [PubMed] [Google Scholar]
- 16.Abrahamson EE, Moore RY. Suprachiasmatic nucleus in the mouse: Retinal innervation, intrinsic organization and efferent projections. Brain Res. 2001;916(1-2):172–191. doi: 10.1016/s0006-8993(01)02890-6. [DOI] [PubMed] [Google Scholar]
- 17.Yan L, et al. Exploring spatiotemporal organization of SCN circuits. Cold Spring Harb Symp Quant Biol. 2007;72:527–541. doi: 10.1101/sqb.2007.72.037. [DOI] [PMC free article] [PubMed] [Google Scholar]
- 18.Tanaka M, et al. Direct retinal projections to GRP neurons in the suprachiasmatic nucleus of the rat. Neuroreport. 1997;8(9-10):2187–2191. doi: 10.1097/00001756-199707070-00020. [DOI] [PubMed] [Google Scholar]
- 19.Tanaka M, Ichitani Y, Okamura H, Tanaka Y, Ibata Y. The direct retinal projection to VIP neuronal elements in the rat SCN. Brain Res Bull. 1993;31(6):637–640. doi: 10.1016/0361-9230(93)90134-w. [DOI] [PubMed] [Google Scholar]
- 20.Ibata Y, et al. Vasoactive intestinal peptide (VIP)-like immunoreactive neurons located in the rat suprachiasmatic nucleus receive a direct retinal projection. Neurosci Lett. 1989;97(1-2):1–5. doi: 10.1016/0304-3940(89)90129-8. [DOI] [PubMed] [Google Scholar]
- 21.Aïoun J, Chambille I, Peytevin J, Martinet L. Neurons containing gastrin-releasing peptide and vasoactive intestinal polypeptide are involved in the reception of the photic signal in the suprachiasmatic nucleus of the Syrian hamster: An immunocytochemical ultrastructural study. Cell Tissue Res. 1998;291(2):239–253. doi: 10.1007/s004410050994. [DOI] [PubMed] [Google Scholar]
- 22.Lokshin M, LeSauter J, Silver R. Selective distribution of retinal input to mouse SCN revealed in analysis of sagittal sections. J Biol Rhythms. 2015;30(3):251–257. doi: 10.1177/0748730415584058. [DOI] [PMC free article] [PubMed] [Google Scholar]
- 23.Morin LP, Studholme KM. Retinofugal projections in the mouse. J Comp Neurol. 2014;522(16):3733–3753. doi: 10.1002/cne.23635. [DOI] [PMC free article] [PubMed] [Google Scholar]
- 24.Morin LP, Allen CN. The circadian visual system, 2005. Brain Res Brain Res Rev. 2006;51(1):1–60. doi: 10.1016/j.brainresrev.2005.08.003. [DOI] [PubMed] [Google Scholar]
- 25.Rice DS, Williams RW, Goldowitz D. Genetic control of retinal projections in inbred strains of albino mice. J Comp Neurol. 1995;354(3):459–469. doi: 10.1002/cne.903540312. [DOI] [PubMed] [Google Scholar]
- 26.Pickard GE. The afferent connections of the suprachiasmatic nucleus of the golden hamster with emphasis on the retinohypothalamic projection. J Comp Neurol. 1982;211(1):65–83. doi: 10.1002/cne.902110107. [DOI] [PubMed] [Google Scholar]
- 27.Kim J, Matney CJ, Blankenship A, Hestrin S, Brown SP. Layer 6 corticothalamic neurons activate a cortical output layer, layer 5a. J Neurosci. 2014;34(29):9656–9664. doi: 10.1523/JNEUROSCI.1325-14.2014. [DOI] [PMC free article] [PubMed] [Google Scholar]
- 28.Mizoro Y, et al. Activation of AMPA receptors in the suprachiasmatic nucleus phase-shifts the mouse circadian clock in vivo and in vitro. PLoS One. 2010;5(6):e10951. doi: 10.1371/journal.pone.0010951. [DOI] [PMC free article] [PubMed] [Google Scholar]
- 29.Edelstein K, Beaulé C, D’Abramo R, Amir S. Expression profiles of JunB and c-Fos proteins in the rat circadian system. Brain Res. 2000;870(1-2):54–65. doi: 10.1016/s0006-8993(00)02401-x. [DOI] [PubMed] [Google Scholar]
- 30.Pickard GE. Bifurcating axons of retinal ganglion cells terminate in the hypothalamic suprachiasmatic nucleus and the intergeniculate leaflet of the thalamus. Neurosci Lett. 1985;55(2):211–217. doi: 10.1016/0304-3940(85)90022-9. [DOI] [PubMed] [Google Scholar]
- 31.Morin LP, Blanchard JH, Provencio I. Retinal ganglion cell projections to the hamster suprachiasmatic nucleus, intergeniculate leaflet, and visual midbrain: Bifurcation and melanopsin immunoreactivity. J Comp Neurol. 2003;465(3):401–416. doi: 10.1002/cne.10881. [DOI] [PubMed] [Google Scholar]
- 32.Miller AM, Obermeyer WH, Behan M, Benca RM. The superior colliculus-pretectum mediates the direct effects of light on sleep. Proc Natl Acad Sci USA. 1998;95(15):8957–8962. doi: 10.1073/pnas.95.15.8957. [DOI] [PMC free article] [PubMed] [Google Scholar]
- 33.Tamamaki N, Uhlrich DJ, Sherman SM. Morphology of physiologically identified retinal X and Y axons in the cat’s thalamus and midbrain as revealed by intraaxonal injection of biocytin. J Comp Neurol. 1995;354(4):583–607. doi: 10.1002/cne.903540408. [DOI] [PubMed] [Google Scholar]
- 34.Bowling DB, Michael CR. Projection patterns of single physiologically characterized optic tract fibres in cat. Nature. 1980;286(5776):899–902. doi: 10.1038/286899a0. [DOI] [PubMed] [Google Scholar]
- 35.Meijer JH, Schwartz WJ. In search of the pathways for light-induced pacemaker resetting in the suprachiasmatic nucleus. J Biol Rhythms. 2003;18(3):235–249. doi: 10.1177/0748730403018003006. [DOI] [PubMed] [Google Scholar]
- 36.Do MT, et al. Photon capture and signalling by melanopsin retinal ganglion cells. Nature. 2009;457(7227):281–287. doi: 10.1038/nature07682. [DOI] [PMC free article] [PubMed] [Google Scholar]
- 37.Herrera E, et al. Zic2 patterns binocular vision by specifying the uncrossed retinal projection. Cell. 2003;114(5):545–557. doi: 10.1016/s0092-8674(03)00684-6. [DOI] [PubMed] [Google Scholar]
- 38.Thompson ID, Morgan JE. The development of retinal ganglion cell decussation patterns in postnatal pigmented and albino ferrets. Eur J Neurosci. 1993;5(4):341–356. doi: 10.1111/j.1460-9568.1993.tb00502.x. [DOI] [PubMed] [Google Scholar]
- 39.Kidd T, et al. Roundabout controls axon crossing of the CNS midline and defines a novel subfamily of evolutionarily conserved guidance receptors. Cell. 1998;92(2):205–215. doi: 10.1016/s0092-8674(00)80915-0. [DOI] [PubMed] [Google Scholar]
- 40.McNeill DS, et al. Development of melanopsin-based irradiance detecting circuitry. Neural Dev. 2011;6:8. doi: 10.1186/1749-8104-6-8. [DOI] [PMC free article] [PubMed] [Google Scholar]
- 41.Chen SK, Badea TC, Hattar S. Photoentrainment and pupillary light reflex are mediated by distinct populations of ipRGCs. Nature. 2011;476(7358):92–95. doi: 10.1038/nature10206. [DOI] [PMC free article] [PubMed] [Google Scholar]
- 42.Joo HR, Peterson BB, Dacey DM, Hattar S, Chen S-K. Recurrent axon collaterals of intrinsically photosensitive retinal ganglion cells. Vis Neurosci. 2013;30(4):175–182. doi: 10.1017/S0952523813000199. [DOI] [PMC free article] [PubMed] [Google Scholar]
- 43.Paxinos G, Franklin KBJ. 2013. Paxinos and Franklin's the Mouse Brain in Stereotaxic Coordinates (Elsevier, San Diego), 4th Ed.
- 44.Hammer Ø, Harper DAT, Ryan PD. PAST: Paleontological statistics software package for education and data analysis. Palaeontol Electronica. 2001;4(1):1–9. [Google Scholar]
Associated Data
This section collects any data citations, data availability statements, or supplementary materials included in this article.


