Significance
Amyloid fibril formation underlies the pathogenesis of a large number of diseases. Among the neurodegenerative diseases, the process is prominent in Alzheimer’s disease. Fibril elongation has been thought to be a nucleation-dependent process that faithfully duplicates nucleus structure as each monomer adds to the fibril end. Polymorphism in fibril structure thus has been postulated to depend on initial nucleus structure. However, there is little direct observation of growing amyloid fibril structure. Here, using high-speed atomic force microscopy, we observed that Aβ1–42 fibril formation produced two distinct morphomers, “straight” and “spiral.” Surprisingly, we observed switching between these structures after the initiation of fibril elongation. Our results provide previously unidentified insights into the process of nucleation-dependent Aβ1–42 fibril formation.
Keywords: Alzheimer's disease, amyloidogenic proteins, kinetics, atomic force microscopy
Abstract
Aggregation of amyloidogenic proteins into insoluble amyloid fibrils is implicated in various neurodegenerative diseases. This process involves protein assembly into oligomeric intermediates and fibrils with highly polymorphic molecular structures. These structural differences may be responsible for different disease presentations. For this reason, elucidation of the structural features and assembly kinetics of amyloidogenic proteins has been an area of intense study. We report here the results of high-speed atomic force microscopy (HS-AFM) studies of fibril formation and elongation by the 42-residue form of the amyloid β-protein (Aβ1–42), a key pathogenetic agent of Alzheimer's disease. Our data demonstrate two different growth modes of Aβ1–42, one producing straight fibrils and the other producing spiral fibrils. Each mode depends on initial fibril nucleus structure, but switching from one growth mode to another was occasionally observed, suggesting that fibril end structure fluctuated between the two growth modes. This switching phenomenon was affected by buffer salt composition. Our findings indicate that polymorphism in fibril structure can occur after fibril nucleation and is affected by relatively modest changes in environmental conditions.
Amyloid fibril accumulation is associated with numerous neurodegenerative diseases, including Alzheimer’s (AD) (1–3), prionoses (4–7), Parkinson’s (8–11), and Huntington's (12). Nonhomologous genes encode the proteins involved in each disease, namely the amyloid β-protein (Aβ), prions (e.g., PrP, Sup35, Het-s), α-synuclein, and huntingtin, respectively. Each of these proteins assembles from a monomer state through a variety of intermediates to form insoluble amyloid fibrils that accumulate in brain tissues. The suggestion that brain Aβ accumulation and neurodegeneration are correlated remains an area of contention. Studies of human brain extracts and transgenic mice suggest such a correlation does not exist (13, 14), whereas other studies support this relationship (15). Amyloid deposition in the brain does correlate with progress from mild cognitive impairment to AD (16). The amount of brain amyloid in asymptomatic elderly people generally is less than in AD patients (17). Historically, amyloid fibrils have been regarded as the key pathologic agents in AD. This idea has been supplanted by theories in which oligomers are central (18, 19). A variety of studies support this view (20–23). In addition, oligomers appear to be more toxic to cultured cells than are fibrils (24, 25). Nevertheless, Aβ40 fibrils are neurotoxic (24, 26–28) and fibrillar Aβ appears to be associated with inflammation (29, 30) and oxidative damage (31, 32) in the brain. We believe that an unbiased assessment of working theories of disease causation does not allow one to conclude that the two theories are mutually exclusive. It is more likely that both types of assemblies are involved in AD pathogenesis. In fact, Lu et al. have provided support for this more inclusive theory by arguing that oligomers and fibrils exist in equilibrium (33). Such an equilibrium is thought to include, in addition, monomers and protofibrils (34).
Although specific intermediates and fibrils have been studied in isolation at particular stages of Aβ assembly, it has been more difficult to observe structural transitions that may occur among assembly types. Techniques such as thioflavin-T (ThT) fluorescence, circular dichroism spectroscopy, and Fourier transform infrared spectroscopy are widely used to monitor development of β-sheet structure, but these methods do not provide information on aggregate tertiary or quaternary structure. Structural studies using X-ray crystallography or solid-state NMR have provided useful information on protein structure at the atomic level, but this information is static in nature and does not reveal aspects of the gross structural transitions among assembly states. Electron microscopy also is a static method.
The process of fibril formation itself has been shown to be more complicated than originally thought. One reason is the huge conformational space of the intrinsically disordered Aβ monomer, which gives rise to many different oligomer structures, some of which are on-pathway for fibril formation and some of which are not. This diversity of prefibrillar structures is reflected in the structures of the fibrils that then form. Fibrils are polymorphic—Aβ forms fibrils with distinct structures depending on experimental conditions (35, 36). Additionally, different fibril types have different impacts on neurodegeneration (26, 33, 37–39). Thus, characterization of the structural dynamics of the fibril formation process is an important endeavor. Real-time visualization of monomer aggregation and fibril formation offers the possibility of understanding the dynamics of the system, developing hypotheses about assembly mechanisms, and elucidating aggregation mechanisms.
In the present study, we used high-speed atomic force microscopy (HS-AFM) (40, 41) to study the dynamics of Aβ1–42 assembly. We were able to visualize initial fibril nucleation and subsequent fibril elongation. We observed two distinct growth modes for Aβ1–42 fibrils—one producing straight fibrils and one producing spiral fibrils—and, unexpectedly, morphological switching between these two modes.
Results
HS-AFM Imaging of Temporal Changes in Low- and High-Molecular-Weight Aβ1–42 Fractions.
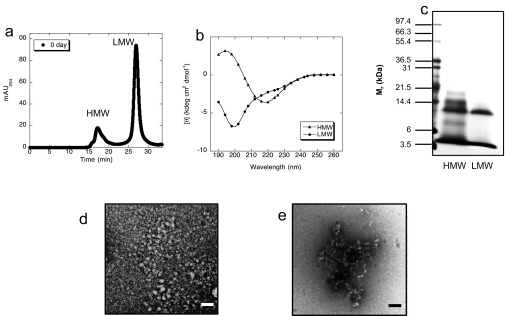
In preparation for HS-AFM observation, we separated Aβ1–42 peptides into low- and high-molecular-weight populations (LMW and HMW, respectively) and confirmed that their structure and assembly properties were consistent with previous studies (Supporting Information and Figs. S1 and S2) (28, 42–49). The LMW population comprised monomeric and low-order oligomeric Aβ1–42 (28). The HMW population contained higher-order oligomers (Fig. S1).
Fig. S1.
Preparation of HMW and LMW Aβ1–42 fraction. (A) SEC of Aβ1–42. The synthesized Aβ1–42 was applied on a gel filtration column (Superdex 75 HR, GE Healthcare) as described in Materials and Methods. HMW peak was eluted at 16–17 min followed by LMW peak eluted at 28–29 min. (B) CD spectra of LMW and HMW. (C) SDS/PAGE analysis of LMW and HMW fraction (silver staining). (D and E) TEM images of LMW (D) and HMW (E). (Scale bars, 100 nm.)
Fig. S2.
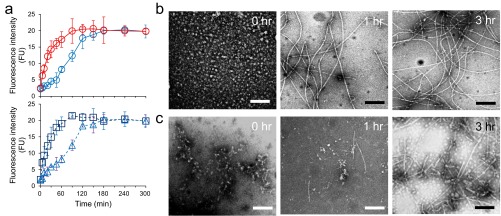
Aggregation time course of Aβ1–42 by ThT (A) and TEM images during Aβ1–42 incubation (B and C). (A) LMW (blue lines) or HMW (red lines) at 2.5 μM was incubated at 25 °C in the presence (dashed lines, Bottom) or absence (circles and solid lines, Top) of 5% (vol/vol) Aβ1–42 seeds (boxes) or 5% (vol/vol) HMW (triangles). (B and C) TEM images of Aβ1–42 aggregates in LMW (B) or HMW (C) incubation at the indicated times. (Scale bars, 100 nm.)
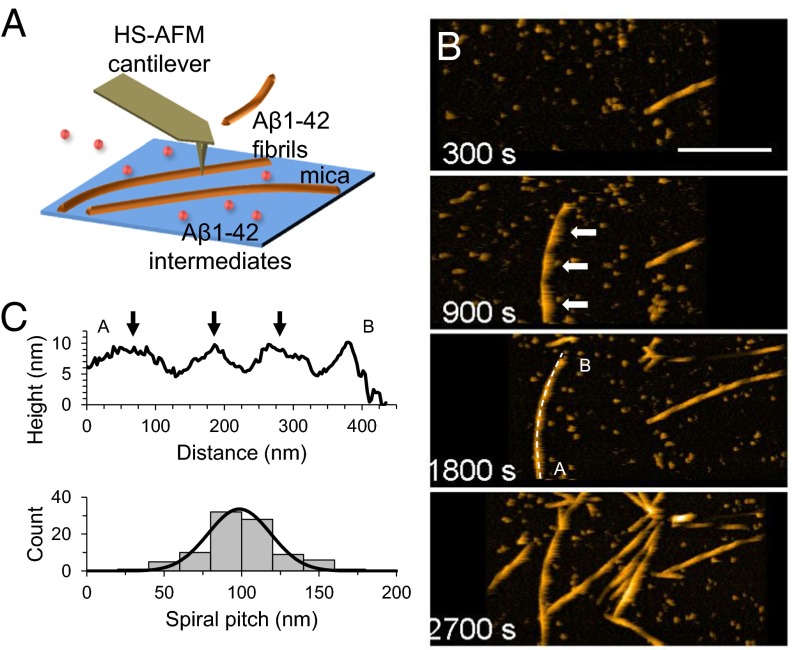
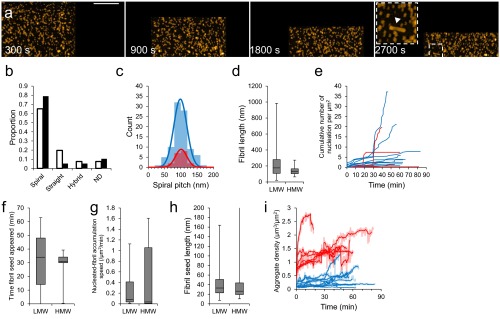
We then used HS-AFM to monitor the assembly of LMW (Fig. 1) and HMW (Fig. S3). Time 0 corresponds to the time when 100 mM NaCl was added to accelerate the assembly process. We observed nonfibrous particles with LMW initially (∼1,800 s), as shown in Fig. 1B (Movie S1). Subsequently, objects with fibrillar morphologies began to accumulate. These objects elongated during observation. Assembly height fluctuated between ∼5 and 10 nm with a periodicity of ∼100 nm, corresponding to a spiral structure (Fig. 1 B and C). Fibril growth stopped when one fibril end reached another fibril. This observation was consistent with time-lapse AFM imaging of Aβ1–40 (50). During HMW incubation, we observed that nonfibrous particles accumulated more extensively than seen with LMW (Fig. S3A and Movie S2). Fibrous objects were also observed (Fig. S3A), although they were small in number, and their structural features were consistent with the fibrils seen with LMW (Fig. S3 B and C). These observations were comparable to electron microscope images and bulk phase assays (Supporting Information and Fig. S2). We found no significant difference in fibril length between LMW and HMW samples due to the broad distribution of fibril length in the LMW sample (Fig. S3D). However, there were significant differences between LMW and HMW samples in the times at which fibril seeds appeared. HMW seeds formed most frequently 20–30 min after the addition of 100 mM NaCl, whereas LMW formed seeds over a much wider time range (Fig. S3 E and F). We found no significant differences in the nucleation rate or in the fibril seed size between LMW and HMW samples (Fig. S3 G and H). In addition, some HMW oligomers dissociated during early phases of incubation (Supporting Information, Fig. S4, and Movies S3 and S4), after which fibrils formed (Fig. S2C). These results suggest that LMW Aβ produced fibril seeds at various time through primary and secondary nucleation events. This suggestion is consistent with previous studies (51, 52). In contrast, HMW Aβ did not directly develop fibril seeds, but first dissociated to LMW Aβ that then formed seeds. Furthermore, these analyses also indicated that the results from HS-AFM observation corresponded to the conventional transmission electron microscope (TEM) images and bulk phase assays. This correspondence was also found in the correlation between the time courses of the total aggregate volume on mica and ThT binding assays (Supporting Information and Figs. S2A and S3I) and supported by observation of fibril growth inhibition in the presence of a natural polyphenolic compound, myricetin (Fig. S5).
Fig. 1.
HS-AFM imaging of LMW Aβ1–42. (A) Schematic representation of HS-AFM experiments. Aβ1–42 was introduced into the HS-AFM chamber. Aggregation was accelerated by addition of 100 mM NaCl. Aβ1–42 aggregates float in the chamber, and some of them attached on mica and were visualized. (B) HS-AFM images during incubation of LMW. (Scale bar, 300 nm. Z scale, 15 nm.) (C) Height profile of the selected dashed line (A to B) at 1,800 s in B (Top), and occurrence frequency of the length of the spiral pitch of Aβ1–42 fibrils with a normal distribution fit, giving a mean pitch length of 99 ± 20 nm for the fibrils from LMW (Bottom). Black arrows correspond to the white arrows in B at 900 s.
Fig. S3.
HS-AFM imaging of HMW Aβ1–42 and comparison with LMW incubation. (A) HS-AFM images during incubation of HMW. The region highlighted by the dashed box in the image frame for 2,700 s is enlarged (Inset). A representative short fibril in HMW incubation is indicated by a closed triangle (Inset). (Scale bar, 300 nm. Z scale, 15 nm.) (B) Proportion of number of spiral, straight, and hybrid fibril from LMW (open) or HMW (closed) Aβ1–42 incubation. Fibrils whose length is shorter than spiral pitch are classified as ND (not determined). (C) Occurrence frequency of the length of the spiral pitch of Aβ1–42 fibrils with a normal distribution fit, giving a mean pitch length of 99 ± 20 nm for the fibrils from LMW (blue) and 101 ± 17 nm from HMW (red). (D) Aβ1–42 fibril length before growth stop during LMW or HMW incubation of between 30 and 60 min [n = 41 (LMW), 10 (HMW)]. (E) Cumulative number of attached growing fibrils on observed area in LMW (blue) and HMW (red) Aβ1–42. Different lines correspond to distinct experiments. (F–H) Distributions of time when fibril seeds appeared (F), fibril accumulation rates (G), and fibril seed length during LMW incubation or HMW incubation (H). Fibril accumulation rates were calculated by linear regression on the linear portions of the growth curves in E. There was no significant difference in the rate between LMW and HMW incubation (Brunner–Munzel test). The variance difference in F was tested by F test, giving P value = 5 × 10⁻¹². (I) Time evolution of total Aβ1–42 aggregate density during LMW (blue) and HMW (red) Aβ1–42 incubation. Different lines correspond to distinct experiments. Individual traces are shown as smoothed lines (dark) with raw data (light). The raw traces are smoothed by finding median of 15 values. Boxes (D and F–H) extend from the 25th to 75th percentiles. The line in the box signifies the median. The whiskers are drawn from the minimum to 25th percentile value and from 75th percentile value to the maximum. They do not represent SEs.
Fig. S4.
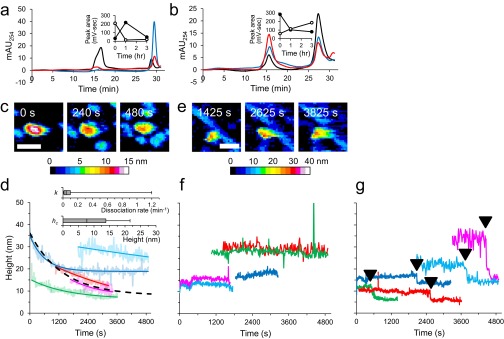
Kinetics of Aβ1–42 aggregates in HMW incubation. (A and B) Size-exclusion chromatograms for HMW (A) and LMW (B) fractions after incubation for 0 h (black), 1 h (blue), or 3 h (red). (A and B, Insets) Time evolution of SEC peak area for HMW (open circles) and LMW (closed circles) in the HMW incubation (A) and the LMW incubation (B). (C–G) HS-AFM imaging and analysis of individual aggregates in HMW incubation. (C and E) HS-AFM images of representative two types of aggregates: type I gradually decreased in its height (C); type II retained its height (E). The indicated time corresponds to the elapsed time after the addition of 100 mM NaCl. (Scale bars, 50 nm.) (D, F, and G) Five representative time courses of the type I (D), type II (F), and type III (G) aggregates. The horizontal axis shows the elapsed time after the addition of 100 mM NaCl. Each of the time courses for type I aggregates is shown with the fitting curve (dark colored line) described in the Supporting Information. The fitting curve with the median of the best-fit values is represented as a dashed line. (D, Inset) Box plots showing distributions of the best-fit values of dissociation rate of fast part, k (Top), and height of slow part, hc (Bottom). Boxes extend from the 25th to 75th percentiles. The line in the box signifies the median. The whiskers are drawn from the minimum to 25th percentile value and from 75th percentile value to the maximum. They do not represent SEs. The height of type III was maintained at a constant level, but suddenly decreased at the time indicated as closed triangles, and then the height was retained at a lower level. Different lines correspond to the distinct aggregates.
Fig. S5.
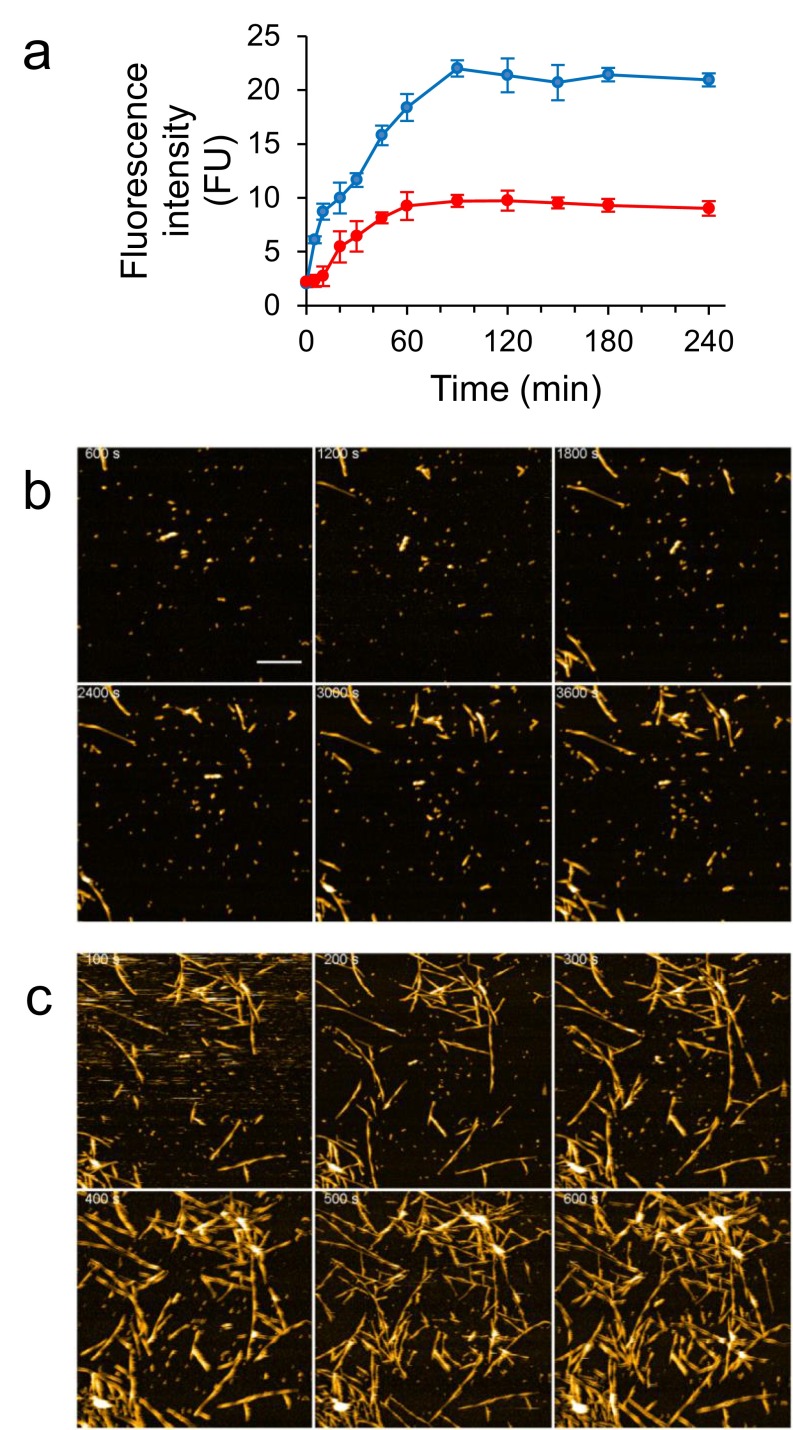
Inhibition of the Aβ1–42 fibril growth by myricetin. (A) Aggregation time course of Aβ1–42 by ThT in the presence or absence of myricetin. LMW Aβ1–42 at 2.5 μM, and 5% (vol/vol) Aβ1–42 fibril seeds were incubated with (red) or without (blue) 10 μM myricetin at 25 °C. ThT binding is expressed as mean fluorescence (FU) ± SD. To perform aggregation inhibition assays, the polyphenol myricetin (Myr) was dissolved in ethanol to 2.5 mM and then further diluted with 10 mM phosphate, pH 7.4, to a final concentration of 20 μM. The Myr solution was added to the Aβ1–42 reaction mixture to yield a molar ratio of 1:4 peptide:Myr and a final Myr concentration of 10 μM. The sample tubes were incubated at 25 °C for 0–4 h without agitation. (B and C) Reversible inhibition of the Aβ1–42 fibril growth by myricetin. (B) Serial images of the HS-AFM stage on which reaction mixtures containing 2.5 µM LMW, 5% (vol/vol) Aβ1–42 fibril seeds, and 10 μM myricetin. The indicated time in the images corresponds to the elapsed time after the addition of salt for acceleration of fibril growth. (C) Serial images of the same surface after the removal of myricetin. The frame rate was 0.2 frames per second and the pixel size was 400 × 400. (Scale bar, 300 nm.)
Video Imaging of Growth of Aβ1–42 Fibrils with Distinct Structures.
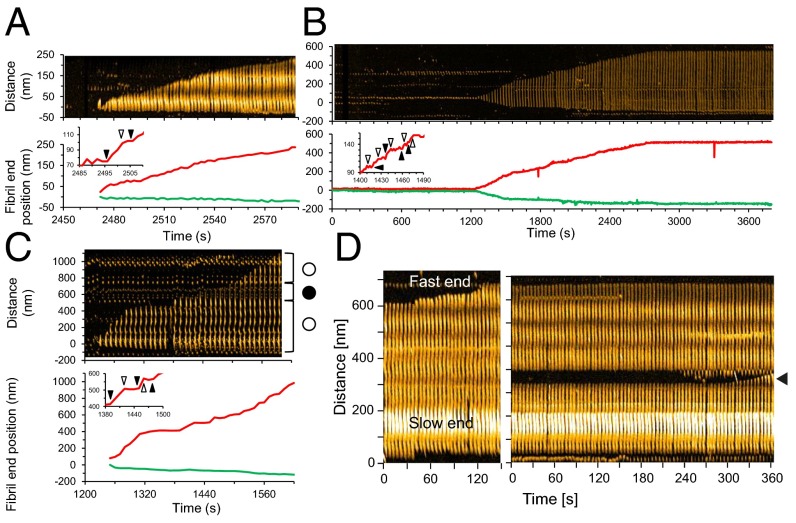
We next analyzed how individual fibrils formed. We identified three structurally distinct types of fibrils: (i) spiral structures of ∼100-nm periodicity that varied in height between 5 and 10 nm (Figs. 1 and 2A and Movie S5); (ii) thin, straight structures of ∼5 nm in height (Fig. 2B and Movie S6); and (iii) hybrid structure in which the spiral and straight structures coexisted (Fig. 2C and Movie S7). The growing processes of these fibrils are represented as kymographs and time courses of fibril end positions (Fig. 2 A–C). The growth mode is characterized by bidirectional growth, but at different rates at each end (polarization). The polarized bidirectional growth was observed in all of the types of fibrils (“fast and slow ends” correspond in Fig. 2 A–C to the upper and lower ends in the kymographs and to the red and green lines). Many of the fibrils exhibited stop and go behavior (Fig. 2 A–C, Insets), as observed for Aβ1–40 and other amyloid fibrils (53–56). For example, the fibril growth at the fast end stopped during ∼2,488–2,496 s, ∼2,502–2,506 s in Fig. 2A, ∼1,410–1,418 s in Fig. 2B, and ∼1,420–1,450 s, ∼1,460–1,480 s in Fig. 2C. We confirmed that the orientation of Aβ1–42 fibrils was retained in the interior of the fibrils as follows: (i) we broke the fibrils by increasing tapping force, which created new fibril ends; (ii) we then observed that at the breakage sites, each of the ends behaved as if it were the original fast or slow end, i.e., the fibril growth rates were consistent with the polarity of the original fibrils (Fig. 2D). Fig. 2 A and B also shows that the structure of growing region was the same as that of the template region. This structural feature in the fibril growth indicates that template structure can determine fibril morphology, which is consistent with a dock-lock mechanism (57). In the hybrid-type fibrils, the structure of the growing region was determined primarily by the template, but sometimes switched to another type (spiral to straight at 1,440 s (145th frame) or straight to spiral at 1,520 s (153rd frame) in Fig. 2C).
Fig. 2.
HS-AFM imaging of fibrils emanating from LMW Aβ1–42. (A–C) Representative kymographs (Top) and time evolution of fast- (red) and slow- (green) growing fibril ends (Bottom) of single spiral (A), straight (B), and hybrid (C) types of LMW Aβ1–42 fibril elongation. Open and closed circles in C indicate the spiral and straight regions in the hybrid fibril. The insets in time evolution: enlarged time courses show representative stepwise growth at fast ends. Starts and ends of individual steps are indicated by closed and open triangles. (D) Polarity of Aβ1–42 fibril growth. Kymograph of fibril growth before fragmentation (Left), indicating polarized elongation in which top and bottom ends of the kymograph indicate fast- and slow-growing ends. Kymograph of fibril growth from exogenous ends of the fibril after fragmentation at the region indicated as a closed triangle (Right).
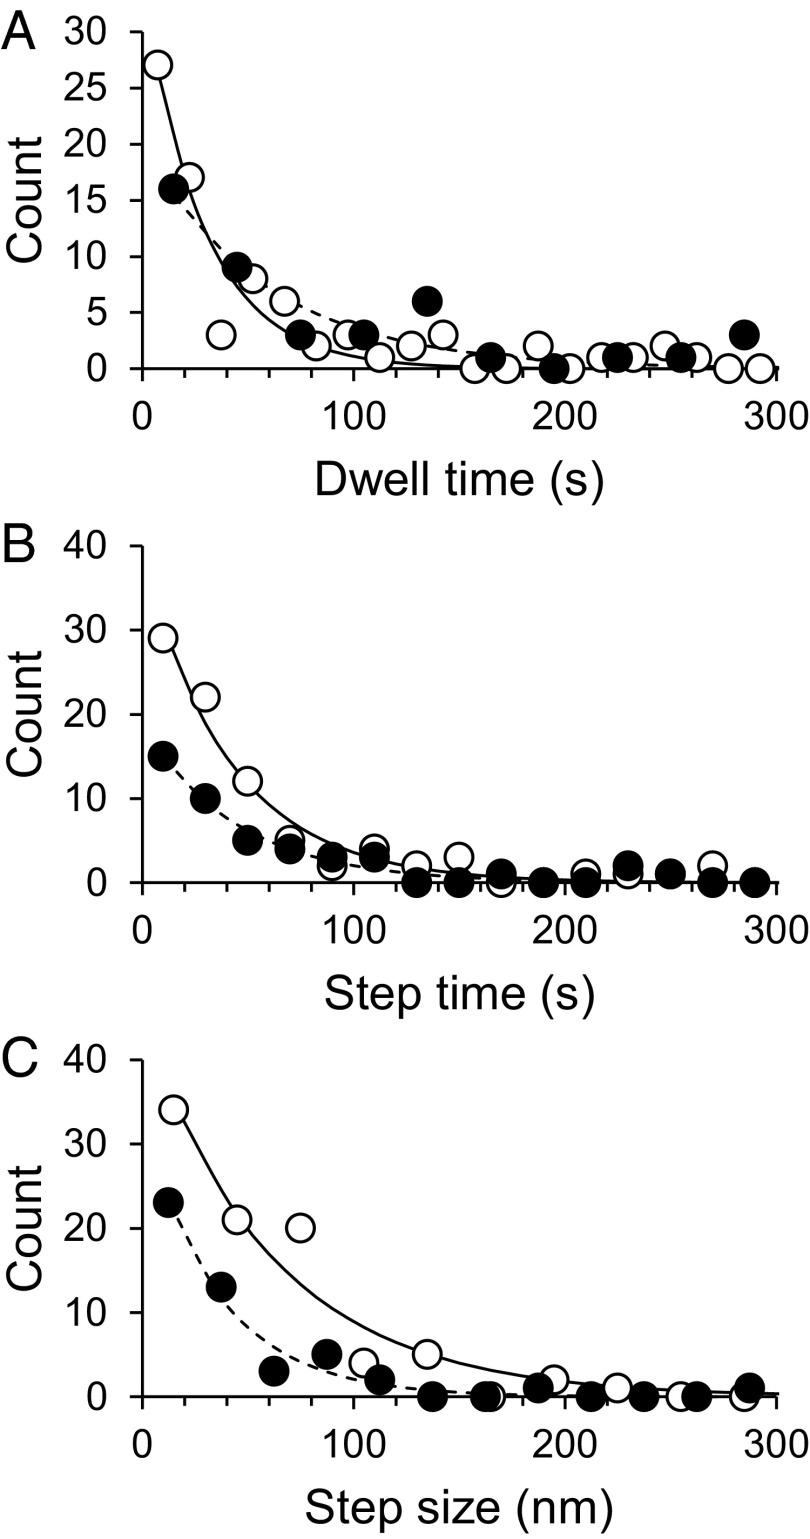
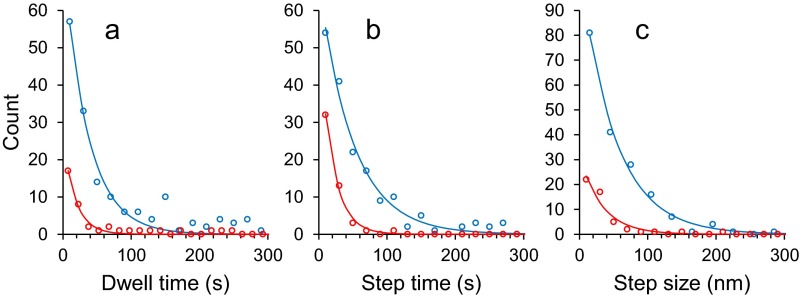
To quantitatively compare fibril growth kinetics between fibril types, we analyzed stepwise growth of individual fibrils. “Stepwise growth” was considered to comprise two phases: dwell (during which no growth was observed and fibril end position was constant) and step (during which continuous growth was observed and fibril end position increased). Step could further be characterized by step time (each period of continuous growth) and step size (the increase in fibril length occurring during each such period). We observed that the frequency distributions for these three metrics could be described by simply decreasing exponential functions of the type F = A·e−t/τ, where t is time (s−1), A is a constant, and τ is the mean dwell or mean step time (Fig. 3). In the case of step size, t is instantaneous step size and τ is mean step size. The given parameters are shown in Table 1 with the number of analyzed fibrils and steps.
Fig. 3.
Statistical analysis of stepwise Aβ1–42 fibril growth from LMW incubation. Distributions (circles) of dwell time between steps (A), time for a single step (B), and single step size (C) with exponential fits (lines) giving mean values shown in Table 1, for spiral (open circles with solid lines) and straight (closed circles with dashed lines) fibrils from LMW Aβ1–42 incubation.
Table 1.
Parameters for stepwise growth kinetics at fast ends of spiral and straight fibrils from LMW
| Fibril types | Spiral | Straight |
| Number of analyzed fibrils | 38 | 10 |
| Number of total analyzed steps* | 124 | 54 |
| Number of steps per one fast end* | 3.3 | 5.4 |
| Dwell time before stepwise growth, s† | 29 | 59 |
| Time required for one step, s† | 42 | 45 |
| Step size, nm† | 62 | 36 |
| Mean growth length, nm‡ | 204 | 197 |
Steps for 1 h from incubation start, except 15 steps in fibrils from LMW incubation.
Fitting parameters from Fig. 3.
Values obtained from the product of number of steps and step size at fast end.
A fast end of spiral fibrils had shorter dwell times and longer step sizes than did those of straight-type fibrils, although their step times are similar. In contrast, the number of steps at a fast end of straight fibrils was larger than that of the spiral fibril. The estimated mean growth length of spiral and straight fibrils was essentially the same (∼200 nm). The difference in fibril growth kinetics between LMW and HMW Aβ1–42 was described in Supporting Information, Fig. S6, and Table S1.
Fig. S6.
Statistical analysis of stepwise Aβ1–42 fibril growth from LMW or HMW incubation. Distributions (symbols) of dwell time between steps (A), time for a single step (B), and single step size (C) with exponential fits (lines) giving mean values shown in Table S1, for fibrils from LMW (blue) or HMW (red).
Table S1.
Parameters for stepwise growth kinetics at fast ends of fibrils from LMW and HMW
| Fibril types | From LMW | From HMW |
| Number of analyzed fibrils | 66 | 20 |
| Number of total analyzed steps* | 238 | 60 |
| Number of steps per one fast end* | 3.6 | 2 |
| Dwell time before stepwise growth (s)† | 36 | 18 |
| Time required for one step (s)† | 50 | 20 |
| Step size (nm)† | 51 | 33 |
| Mean growth length (nm)‡ | 185 | 98 |
Steps for 1 h from incubation start, except 15 steps in fibrils from LMW incubation.
Fitting parameters from Fig. S6.
Values obtained from the product of number of steps and step size at fast end.
Modulation of Structural Dynamics in Aβ1–42 Fibril Growth.
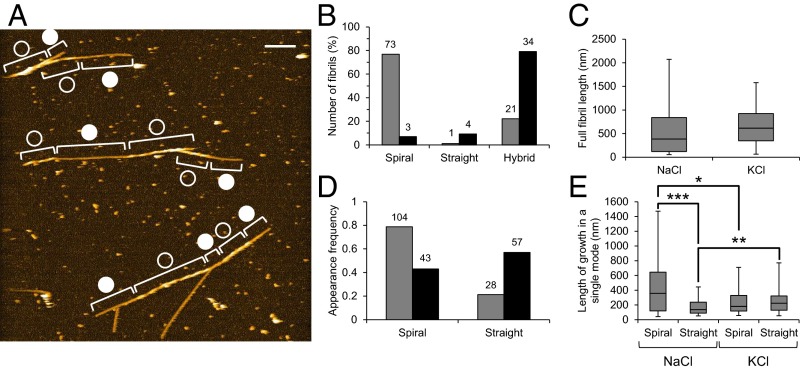
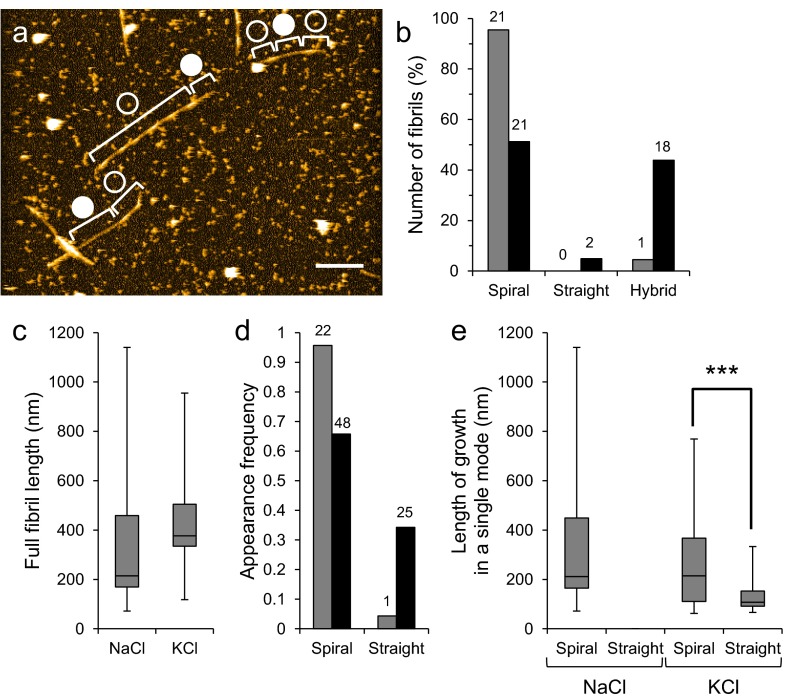
To determine whether the switching of fibril structure growing could be modulated by changes in buffer salt, we substituted 100 mM KCl for NaCl. Potassium ions reduce the interactions between proteins and mica surfaces more than do sodium ions (58). Fig. 4A shows HS-AFM imaging of Aβ1–42 fibrils ∼1 h after addition of KCl. Whereas most fibrils grown in NaCl have the spiral structures, the number of hybrid-type fibrils increased in the presence of KCl (Fig. 4B). This increase could occur due to (i) increase in switching frequency or (ii) increase in speed of fibril growth without change in switching frequency. To determine which of these possibilities was true, we analyzed distributions of the full fibril length, the number of partial fibril segments grown with each growth mode (appearance frequency of growth mode), and the length of those segments (length of growth in a single mode). As shown in Fig. 4C, the distribution of the full fibril length was not significantly altered by the alteration of buffer salt, which suggests that the fibril growth speed was not affected. Meanwhile, the appearance frequency of spiral and straight modes, respectively, decreased and increased with the replacement of NaCl with KCl (Fig. 4D). Consistent with this, the average length of growth in spiral or straight modes decreased or increased, respectively, in the presence of KCl (Fig. 4E). This trend was observed in the different preparation of LMW although we found no statistically significant difference in the length of growth in spiral mode in the preparation (Fig. S7). In conclusion, the switching frequency increased in the KCl buffer whereas the fibril growth mode was constrained to the spiral mode in the NaCl buffer.
Fig. 4.
Electrolyte-dependent kinetics of growth mode switching. (A) HS-AFM image of Aβ1–42 fibrils from LMW incubation incubated in 10 mM phosphate, pH 7.4, 100 mM KCl for ∼1 h. Open and closed circles indicate the spiral and straight regions in fibrils. (Scale bar, 200 nm. Z scale, 15 nm.) (B) Proportion of number of spiral, straight, and hybrid fibril from LMW Aβ1–42 incubation in 10 mM phosphate, pH 7.4 containing 100 mM NaCl (gray) or KCl (black). (C) Distribution of full lengths of fibrils grown in 10 mM phosphate, pH 7.4, 100 mM NaCl or KCl for ∼1 h. (D) Appearance frequencies of spiral and straight growth modes in 10 mM phosphate, pH 7.4 containing 100 mM NaCl (gray) or KCl (black). The numbers of indicated fibrils in the observed area (5.7 × 5.7 μm) are shown on the bars. (E) Distribution of lengths of spiral and straight regions in fibrils grown in the presence of 100 mM KCl or NaCl. Boxes extend from the 25th to 75th percentiles. The line in the box signifies the median. The whiskers are drawn from the minimum to 25th percentile value and from 75th percentile value to the maximum. They do not represent SEs. Asterisks indicate statistical significance between the two groups indicated by brackets (*P < 0.05, **P < 0.01, ***P < 0.001, Brunner–Munzel test).
Fig. S7.
Electrolyte-dependent kinetics of growth mode switching in a different sample preparation. (A) HS-AFM image of Aβ1–42 fibrils from LMW incubation incubated in 10 mM phosphate, pH 7.4, 100 mM KCl for ∼1 h. Open and closed circles indicate the spiral and straight regions in fibrils. (Scale bar, 200 nm. Z scale, 15 nm.) (B) Proportion of number of spiral, straight, and hybrid fibril from LMW Aβ1–42 incubation in 10 mM phosphate, pH 7.4 containing 100 mM NaCl (gray) or KCl (black). (C) Distribution of full lengths of fibrils grown in 10 mM phosphate, pH 7.4, 100 mM NaCl or KCl for ∼1 h. (D) Appearance frequencies of spiral and straight growth modes in 10 mM phosphate, pH 7.4 containing 100 mM NaCl (gray) or KCl (black). The numbers of indicated fibrils in the observed area (5.7 × 5.7 μm) are shown on the bars. (E) Distribution of lengths of spiral and straight regions in fibrils grown in the presence of 100 mM KCl or NaCl. The straight regions whose ends did not reach other fibrils were not observed in the NaCl buffer although the regions whose ends reached other fibrils were counted in D. Boxes extend from the 25th to 75th percentiles. The line in the box signifies the median. The whiskers are drawn from the minimum to 25th percentile value and from 75th percentile value to the maximum. They do not represent SEs. Asterisks indicate statistical significance between the two groups indicated by brackets (***P < 0.001, Brunner–Munzel test).
Discussion
We used HS-AFM to monitor the structural dynamics of Aβ1–42 fibril formation. This approach allowed us to determine morphological and temporal features of this process for specific Aβ1–42 assemblies, including HMW and fibrils. An important finding was a switch in fibril growth mode between “spiral” and “straight” morphomers, even though initial morphologies matched those of the fibril seeds. The frequency of switching was altered by changes in buffer salt. These finding are not consistent with a “dock-lock” model of fibril growth. Switching between morphologies is thought to be extremely rare (essentially nonexistent) when Aβ40 or Aβ42 fibril formation has been studied by TEM. It is possible, therefore, that fibril growth on a mica surface may lead to phenomena that are not observed when fibrils grow freely in solution. However, this finding means that fibril morphology is not absolutely determined by fibril seed structure (nucleus). An implication of this idea is that toxic types of fibrils (seeds) could be converted into nontoxic forms by changes in their cellular or extracellular microenvironments. The converse might also be true.
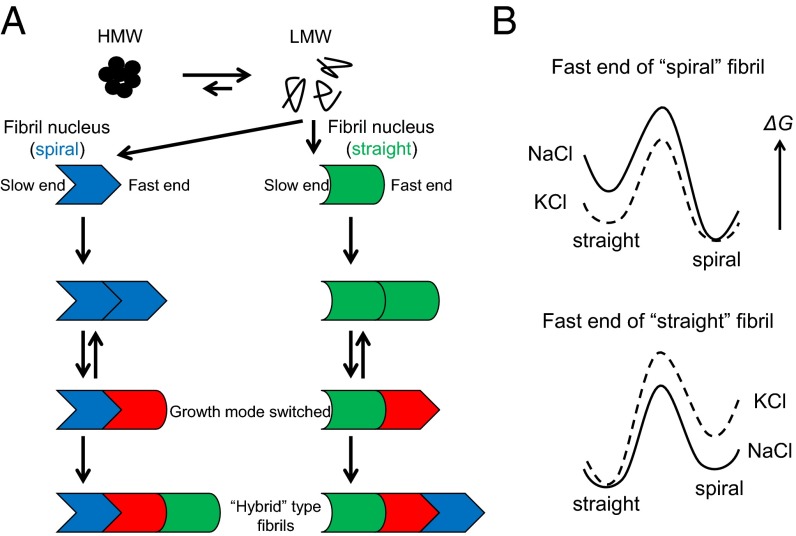
Our results suggest the following model of Aβ1–42 aggregation (Fig. 5). The Aβ1–42 aggregation pathway begins with LMW, including monomeric and low-order oligomer states. It then branches into two distinct pathways: (i) HMW (off-pathway) and (ii) fibril formation via nucleation (on-pathway). Evidence for the first pathway comes from size-exclusion chromatography (SEC) results showing an increase in HMW concentration during LMW incubation (Supporting Information and Fig. S4) and from HS-AFM results revealing that some aggregates do not grow into fibrils (Fig. 1B). Furthermore, HMW incubation did not sustain fibril growth at early phases (∼30 min of incubation) despite rapid production of LMW Aβ1–42 and nucleation rate similar to that of LMW. This difference may be caused by differences in the time when fibril seeds (nuclei) appeared. HMW thus do not appear to be immediate precursors of fibrils, but rather foster fibril formation by dissociation into LMW (Supporting Information and Fig. S4). The nuclei and the fibril seeds grow, incorporating LMW Aβ1–42 monomers or small assemblies formed by LMW Aβ1–42, and the growth rates are different between “fast” and “slow” ends (Fig. 2). This asymmetrical fibril growth is consistent with structural models of Aβ fibrils based on solid-state NMR, in which the two ends of each fibril have different residues available for hydrogen bonding (33). The structure of growing fibrils is typically determined by their seeds [in the context of this discussion, the term “seeds” corresponds to fibril fragments or fibrils themselves. The term “nuclei” refers to the classical thermodynamic structures necessary to initiate a polymerization reaction—in this case by the low-frequency coassociation of LMW Aβ molecules] or nuclei (dock-lock mechanism: the structure of incorporated amyloid proteins is determined by the structure of mother fibril ends). The finding that spiral and straight fibril seeds initially give rise to fibrils of equivalent morphology (Fig. 2 A and B) supports this idea. Aβ1–42 thus produces at least two types of structurally distinct nuclei. The existence of multiple nucleation pathways for one amyloidogenic protein has been reported as described above. Sometimes the growth mode can be switched, which results in the production of “hybrid” fibrils (Fig. 2C).
Fig. 5.
Models for Aβ1–42 aggregation. (A) Monomers give rise to at least three assembly pathways for HMW, straight fibrils and spiral fibrils. HMW is not directly linked to fibril formation. HMW dissociates into LMW. The latter two pathways lead to form nuclei, but the nuclei are different in structure between the pathways. The nuclei incorporate LMW Aβ1–42 and grow into spiral or straight fibrils with the same type as nuclei in the seed-dependent manner. Switching of fibril growth mode sometimes occurs due to dynamic polymorphism of fibril ends, and thus hybrid fibrils are produced. (B) Models of energy profiles for fast ends of spiral- (Top) and straight- (Bottom) type fibrils. For the end of spiral-type fibril, the energy level of spiral state is much lower than the straight state. Thus, the spiral-type fibril grows in the spiral in accordance with the template-dependent manner, and the switching to straight mode rarely occurs in the NaCl buffer (Top, solid line). In the KCl buffer, the energy level of straight state and the activation energy is reduced, which leads to increase in the frequency of switching growth modes (Top, dashed line). For the end of straight-type fibril, the energy level of straight is lower than the spiral state, but the difference in the level between the two states may be smaller than that in the spiral fibril end in the NaCl buffer (Bottom, solid line). Thus, the straight growth mode is short-lived. In the KCl buffer, the energy level of spiral state and the activation energy is shifted up, which leads to retain the growth with straight mode (Bottom, dashed line).
Fibril structural “switching” was an interesting phenomenon that we initially had not expected to observe. It is possible that this occurred due to structural fluctuations at the ends of growing fibrils (59). These spontaneous changes in fibril end structure can be perpetuated by incoming Aβ monomers because these monomers are intrinsically disordered, populate a large volume of conformational space, and thus do not experience substantial energy barriers for binding to fibril ends (60–62). In contrast, the enthalpic and entropic constraints on fibril end structure likely preclude extensive exploration of alternative conformational states, explaining why only two fibril morphologies were observed in our experiment. We note that this fact does not mean other morphologies could not form, only that we did not observe them in the specific experimental system we used. Following our experiments, we learned that dynamic conformational changes in actin filaments also have been observed, supporting the explanation of fibrils switching presented above (63). Additionally, the energy landscape of fibril ends may be altered by the microenvironment (e.g., salt) (Fig. 5B).
Goldsbury et al. reported the results of time-lapse AFM imaging of Aβ1–40 fibril formation (50). We found similarities and differences in structural dynamics between Aβ1–40 and Aβ1–42. Aβ1–40 protofibrils (PF) and mature fibrils (MF) both exhibited straight and spiral (80–130-nm pitch) morphologies (50), similar to Aβ1–42 fibril structures that we observed in the work reported here. MF Aβ1–40 formation through lateral interaction between PFs is not a primary assembly pathway (50). We also did not observe lateral interactions among fibrils. In contrast, Aβ1–40 and Aβ1–42 differed in that formation of spiral and straight Aβ1–40 fibrils occurred at different times, whereas both morphologies were observed concurrently in studies of Aβ1–42. In addition, our finding of bidirectional switching between spiral and straight growth modes of Aβ1–42 has not been reported in any other amyloidogenic protein aggregation.
Materials and Methods
Preparation of Aβ.
Aβ1–42 peptides were synthesized, purified, and characterized as described previously (49). Briefly, the peptide synthesis was performed on an automated peptide synthesizer (model 433A, Applied Biosystems) using 9-fluorenylmethoxycarbonyl-based methods on preloaded Wang resins. The peptides were purified using reverse-phase high-performance liquid chromatography (HPLC). Quantitative amino acid analysis and mass spectrometry of the yielded peptides confirmed the expected compositions and molecular weights, respectively. The purified peptides were stored as lyophilizates at –20 °C. LMW and HMW Aβ were prepared by SEC (49). To prepare LMW and HMW, 200 μL of a 2 mg/mL peptide solution in dimethyl sulfoxide was sonicated for 1 min using a bath sonicator and then centrifuged for 10 min at 16,000 × g. The resulting supernatant was fractionated on a Superdex 75 HR column using 10 mM phosphate buffer, pH 7.4, at a flow rate of 0.5 mL/min. SEC of Aβ1–42 reveals an HMW peak at 16–17 min (occurring just after the column void volume) followed by an LMW peak at 28–29 min. The middles of the HMW and LMW peaks were separately collected during 60 s and stored at –80 °C (Fig. S1A). The peptide concentration in each preparation was determined by Bradford protein assay. Typically, the concentrations of LMW and HMW were 25 and 10 μM, respectively.
HS-AFM Imaging.
Tapping mode HS-AFM (64) was performed at room temperature in liquid with a small cantilever (BL-AC10-DS, Olympus) with a spring constant k ∼ 0.1 N/m and a resonance frequency f = 400–500 kHz. An amorphous carbon tip was grown on the top of each of the cantilevers by electron-beam deposition using a field emission scanning electron microscope (ERA8000-FE, Elionix). The free oscillation amplitude was ∼1.5 nm and the set-point amplitude was 80–90% of the free amplitude. LMW or HMW solutions (2.5 μM peptide concentration in 10 mM phosphate, pH 7.4) were introduced into a sample chamber. Aβ1–42 aggregation reactions were accelerated by addition of NaCl (final concentration of 100 mM). For observation of electrolyte effects, the reactions were accelerated by addition of KCl (final concentration of 100 mM) instead of NaCl. For observation of myricetin effects, 2.5 μM Aβ1–42 [fibril seeds (fAβ1–42):LMW = 1:19] containing 100 mM NaCl and 10 μM myricetin was introduced into the chamber. The HS-AFM image sequences were processed using ImageJ software (imagej.nih.gov/ij/). The total volume of all of the aggregates in each frame was estimated as the total volume of all of the pixels in the frame except background (mica surface). To assess individual fibril growth, the fibrils were computationally straightened and then their structural features, including length and spiral pitch, were measured and analyzed by ImageJ plugins.
SI Materials and Methods
ThT Binding Assay.
The β-sheet content in Aβ1–42 aggregates was measured by ThT fluorescence assay (65). LMW and HMW solutions prepared as described in the main text were diluted in 10 mM phosphate, pH 7.4, containing 100 mM NaCl (phosphate buffer), to a final concentration of 2.5 μM (in terms of monomeric Aβ1–42). Fibril seeds (fAβ1–42) were prepared by sonication of 2.5 μM Aβ1–42 fibrils in phosphate buffer. For the seeding assays, fAβ1–42 or HMW were added to LMW Aβ at a ratio of 0.05 (vol/vol). The mixtures were incubated at 25 °C for 0–5 h without agitation. The reaction mixture contained 5 μM ThT (Wako Chemical Industries Ltd.) and 50 mM glycine-NaOH buffer, pH 8.5. After vortexing briefly, three fluorescence intensity measurements were made every 10 s using a Hitachi F-2500 fluorometer. The excitation and emission wavelengths were 445 and 490 nm, respectively. Fluorescence intensity is presented as the averages of each of the three measurements at each time point, after subtraction of the fluorescence of a blank (no peptide) sample. ThT fluorescence is presented as mean fluorescence units (FU) ± SD.
TEM.
A 10-μL aliquot from each of the aggregation mixtures was spotted onto a glow-discharged, carbon-coated formvar grid (Okenshoji Co. Ltd.) and incubated for 20 min. The droplet was displaced with an equal volume of 2.5% (vol/vol) glutaraldehyde in water followed by incubation for 5 min. Finally, the peptide was stained with 8 μL of 1% (vol/vol) uranyl acetate in water (Wako Chemical Industries Ltd.). This solution was wicked off, and then the grid was air-dried. The samples were observed by a JEM-1210 transmission electron microscope.
Circular Dichroism Spectroscopy.
Circular dichroism (CD) spectra of HMW and LMW were acquired immediately after sample preparation. A 200-μL aliquot from each of the fractions was introduced to a 1-mm-path-length CD cuvette (World Precision Instruments). The CD spectra were measured by a J-805 spectropolarimeter (JASCO). The CD cuvettes were maintained on ice before introduction into the spectrometer. Following temperature equilibration (22 °C), measurement of CD spectra was conducted over a wavelength range of 190–260 nm at 0.2-nm resolution and a scan rate of 100 nm/min. Ten spectra were acquired and averaged for each sample. Raw data were processed by smoothing and subtraction of buffer spectra according to the manufacturer’s instructions.
SI Results
Structural and Assembly Properties of Aβ1–42.
In preparation for HS-AFM studies, we first determined the structural and assembly properties of Aβ1–42 using orthogonal classical methods, including CD spectroscopy, SDS/PAGE, ThT fluorescence, and TEM. To do so, we used SEC to separate Aβ1–42 into LMW and HMW fractions (Fig. S1A). CD studies showed that LMW displayed statistical coil secondary structure, as evidenced by a large magnitude minimum in molar ellipticity centered at ∼198 nm (Fig. S1B). HMW, in contrast, possessed substantial β-sheet structure, the major feature of which was a large magnitude minimum molar ellipticity centered at ∼218 nm. This result was consistent with solid-state NMR studies showing that Aβ assemblies have β-strand-like structures even before protofibrils formed (66). Additionally, in SDS/PAGE and silver staining, LMW showed Aβ1–42 monomer and trimer bands (Fig. S1C). The Aβ1–42 trimer band has been shown to be an SDS-induced artifact (42). HMW existed as mixed bands corresponding in mass to monomeric through pentameric Aβ (Fig. S1C). The SEC, CD, and SDS/PAGE results all were consistent with prior published work (28, 43). The morphologies of the assemblies within the LMW and HMW SEC fractions also were consistent with previously reported structures (Figs. S1 D and E and S2 B and C) (42–44), namely LMW displayed irregular, globular structures that sometimes had thread-like components (Figs. S1D and S2B) and the average diameter of the globular components were 3.7 ± 0.62 nm (n = 20) (45, 46). HMW produced some of short, relatively narrow (∼5 nm) structures displaying periodic substructure reminiscent of beaded strings, consistent with protofibril morphology (Figs. S1E and S2C) (43, 47).
We then used ThT fluorescence to monitor temporal changes in β-sheet content. When fresh LMW, which comprises monomers and low-order oligomers (28), was incubated at 25 °C, fluorescence intensity described a sigmoidal curve that was characterized by a lag time of ∼20 min, a growth phase of ∼160 min, and a plateau phase occurring at ∼180 min (Fig. S2A). When fresh LMW was incubated with fAβ1–42 seeds, the fluorescence increased hyperbolically without a lag phase, reaching a plateau level at ∼90 min (Fig. S2A). The rate of increase in fluorescence was ∼17.5 FU/h. This feature is consistent with a first-order kinetic model (48). In contrast, when fresh LMW was coincubated with HMW instead of fAβ1–42 seeds, the fluorescence intensity curve was similar to that for the incubation of LMW alone (Fig. S2A). These results indicated that HMW did not act as fibril seeds. However, when fresh HMW were incubated alone at 25 °C, the time course of fluorescence intensity resembled that of fresh LMW incubated with fAβ1–42 seeds (Fig. S2A).
Morphological changes in Aβ1–42 aggregates were evident when TEM was used to sample the reactions at different times. LMW formed nonbranched filaments of width ∼8 nm and with varying degrees of helicity after 1 h of incubation (Fig. S2B) (48, 49). In addition, thicker, straight, nonbranched filaments of width ∼12 nm were observed (Fig. S2B). In HMW incubation, we observed small amounts of short fibrils of width ∼5 nm at 1 h (Fig. S2C). HMW appeared to yield fewer fibrils, although the level of fluorescence intensity in ThT binding assay during HMW incubation was higher than that during LMW incubation. However, after 3 h of incubation, the numbers and lengths of fibrils formed from HMW were similar to those observed in LMW (Fig. S2C).
Difference in Fibril Growth and Accumulation Between LMW and HMW Aβ1–42.
Here, we analyzed differences in HS-AFM image sequences of LMW incubation and HMW incubation. As described in the main text, LMW produced fibrils much more than HMW incubation (Fig. 1B and Fig. S3A, and Movies S1 and S2). Instead, HMW mainly accumulated nonfibrillar aggregates (Fig. S3A and Movie S2). Although HMW produced fibrils less than LMW, there were no significant differences in proportion of each fibril morph and in distribution of spiral pitch in the fibrils with spiral structure between LMW and HMW (Fig. S3 B and C). The fibril length of LMW incubation showed a broad distribution, and thus there was no significant difference in fibril lengths between LMW incubation and HMW incubation (Fig. S3D). This situation can be explained by the time when fibril seeds (nuclei) formed. The time course of accumulation of fibril seeds (Fig. S3E) and distribution of the time when fibril seeds appeared (Fig. S3F) show that LMW developed fibril seeds at various times while HMW did from 20 to 30 min onward. Meanwhile, there were no significant differences in the nucleated-fibril accumulation speed and in the seed size between LMW and HMW (Fig. S3 G and H). These analyses suggest that LMW produced fibril nuclei at various times through primary and secondary nucleation reaction to exhibit the broad distributions of fibril length and time when fibril seeds appeared, whereas HMW did not directly develop fibril seeds, first dissociated to LMW, and then produced them. This scheme was supported by observation of HMW dissociation as described below.
We next verified the difference in the stepwise growth between LMW and HMW incubation through statistical analysis of individual fibril growth (Fig. S6 and Table S1). A fast end of fibrils from LMW Aβ thus dwells for ∼36 s before growing 51 nm in length ∼50 s. A fast end of fibrils from HMW dwells for less time, ∼18 s, and then grows at a faster rate (∼33 nm over ∼20 s). We point out, however, that the average number of steps during the first hour of observation of HMW is less than that for LMW because the HMW often have long dwell times, especially at the stages of initial attachment to the substrate and at the end of the observation period. We do not consider these two stages because the dwell start and end times could not be determined. From the product of number of steps and step size, estimated mean growth lengths at fast ends during LMW and HMW incubation, estimated by calculating the product of mean number of steps and mean step size, were 185 and 98 nm, respectively. These values are consistent with the actual mean fibril length during LMW and HMW incubation (Fig. S3D).
Video Imaging of Dissociation of Aβ1–42 Aggregates in HMW Incubation.
To reveal the dynamics of the aggregates in the HMW incubation, we performed a macroscopic assay using SEC and a microscopic analysis of the single aggregates observed in HS-AFM videos. Fig. S4 A and B shows the chromatograms for SEC of the HMW and LMW solutions at the indicated incubation time. During the first hour of HMW incubation, the HMW peak (at ∼16 min) decreases and the LMW peak increases, which was followed by decrease in the LMW peak and a slight increase in the HMW peak (Fig. S4A). This result suggests, as would be predicted (28, 43), that immediately after their isolation in an SEC fraction, HMW dissociate to reestablish equilibrium with monomers and low-order oligomers. This process then is followed by fibril formation, which is not detected by SEC. Incubation of the isolated LMW fraction produced a monotonic decrease in monomer peak size and a corresponding increase in HMW peak size (Fig. S4B). The SEC analysis (Fig. S4 A and B) and HS-AFM observation of LMW and HMW incubation reactions (Fig. 1 and Fig. S3) suggests that LMW aggregates into HMW and fibrils, but HMW do not directly form fibrils.
In the HS-AFM videos, three types of assemblies were observed during HMW incubation: type I, which gradually decreased in height, reaching constant heights (Fig. S4 C and D and Movie S3); type II, which maintained constant sizes (Fig. S4 E and F and Movie S4); and type III, which showed abrupt (stepwise) decreases in their size, possibly due to mechanical damage by the HS-AFM tip (Fig. S4G). We found that aggregate dissociation would be fitted to a single exponential function:
where h(t), hv0, k, and hc correspond to the height of each aggregate at time t, the initial height of the dissociating region of each aggregate, the apparent dissociation constant for the dissociating region, and the height of the stable region of each aggregate (Fig. S4D), respectively. In this model, the aggregates are assumed to be composed of at least two parts with distinct dissociation constants. One part dissociates within 1 h (fast part), but another is relatively stable and maintains a constant height for 1 h (slow part). By fitting the individual time courses with the equation, we obtained the median value of k = 0.042/min and hc = 7.70 nm (dashed line in Fig. S4D). There are at least two possibilities for the relationship between type I and II aggregates: (i) type I and II are distinct or (ii) type II corresponds to the slow dissociating part of type I. The part corresponding to the fast dissociating region of type I may have already dissociated before the aggregates appeared on the observation field, which may be classified as type II.
The type I HMW Aβ1–42 produces LMW by rapid dissociation of the fast dissociating part. The slow dissociating part may also produce LMW in the long run. Therefore, in the HMW, the fibril formation is delayed compared with LMW incubation.
Assessment of Correlation of Conventional Bulk Phase Assays with HS-AFM Observation.
We analyzed the time evolution of the total volume of all aggregates (Fig. S3I). The total aggregate volume increased during HMW incubation more than during LMW incubation. This feature was consistent with the result of ThT binding assay (Fig. S2A), which suggests the cross-β-sheet content corresponds to the total volume of the aggregates. In addition, HS-AFM visualized that reversible inhibition of the fibril growth by a polyphenolic compound, myricetin as described below (Fig. S5). These results indicated that the events in HS-AFM observation corresponded to the bulk phase assays.
Video Imaging of Effects of Myricetin on Aβ1–42 Fibril Assembly.
We previously used ThT fluorescence assays and TEM to demonstrate that the polyphenol myricetin could destabilize Aβ fibrils (48). Here, to directly visualize the dynamics of this process, we used HS-AFM to monitor Aβ1–42 fibril formation in the absence or presence of myricetin. The experiment was performed under conditions identical to those used for ThT assays. A solution of seeded 2.5 μM Aβ1–42 (LMW:fAβ1–42 seed ratio = 19:1), containing 100 mM NaCl, was prepared with or without 10 μM myricetin and then was introduced into the HS-AFM instrument. We observed that the rapid, fibril seed-dependent increase in β-sheet content observed in the absence of myrcetin was inhibited in its presence (Fig. S5A). As shown in Fig. S5B, short fibrils accumulated on the mica, but very few fibrils elongated. However, when the solution bathing the mica was replaced with a solution containing fresh Aβ1–42 and no myricetin, rapid elongation of the preexistent fibrils was observed (Fig. S5C). These results show that myricetin can inhibit fibril growth and that this effect is reversible.
Supplementary Material
Acknowledgments
We thank Dr. Noriyuki Kodera, Dr. Hiroki Konno, Prof. Takayuki Uchihashi, and Prof. Toshio Ando (Kanazawa University) for their help in operating HS-AFM, and the anonymous reviewers for comments on earlier version of this paper. This work has been supported by Scientific Research (C) (26461266) (to K.O.) from the Japanese Ministry of Education, Culture, Sports, Science and Technology, Japan; Novartis Foundation for Gerontological Research (K.O.); Takeda Science Foundation (K.O.); NIH Grant AG041295 (to D.B.T.); Grants-in-Aid for Scientific Research (B) (20390242) (to M.Y.) and for Challenging Exploratory Research (15K15336) (to M.Y.) from the Ministry of Education, Culture, Sports, Science, and Technology, Japan; a grant for Amyloidosis Research Committee from the Ministry of Health, Labour and Welfare, Japan (to M.Y.); and a grant for SENSHIN Medical Research Foundation (to M.Y.).
Footnotes
The authors declare no conflict of interest.
This article is a PNAS Direct Submission.
This article contains supporting information online at www.pnas.org/lookup/suppl/doi:10.1073/pnas.1524807113/-/DCSupplemental.
References
- 1.LaFerla FM, Green KN, Oddo S. Intracellular amyloid-β in Alzheimer’s disease. Nat Rev Neurosci. 2007;8(7):499–509. doi: 10.1038/nrn2168. [DOI] [PubMed] [Google Scholar]
- 2.Hubin E, van Nuland NA, Broersen K, Pauwels K. Transient dynamics of Aβ contribute to toxicity in Alzheimer’s disease. Cell Mol Life Sci. 2014;71(18):3507–3521. doi: 10.1007/s00018-014-1634-z. [DOI] [PMC free article] [PubMed] [Google Scholar]
- 3.Abelein A, et al. The hairpin conformation of the amyloid β peptide is an important structural motif along the aggregation pathway. J Biol Inorg Chem. 2014;19(4-5):623–634. doi: 10.1007/s00775-014-1131-8. [DOI] [PubMed] [Google Scholar]
- 4.Weissmann C. The state of the prion. Nat Rev Microbiol. 2004;2(11):861–871. doi: 10.1038/nrmicro1025. [DOI] [PubMed] [Google Scholar]
- 5.Aguzzi A, Heikenwalder M, Polymenidou M. Insights into prion strains and neurotoxicity. Nat Rev Mol Cell Biol. 2007;8(7):552–561. doi: 10.1038/nrm2204. [DOI] [PubMed] [Google Scholar]
- 6.Mead S, Reilly MM. A new prion disease: Relationship with central and peripheral amyloidoses. Nat Rev Neurol. 2015;11(2):90–97. doi: 10.1038/nrneurol.2014.263. [DOI] [PubMed] [Google Scholar]
- 7.Prusiner SB. Prions. Proc Natl Acad Sci USA. 1998;95(23):13363–13383. doi: 10.1073/pnas.95.23.13363. [DOI] [PMC free article] [PubMed] [Google Scholar]
- 8.Goedert M. Alpha-synuclein and neurodegenerative diseases. Nat Rev Neurosci. 2001;2(7):492–501. doi: 10.1038/35081564. [DOI] [PubMed] [Google Scholar]
- 9.Maries E, Dass B, Collier TJ, Kordower JH, Steece-Collier K. The role of α-synuclein in Parkinson’s disease: Insights from animal models. Nat Rev Neurosci. 2003;4(9):727–738. doi: 10.1038/nrn1199. [DOI] [PubMed] [Google Scholar]
- 10.Irwin DJ, Lee VM-Y, Trojanowski JQ. Parkinson’s disease dementia: Convergence of α-synuclein, tau and amyloid-β pathologies. Nat Rev Neurosci. 2013;14(9):626–636. doi: 10.1038/nrn3549. [DOI] [PMC free article] [PubMed] [Google Scholar]
- 11.Lee H-J, Bae E-J, Lee S-J. Extracellular α--synuclein-a novel and crucial factor in Lewy body diseases. Nat Rev Neurol. 2014;10(2):92–98. doi: 10.1038/nrneurol.2013.275. [DOI] [PubMed] [Google Scholar]
- 12.Cattaneo E, Zuccato C, Tartari M. Normal huntingtin function: An alternative approach to Huntington’s disease. Nat Rev Neurosci. 2005;6(12):919–930. doi: 10.1038/nrn1806. [DOI] [PubMed] [Google Scholar]
- 13.Terry RD, et al. Physical basis of cognitive alterations in Alzheimer’s disease: Synapse loss is the major correlate of cognitive impairment. Ann Neurol. 1991;30(4):572–580. doi: 10.1002/ana.410300410. [DOI] [PubMed] [Google Scholar]
- 14.Hsia AY, et al. Plaque-independent disruption of neural circuits in Alzheimer’s disease mouse models. Proc Natl Acad Sci USA. 1999;96(6):3228–3233. doi: 10.1073/pnas.96.6.3228. [DOI] [PMC free article] [PubMed] [Google Scholar]
- 15.Giannakopoulos P, Hof PR, Michel JP, Guimon J, Bouras C. Cerebral cortex pathology in aging and Alzheimer’s disease: A quantitative survey of large hospital-based geriatric and psychiatric cohorts. Brain Res Brain Res Rev. 1997;25(2):217–245. doi: 10.1016/s0165-0173(97)00023-4. [DOI] [PubMed] [Google Scholar]
- 16.Villemagne VL, et al. Longitudinal assessment of Aβ and cognition in aging and Alzheimer disease. Ann Neurol. 2011;69(1):181–192. doi: 10.1002/ana.22248. [DOI] [PMC free article] [PubMed] [Google Scholar]
- 17.Aizenstein HJ, et al. Frequent amyloid deposition without significant cognitive impairment among the elderly. Arch Neurol. 2008;65(11):1509–1517. doi: 10.1001/archneur.65.11.1509. [DOI] [PMC free article] [PubMed] [Google Scholar]
- 18.Klein WL, Stine WB, Jr, Teplow DB. Small assemblies of unmodified amyloid beta-protein are the proximate neurotoxin in Alzheimer’s disease. Neurobiol Aging. 2004;25(5):569–580. doi: 10.1016/j.neurobiolaging.2004.02.010. [DOI] [PubMed] [Google Scholar]
- 19.Walsh DM, Selkoe DJ. A beta oligomers - a decade of discovery. J Neurochem. 2007;101(5):1172–1184. doi: 10.1111/j.1471-4159.2006.04426.x. [DOI] [PubMed] [Google Scholar]
- 20.Krafft GA, Klein WL. ADDLs and the signaling web that leads to Alzheimer’s disease. Neuropharmacology. 2010;59(4-5):230–242. doi: 10.1016/j.neuropharm.2010.07.012. [DOI] [PubMed] [Google Scholar]
- 21.Lesné S, et al. A specific amyloid-beta protein assembly in the brain impairs memory. Nature. 2006;440(7082):352–357. doi: 10.1038/nature04533. [DOI] [PubMed] [Google Scholar]
- 22.Noguchi A, et al. Isolation and characterization of patient-derived, toxic, high mass amyloid beta-protein (Abeta) assembly from Alzheimer disease brains. J Biol Chem. 2009;284(47):32895–32905. doi: 10.1074/jbc.M109.000208. [DOI] [PMC free article] [PubMed] [Google Scholar]
- 23.Selkoe DJ. Soluble oligomers of the amyloid beta-protein impair synaptic plasticity and behavior. Behav Brain Res. 2008;192(1):106–113. doi: 10.1016/j.bbr.2008.02.016. [DOI] [PMC free article] [PubMed] [Google Scholar]
- 24.Chimon S, et al. Evidence of fibril-like β-sheet structures in a neurotoxic amyloid intermediate of Alzheimer’s β-amyloid. Nat Struct Mol Biol. 2007;14(12):1157–1164. doi: 10.1038/nsmb1345. [DOI] [PubMed] [Google Scholar]
- 25.Deshpande A, Mina E, Glabe C, Busciglio J. Different conformations of amyloid beta induce neurotoxicity by distinct mechanisms in human cortical neurons. J Neurosci. 2006;26(22):6011–6018. doi: 10.1523/JNEUROSCI.1189-06.2006. [DOI] [PMC free article] [PubMed] [Google Scholar]
- 26.Petkova AT, et al. Self-propagating, molecular-level polymorphism in Alzheimer’s beta-amyloid fibrils. Science. 2005;307(5707):262–265. doi: 10.1126/science.1105850. [DOI] [PubMed] [Google Scholar]
- 27.Qiang W, Yau W-M, Luo Y, Mattson MP, Tycko R. Antiparallel β-sheet architecture in Iowa-mutant β-amyloid fibrils. Proc Natl Acad Sci USA. 2012;109(12):4443–4448. doi: 10.1073/pnas.1111305109. [DOI] [PMC free article] [PubMed] [Google Scholar]
- 28.Walsh DM, et al. Amyloid beta-protein fibrillogenesis. Structure and biological activity of protofibrillar intermediates. J Biol Chem. 1999;274(36):25945–25952. doi: 10.1074/jbc.274.36.25945. [DOI] [PubMed] [Google Scholar]
- 29.Cameron B, Landreth GE. Inflammation, microglia, and Alzheimer’s disease. Neurobiol Dis. 2010;37(3):503–509. doi: 10.1016/j.nbd.2009.10.006. [DOI] [PMC free article] [PubMed] [Google Scholar]
- 30.Glass CK, Saijo K, Winner B, Marchetto MC, Gage FH. Mechanisms underlying inflammation in neurodegeneration. Cell. 2010;140(6):918–934. doi: 10.1016/j.cell.2010.02.016. [DOI] [PMC free article] [PubMed] [Google Scholar]
- 31.Sultana R, Perluigi M, Butterfield DA. Oxidatively modified proteins in Alzheimer’s disease (AD), mild cognitive impairment and animal models of AD: Role of Abeta in pathogenesis. Acta Neuropathol. 2009;118(1):131–150. doi: 10.1007/s00401-009-0517-0. [DOI] [PMC free article] [PubMed] [Google Scholar]
- 32.Tõugu V, Tiiman A, Palumaa P. Interactions of Zn(II) and Cu(II) ions with Alzheimer’s amyloid-beta peptide. Metal ion binding, contribution to fibrillization and toxicity. Metallomics. 2011;3(3):250–261. doi: 10.1039/c0mt00073f. [DOI] [PubMed] [Google Scholar]
- 33.Lu J-X, et al. Molecular structure of β-amyloid fibrils in Alzheimer’s disease brain tissue. Cell. 2013;154(6):1257–1268. doi: 10.1016/j.cell.2013.08.035. [DOI] [PMC free article] [PubMed] [Google Scholar]
- 34.Roychaudhuri R, Yang M, Hoshi MM, Teplow DB. Amyloid β-protein assembly and Alzheimer disease. J Biol Chem. 2009;284(8):4749–4753. doi: 10.1074/jbc.R800036200. [DOI] [PMC free article] [PubMed] [Google Scholar]
- 35.Tycko R, Wickner RB. Molecular structures of amyloid and prion fibrils: Consensus versus controversy. Acc Chem Res. 2013;46(7):1487–1496. doi: 10.1021/ar300282r. [DOI] [PMC free article] [PubMed] [Google Scholar]
- 36.Tycko R. Physical and structural basis for polymorphism in amyloid fibrils. Protein Sci. 2014;23(11):1528–1539. doi: 10.1002/pro.2544. [DOI] [PMC free article] [PubMed] [Google Scholar]
- 37.Meyer-Luehmann M, et al. Exogenous induction of cerebral beta-amyloidogenesis is governed by agent and host. Science. 2006;313(5794):1781–1784. doi: 10.1126/science.1131864. [DOI] [PubMed] [Google Scholar]
- 38.Watts JC, et al. Serial propagation of distinct strains of Aβ prions from Alzheimer’s disease patients. Proc Natl Acad Sci USA. 2014;111(28):10323–10328. doi: 10.1073/pnas.1408900111. [DOI] [PMC free article] [PubMed] [Google Scholar]
- 39.Cohen ML, et al. Rapidly progressive Alzheimer’s disease features distinct structures of amyloid-β. Brain. 2015;138(Pt 4):1009–1022. doi: 10.1093/brain/awv006. [DOI] [PMC free article] [PubMed] [Google Scholar]
- 40.Ando T, et al. A high-speed atomic force microscope for studying biological macromolecules. Proc Natl Acad Sci USA. 2001;98(22):12468–12472. doi: 10.1073/pnas.211400898. [DOI] [PMC free article] [PubMed] [Google Scholar]
- 41.Ando T, Uchihashi T, Kodera N. High-speed AFM and applications to biomolecular systems. Annu Rev Biophys. 2013;42:393–414. doi: 10.1146/annurev-biophys-083012-130324. [DOI] [PubMed] [Google Scholar]
- 42.Bitan G, et al. Amyloid β -protein (Abeta) assembly: Abeta 40 and Abeta 42 oligomerize through distinct pathways. Proc Natl Acad Sci USA. 2003;100(1):330–335. doi: 10.1073/pnas.222681699. [DOI] [PMC free article] [PubMed] [Google Scholar]
- 43.Walsh DM, Lomakin A, Benedek GB, Condron MM, Teplow DB. Amyloid β-protein fibrillogenesis. Detection of a protofibrillar intermediate. J Biol Chem. 1997;272(35):22364–22372. doi: 10.1074/jbc.272.35.22364. [DOI] [PubMed] [Google Scholar]
- 44.Teplow DB. Preparation of amyloid beta-protein for structural and functional studies. Methods Enzymol. 2006;413(06):20–33. doi: 10.1016/S0076-6879(06)13002-5. [DOI] [PubMed] [Google Scholar]
- 45.Ono K, Condron MM, Teplow DB. Effects of the English (H6R) and Tottori (D7N) familial Alzheimer disease mutations on amyloid β-protein assembly and toxicity. J Biol Chem. 2010;285(30):23186–23197. doi: 10.1074/jbc.M109.086496. [DOI] [PMC free article] [PubMed] [Google Scholar]
- 46.Ono K, Condron MM, Teplow DB. Structure-neurotoxicity relationships of amyloid β-protein oligomers. Proc Natl Acad Sci USA. 2009;106(35):14745–14750. doi: 10.1073/pnas.0905127106. [DOI] [PMC free article] [PubMed] [Google Scholar]
- 47.Harper JD, Lansbury PT., Jr Models of amyloid seeding in Alzheimer’s disease and scrapie: Mechanistic truths and physiological consequences of the time-dependent solubility of amyloid proteins. Annu Rev Biochem. 1997;66:385–407. doi: 10.1146/annurev.biochem.66.1.385. [DOI] [PubMed] [Google Scholar]
- 48.Ono K, et al. Potent anti-amyloidogenic and fibril-destabilizing effects of polyphenols in vitro: Implications for the prevention and therapeutics of Alzheimer’s disease. J Neurochem. 2003;87(1):172–181. doi: 10.1046/j.1471-4159.2003.01976.x. [DOI] [PubMed] [Google Scholar]
- 49.Ono K, et al. Effects of grape seed-derived polyphenols on amyloid β-protein self-assembly and cytotoxicity. J Biol Chem. 2008;283(47):32176–32187. doi: 10.1074/jbc.M806154200. [DOI] [PMC free article] [PubMed] [Google Scholar]
- 50.Goldsbury C, Frey P, Olivieri V, Aebi U, Müller SA. Multiple assembly pathways underlie amyloid-β fibril polymorphisms. J Mol Biol. 2005;352(2):282–298. doi: 10.1016/j.jmb.2005.07.029. [DOI] [PubMed] [Google Scholar]
- 51.Cohen SIA, et al. Proliferation of amyloid-β42 aggregates occurs through a secondary nucleation mechanism. Proc Natl Acad Sci USA. 2013;110(24):9758–9763. doi: 10.1073/pnas.1218402110. [DOI] [PMC free article] [PubMed] [Google Scholar]
- 52.Meisl G, et al. Differences in nucleation behavior underlie the contrasting aggregation kinetics of the Aβ40 and Aβ42 peptides. Proc Natl Acad Sci USA. 2014;111(26):9384–9389. doi: 10.1073/pnas.1401564111. [DOI] [PMC free article] [PubMed] [Google Scholar]
- 53.Qiang W, Kelley K, Tycko R. Polymorph-specific kinetics and thermodynamics of β-amyloid fibril growth. J Am Chem Soc. 2013;135(18):6860–6871. doi: 10.1021/ja311963f. [DOI] [PMC free article] [PubMed] [Google Scholar]
- 54.Kellermayer MSZ, Karsai A, Benke M, Soós K, Penke B. Stepwise dynamics of epitaxially growing single amyloid fibrils. Proc Natl Acad Sci USA. 2008;105(1):141–144. doi: 10.1073/pnas.0704305105. [DOI] [PMC free article] [PubMed] [Google Scholar]
- 55.Ban T, et al. Direct observation of Abeta amyloid fibril growth and inhibition. J Mol Biol. 2004;344(3):757–767. doi: 10.1016/j.jmb.2004.09.078. [DOI] [PubMed] [Google Scholar]
- 56.Ferkinghoff-Borg J, et al. Stop-and-go kinetics in amyloid fibrillation. Phys Rev E Stat Nonlin Soft Matter Phys. 2010;82(1 Pt 1):010901. doi: 10.1103/PhysRevE.82.010901. [DOI] [PubMed] [Google Scholar]
- 57.Esler WP, et al. Alzheimer’s disease amyloid propagation by a template-dependent dock-lock mechanism. Biochemistry. 2000;39(21):6288–6295. doi: 10.1021/bi992933h. [DOI] [PubMed] [Google Scholar]
- 58.Czajkowsky DM, Shao Z. Inhibition of protein adsorption to muscovite mica by monovalent cations. J Microsc. 2003;211(Pt 1):1–7. doi: 10.1046/j.1365-2818.2003.01208.x. [DOI] [PubMed] [Google Scholar]
- 59.Kusumoto Y, Lomakin A, Teplow DB, Benedek GB. Temperature dependence of amyloid β-protein fibrillization. Proc Natl Acad Sci USA. 1998;95(21):12277–12282. doi: 10.1073/pnas.95.21.12277. [DOI] [PMC free article] [PubMed] [Google Scholar]
- 60.Zhang S, et al. The Alzheimer’s peptide a β adopts a collapsed coil structure in water. J Struct Biol. 2000;130(2-3):130–141. doi: 10.1006/jsbi.2000.4288. [DOI] [PubMed] [Google Scholar]
- 61.Riek R, Güntert P, Döbeli H, Wipf B, Wüthrich K. NMR studies in aqueous solution fail to identify significant conformational differences between the monomeric forms of two Alzheimer peptides with widely different plaque-competence, A β(1-40)(ox) and A β(1-42)(ox) Eur J Biochem. 2001;268(22):5930–5936. doi: 10.1046/j.0014-2956.2001.02537.x. [DOI] [PubMed] [Google Scholar]
- 62.Hou L, et al. Solution NMR studies of the A β(1-40) and A β(1-42) peptides establish that the Met35 oxidation state affects the mechanism of amyloid formation. J Am Chem Soc. 2004;126(7):1992–2005. doi: 10.1021/ja036813f. [DOI] [PubMed] [Google Scholar]
- 63.Kozuka J, Yokota H, Arai Y, Ishii Y, Yanagida T. Dynamic polymorphism of single actin molecules in the actin filament. Nat Chem Biol. 2006;2(2):83–86. doi: 10.1038/nchembio763. [DOI] [PubMed] [Google Scholar]
- 64.Uchihashi T, Kodera N, Ando T. Guide to video recording of structure dynamics and dynamic processes of proteins by high-speed atomic force microscopy. Nat Protoc. 2012;7(6):1193–1206. doi: 10.1038/nprot.2012.047. [DOI] [PubMed] [Google Scholar]
- 65.LeVine H., 3rd Thioflavine T interaction with synthetic Alzheimer’s disease β-amyloid peptides: Detection of amyloid aggregation in solution. Protein Sci. 1993;2(3):404–410. doi: 10.1002/pro.5560020312. [DOI] [PMC free article] [PubMed] [Google Scholar]
- 66.Potapov A, Yau W-M, Ghirlando R, Thurber KR, Tycko R. Successive stages of amyloid-β self-assembly characterized by solid-state nuclear magnetic resonance with dynamic nuclear polarization. J Am Chem Soc. 2015;137(25):8294–8307. doi: 10.1021/jacs.5b04843. [DOI] [PMC free article] [PubMed] [Google Scholar]
Associated Data
This section collects any data citations, data availability statements, or supplementary materials included in this article.


