

Significance
The importance of natural killer (NK) cells in the control of autoimmunity has recently attracted considerable attention. The current study revealed NK cells as additional players in controlling T-cell activity in CNS autoimmunity. NK-mediated control of T-cell activity in multiple sclerosis (MS) is dysregulated and caused by impaired DNAX accessory molecule-1/CD155 interaction between NK cells and CD4+ T cells. Therapeutic immune modulation of the IL-2 receptor with daclizumab, which has just successfully passed a phase III study in relapsing-remitting MS, not only enhances the cytolytic activity of NK cells but also restores defective NK-mediated immune regulation by increasing the proportion of CD155-expressing CD4+ T cells, thus rendering CD4+ T cells most likely more sensitive to NK-mediated lysis.
Keywords: multiple sclerosis, NK cells, daclizumab, DNAM-1, IL-2 receptor
Abstract
Multiple sclerosis (MS) is a chronic inflammatory autoimmune disease of the central nervous system (CNS) resulting from a breakdown in peripheral immune tolerance. Although a beneficial role of natural killer (NK)-cell immune-regulatory function has been proposed, it still needs to be elucidated whether NK cells are functionally impaired as part of the disease. We observed NK cells in active MS lesions in close proximity to T cells. In accordance with a higher migratory capacity across the blood–brain barrier, CD56bright NK cells represent the major intrathecal NK-cell subset in both MS patients and healthy individuals. Investigating the peripheral blood and cerebrospinal fluid of MS patients treated with natalizumab revealed that transmigration of this subset depends on the α4β1 integrin very late antigen (VLA)-4. Although no MS-related changes in the migratory capacity of NK cells were observed, NK cells derived from patients with MS exhibit a reduced cytolytic activity in response to antigen-activated CD4+ T cells. Defective NK-mediated immune regulation in MS is mainly attributable to a CD4+ T-cell evasion caused by an impaired DNAX accessory molecule (DNAM)-1/CD155 interaction. Both the expression of the activating NK-cell receptor DNAM-1, a genetic alteration consistently found in MS-association studies, and up-regulation of the receptor’s ligand CD155 on CD4+ T cells are reduced in MS. Therapeutic immune modulation of IL-2 receptor restores impaired immune regulation in MS by increasing the proportion of CD155-expressing CD4+ T cells and the cytolytic activity of NK cells.
Multiple sclerosis (MS) is a chronic inflammatory demyelinating autoimmune disease of the central nervous system (CNS) (1) and one of the major causes of neurological disability in young adults (2). MS is considered to be a primarily antigen-driven T cell-mediated disease with a complex genetic background influenced by environmental factors (1, 3) that is caused by an imbalanced immune-regulatory network (4). Among other well-known players of this network such as regulatory T cells and tolerogenic dendritic cells (DCs) (1), natural killer (NK) cells have been recently identified as additional factors in controlling homeostasis of antigen-activated T cells (5, 6).
Originally discovered as antigen receptor-negative innate lymphocytes that play an important role in controlling virus-infected and tumor cells (7), NK cells have also been shown to suppress activated T cells through secretion of anti-inflammatory cytokines and/or cytolytic function (5, 6, 8–12). NK cells lyse target cells in a complex process depending on cell surface expression of certain inhibitory and activating receptors on NK cells and the corresponding ligands on target cells (13). Several activating NK-cell receptors–in particular, NKG2D (CD314) (5, 8, 9, 11, 14), the receptor for MIC-A/B and ULBP1-6, and DNAM-1 (DNAX accessory molecule, CD226) (6, 12, 15), the receptor for Nectin-2 (CD112) and poliovirus receptor (PVR/CD155)−have been proposed to be involved in NK cell-mediated lysis of activated T cells. Of note, polymorphisms in the gene encoding for DNAM-1 have been consistently found in MS-association studies (16–18). Both major NK-cell subsets, namely the CD56brightCD16dim/− and the CD56dimCD16+ subsets (here referred to as CD56bright and CD56dim, respectively), seem to be capable of killing activated T cells (19). CD56dim NK cells are the major NK-cell subset in the peripheral blood (PB) (90% of NK cells) and kill target cells without prior sensitization but only secrete low levels of cytokines (7, 20, 21), whereas CD56bright NK cells are more abundant in secondary lymphoid tissues and inflammatory lesions (75–95% of NK cells), where they produce high amounts of immune-modulating cytokines but acquire cytolytic functions only after prolonged activation (7, 20, 21).
Immune-modulating therapies targeting NK-cell frequencies and cytolytic functions among others such as IFN-β (22–24), glatiramer acetate (25), natalizumab (26, 27), fingolimod (28, 29), and daclizumab (10, 30, 31) point to an immune-protective role of both NK-cell subsets in MS. Daclizumab, a humanized antibody directed against the IL-2 receptor (IL-2R) α-chain (CD25) (reviewed in ref. 4) is a promising MS therapy, which recently showed superior efficacy compared with IFN-β in a phase III study (32). Expansion of peripheral (10, 33) as well as intrathecal (34) CD56bright NK cells under daclizumab treatment correlated positively with therapeutic response (10, 30, 35). Nevertheless, it still remains to be elucidated whether NK-cell immune-regulatory functions are impaired as part of the disease process and whether modulation of the IL-2R with daclizumab restores these deficits or simply boosts NK-cell activity (4). Furthermore, the distribution and function of NK cells in active MS lesions is still poorly understood. Resolving the molecular basis of NK cell-mediated immune control and its potential impairment in MS is important for a better understanding of the role of NK cells in MS pathogenesis and the mechanism of action of NK cell-modulating therapies.
The aim of the current study was to characterize the role of NK cells in the pathogenesis of MS by investigating the presence, distribution, and function of NK cells in three different compartments [CNS, cerebrospinal fluid (CSF), and PB]. Furthermore, a potential deficit in NK-cell immune-regulatory function, its underlying molecular mechanism, and the impact of IL-2R modulation by daclizumab high-yield process (DAC HYP) were explored by studying PB mononuclear cells (PBMCs) derived from clinically stable therapy-naïve MS patients and MS patients receiving daclizumab treatment in comparison with those derived from healthy individuals.
Results
Granzyme K-Expressing NK Cells Are Found in Close Proximity to T Cells in Active MS Lesions.
To elucidate distribution and function of NK cells in actively demyelinating MS lesions, immunohistochemistry in CNS tissue specimens was performed (Fig. 1). Actively demyelinating lesion areas were located at the plaque border. These areas were partially demyelinated and infiltrated by numerous macrophages containing myelin-degradation products within their cytoplasm, indicating ongoing demyelination (Fig. 1A). Immunohistochemistry for anti-neurofilament revealed relatively preserved axons (Fig. 1B). Whereas in the periplaque gray matter, ramified microglial cells were present, the lesion was infiltrated by numerous foamy macrophages (Fig. 1C) expressing the activation marker MRP14 (Fig. 1D). Within the lesion, multiple vessels with perivascular lymphocyte infiltrates (Fig. 1E) consisting of CD3+ T cells (Fig. 1F) and few CD20+ B cells (Fig. 1G) were found. Strikingly, actively demyelinating MS lesions also contained CD56+ NK cells in close proximity to CD3+ T cells (Fig. 1H, yellow arrows). Granzyme K (GrK), which is mainly expressed in the CD56bright NK-cell subset and has been shown to play an important role in NK-cell immune-regulatory function (31), was expressed in lesion-resident NK cells and polarized toward other immune cells (Fig. 1I, yellow arrows). GrK expression was not exclusively restricted to NK cells, because we also found GrK-expressing CD56− cells within the lesions (Fig. 1I, white arrows). Interestingly, some of the NK cells found in MS lesions also expressed perforin (Fig. S1), another content of cytotoxic granules involved in NK-cell cytotoxicity. In summary, immune-regulatory GrK-expressing NK cells occurred in active MS lesions, where these cells were found in close proximity to T cells, indicating NK/T-cell interactions in human CNS autoimmunity.
Fig. 1.

GrK-expressing NK cells are located in close proximity to T cells in MS lesions. (A) Representative immunohistochemical images of a demyelinating subcortical MS lesion characterized by loss of myelin basic protein. (Inset) A macrophage with MBP-positive degradation products within the cytoplasm indicating ongoing demyelination (anti-MBP). (B) Axons are relatively preserved (anti-neurofilament). (C) The lesion is infiltrated by numerous foamy macrophages, whereas in the periplaque gray matter, ramified microglial cells are present (anti-KiM1P). (D) The intralesional macrophages express the activation marker MRP14 (anti-MRP14). (E) Multiple vessels with perivascular lymphocytic infiltrates within the lesion (H&E staining). (F and G) The perivascular infiltrates consist of CD3+ T cells (F) and few CD20+ B cells (G). (H) CD56+CD3− NK cells (anti-CD56, red) are located in close proximity to CD3+CD56− T cells (anti-CD3, green). (I) GrK (anti-GrK, green) is polarized in CD56+CD3− NK cells (anti-CD56, red). (Scale bars: A–C, 200 µm; D, 25 µm; E, 100 µm; F and G, 75 µm; H and I, 50 µm.) One representative result of three biopsies from MS patients is shown.
Fig. S1.

Expression of CD94, CD8a, and perforin in the CNS of MS patients. Frozen brain sections from MS patients were stained with mouse anti-human CD94 (1:50, HP-3D9; BD Pharmingen), mouse anti-human perforin (1:50, B-D48; Abcam) labeled with the Alexa Fluor 488 monoclonal antibody labeling kit (Invitrogen), and mouse anti-human CD8a (1:50, LT8; ABD Serotec) labeled with the Cy3 MAb labeling kit (GE Healthcare). Briefly, frozen brain sections were thawed at room temperature, fixed with acetone, and after a blocking step for 40 min with 2% (wt/vol) BSA, the antibodies were applied successively starting with anti-CD94 for 1 h at room temperature, which was detected using goat anti-mouse labeled with Alexa Fluor 647 (1:400; Life Technologies). Subsequently anti-perforin and anti-CD8a were applied for 1 h and 30 min, respectively. Staining was visualized using a Zeiss Axioscope microscope. A representative micrograph with triple fluorescence immunohistochemistry of four MS patients identifying brain-infiltrating CD8+ (red) and CD94+ (green) cells expressing perforin (white) is shown. Nuclei are stained with DAPI (blue). (Scale bar, 20 µm.)
Trafficking Capacity of NK Cells Across the Blood–Brain Barrier Is Not Altered in MS Patients.
Expression of GrK in the majority of NK cells located in the CNS (Fig. 1I) hints that CNS-resident NK cells are most likely CD56bright NK cells. To investigate whether a higher occurence of CD56bright NK cells is attributable to differences of the two NK-cell subsets in penetrating the BBB (blood–brain barrier), motility (Fig. 2A and Movies S1 and S2), adhesion (Fig. 2B), and transmigratory capacity (Fig. 2C and Fig. S2) of NK cells were investigated using human brain microvascular endothelial cells (HBMECs). Although both NK-cell subsets expressed similar amounts of the leukocyte function-associated antigen 1 (LFA-1) (also known as CD11α/CD18 and αLβ2 integrin) (Table 1), CD56bright NK cells exhibited a higher motility (Fig. 2A), stronger adhesion (Fig. 2B), and migratory capacity (Fig. 2C, Left) in this in vitro model of the BBB than their CD56dim counterparts. Mimicking inflammatory conditions by stimulating HBMECs with IFN-γ and TNF-α resulted in a stronger adhesion (Fig. 2B) and higher migratory capacity (Fig. 2C, Left) of both NK-cell subsets. Interestingly, NK cells derived from MS patients showed no disease-related alterations in their migratory capacity across the BBB (Fig. 2C, Right). Taken together, our data revealed that CD56bright NK cells exhibited a higher transmigratory capacity across the BBB and that NK-cell transmigratory features were not impaired in MS.
Fig. 2.

CD56bright NK cells exhibit a higher migratory capacity in a human BBB model and are the major intrathecal NK-cell subset. (A) Covered beeline distance per minute of CD56bright (blue triangles) and CD56dim (blue circles) NK cells (n = 3 HDs) during in vitro incubation with primary HBMECs. Mann–Whitney test was used. (B) Conjugate formation of CD56bright (blue triangles) and CD56dim (blue circles) NK cells (n = 4 HDs) with unstimulated and IFN-γ/TNF-α–stimulated HBMECs. Unpaired multiple t test was used. (C) Proportions of migrated NK cells and their subpopulations derived from HDs (blue bars) (Left: n =21; Right: n = 6) or therapy-naïve MS patients (red bars) (n = 5) across unstimulated (filled bars) and stimulated (open bars) HBMECs. Wilcoxon matched-pairs signed rank test (same cell types) and Mann–Whitney test (different cell types/patient groups) were used. (D) Proportions (upper row) and total cell numbers (lower row) of NK cells (Left), CD56bright (Center), and CD56dim (Right) subsets in the PB (closed symbols) and CSF (open symbols) of therapy-naïve MS patients (red triangles down) (n = 67) and MS patients treated with natalizumab (Nat) (n = 17) in comparison with HDs (blue circles) (n = 25). Wilcoxon matched-pairs signed rank test (PB vs. CSF) and Kruskal–Wallis test with Dunn’s posttest (different patient groups) were used. (E) Representative GrK versus CD56 dot plot of CD3−CD56+ NK cells derived from the PB and CSF of therapy-naïve MS patients (Left). Proportions and median fluorescence intensity (MFI) of GrK+ CD56bright and CD56dim NK cells in the PB (closed whiskers) and CSF (open whiskers) of therapy-naïve MS patients (Left) (n = 4) are displayed. Paired Student’s t test was used. Error bars indicate the SD. *P < 0.05; **P < 0.01; ***P < 0.001; ****P < 0.0001.
Fig. S2.

Human BBB model. (Left) Illustration of the human BBB model. (Right) The confluence of the HBMEC monolayer was monitored testing its permeability for Evans Blue, as previously described (73).
Table 1.
Expression of adhesion molecules and chemokine receptors on NK-cell subsets
| Surface molecule | Mean percentage of positive cells ± SD, % (MFI) | |
| CD56bright | CD56dim | |
| CD11a | 99.95 ± 0.15 (14) | 99.99 ± 0.02 (14) |
| CD29 | 100 ± 0.00 (3) | 99.97 ± 0.04 (2) |
| CD49d | 97.06 ± 2.75 (6) | 95.90 ± 3.91 (5) |
| CD146 | 0.00 ± 0.00 (ND) | 0.01 ± 0.02 (ND) |
| CD62-L | 80.66 ± 6.48 (19) | 26.71 ± 8.32 (8) |
| CX3CR1 | 15.56 ± 10.04 (3) | 95.57 ± 7.41 (6) |
| CXCR3 | 74.70 ± 28.38 (29) | 10.50 ± 8.96 (15) |
| CCR6 | 4.89 ± 3.47 (ND) | 1.75 ± 1.91 (ND) |
| CCR7 | 57.44 ± 23.59 (2) | 5.24 ± 6.53 (ND) |
PBMCs of healthy individuals (n = 10) were stained with fluorochrome-conjugated lineage-specific antibodies (CD3, CD56, and CD16), and expression of various adhesion molecules and chemokine receptors was determined on CD56bright and CD56dim NK cells subsets by flow cytometry using the respective fluorochrome-conjugated antibodies. Mean percentage of positive cells ± SD are displayed; MFIs are given in parentheses. ND, not defined.
CSF Distribution Suggests Preferential Very Late Antigen-4–Dependent Trafficking of CD56bright NK Cells into the CNS.
Different transmigratory capacities of NK-cell subsets across the BBB model (Fig. 2C) were reflected by the composition of intrathecal NK cells (Fig. 2D, Upper) that is comparable to that in secondary lymphoid tissues (36). Although the majority of NK cells in the PB were CD56dim NK cells, the major NK-cell subset in the CSF of both healthy individuals and MS patients belonged to the CD56bright NK-cell subset (Fig. 2D, Upper). Proportions of intrathecal NK-cell subsets within the lymphocyte compartment did not differ significantly between MS patients and healthy individuals (Fig. 2D, Upper), whereas MS patients exhibited significantly enhanced numbers of both CD56bright as well as CD56dim NK-cell subsets (Fig. 2D, Lower). Differences in the intrathecal NK-cell composition correlated with distinct expression of certain chemokine receptors (Table 1). Whereas CD56bright NK cells were CD62-L+, CX3CR1−, CXCR3bright, CCR6−, and CCR7+, CD56dimNK cells were CD62-L+/−, CX3CR1+, CXCR3dim, CCR6−, and CCR7− (Table 1). Both NK-cell subsets expressed similar amounts of very late antigen (VLA)-4 [CD49d/CD29, α4β1 integrin (Table 1)], which is involved in transmigration of leukocytes into the CNS (37). Reduced NK-cell frequencies in the CSF of natalizumab-treated (humanized anti-CD49d antibody) patients down to levels of healthy individuals (Fig. 2D, Lower) suggest that transmigration of NK cells into the CNS is VLA-4–dependent. Of note, NK cells were negative for melanoma cell adhesion molecule (MCAM, CD146) (Table 1), which has recently been identified to be involved in an alternative migratory pathway of Th17 cells across the BBB (38). Finally, a higher proportion of intrathecal CD56dim NK cells expressed GrK in comparison with those of the PB (Fig. 2E). In summary, the majority of intrathecal NK cells of both MS patients as well as healthy individuals were GrK-expressing CD56bright NK cells.
Phenotype of Circulating NK Cells Is Altered in MS.
To explore potential MS-related changes in circulating NK cells, PBMCs derived from therapy-naïve MS patients with clinically stable disease course were analyzed using multiparameter flow cytometry and compared with healthy individuals (Fig. 3). Interestingly, we observed that NK-cell frequencies, namely the CD56dim NK-cell subset, were significantly reduced in the periphery of MS patients compared with healthy individuals (Fig. 3A). Although MS patients showed a reduced cell surface expression of NKp44 (CD336, surrogate marker for NK-cell activation) on a single-cell level, higher proportions NKp44-expressing CD56bright NK cells in MS (Fig. 4B) indicated an MS-related activation of this subset. Moreover, lower proportions of IL-2R α-expressing (IL2Rα, CD25) and β-chain–expressing (IL-2Rβ, CD122) (Fig. 3C) cells were also found in this subset. Characterization of different activating NK-cell receptors suggested to be involved in NK cell-mediated immune regulation of activated T cells (39) revealed that on the MS cell surface, expression of DNAM-1 was significantly reduced on both NK-cell subsets, whereas no differences in the NK-cell surface expression of NKG2D was observed (Fig. 3B). Of note, NK cells from MS patients also expressed lower amounts of 2B4 (CD244), an activating coreceptor that either synergizes with DNAM-1 or NKG2D to trigger NK-cell cytotoxicity (40, 41). In contrast to MS-related alterations of certain activating NK-cell receptors, the content of the cytolytic granules including GrK and perforin was comparable between MS patients and healthy individuals (Fig. 3D). Overall, our data showed that MS has an impact on the phenotype of circulating NK cells.
Fig. 3.

MS-related changes in the peripheral NK cell compartment. PBMCs derived from healthy individuals (blue circles) and therapy-naïve MS patients characterized by clinically stable disease course (red triangles down) were stained with fluorochrome-conjugated lineage-specific antibodies (CD3, CD56, and CD16) (A) and antibodies directed against activating NK-cell receptors [NKG2D (HD, n = 32; MS, n = 25), DNAM-1 (HD, n = 28; MS, n = 13), 2B4 (HD, n = 33; MS, n = 25), and NKp44 (HD, n = 33; MS, n = 25)] (B); IL-2Rα (CD25, clone B1.49.9) and IL-2Rβ (CD122) chain (HD, n = 33; MS, n = 25) (C); and the content of cytolytic granules GrK (HD, n = 19; MS, n = 15) and perforin (HD, n = 20; MS, n = 15) (D) and analyzed by flow cytometry. (A) Proportions of CD3−CD56+ NK cells and NK-cell subpopulations (CD56bright and CD56dim) in the PB of HDs (n = 43) and therapy-naïve MS patients (n = 33). (B–D) Percentages (left side) and MFIs (right side) of cell surface receptor-positive (B and C) and GrK- or perforin-positive (D) CD56bright and CD56dim NK cells. Error bars indicate the SD. P values were calculated with Mann–Whitney test. *P < 0.05; **P < 0.01; ****P < 0.0001.
Fig. 4.

Impact of IL-2R modulation on NK-cell cytolytic activity. (A) Experimental setup: CD4+ T cells were isolated from PBMCs of HDs or therapy-naïve stable MS patients stimulated for 4 d with IL-2 with or without SEB. For NK-cell activation, PBMCs of HDs (blue circles) or MS patients (red triangles down) were stimulated for 7 d with IL-2 with or without DAC HYP. Release of cytolytic granules (degranulation) of IL-2–stimulated (closed symbols) or IL-2/DAC HYP-stimulated (open symbols) CD3−CD56+ NK cells in response to K562 (HD, n = 24; MS, n = 22) (B, Left), 721.221 (HD, n = 32; MS, n = 20) (B, Right), and autologous IL-2–stimulated (HD, n = 4; MS, n = 5) (C, Left) or IL-2/SEB-stimulated (HD, n = 38; MS, n = 16) (C, Right) CD4+ target cells was analyzed. (D) Degranulation of resting (black circles) and IL-2–activated (blue circles) NK cells (n = 5 HDs) in response to autologous IL-2/SEB-stimulated CD4+ T cells. (E) PBMCs, NK cells, and NK cells plus DCs (n = 8 HDs) were stimulated for 7 d with IL-2 with or without DAC HYP, and degranulation in response to IL-2/SEB-activated CD4+ target cells was determined. D’Agostino–Pearson omnibus normality test was performed to test for Gaussian distribution. Depending on the result, unpaired Student’s t test or Mann–Whitney test was used to compare means between two independent groups, whereas paired Student’s t test or Wilcoxon matched-pairs signed rank test was used for different treatments within the same patient group. *P < 0.05; **P < 0.01; ****P < 0.0001.
NK-Cell Cytolytic Activity Toward Antigen-Activated CD4+ T Cells Is Impaired in MS.
To investigate whether the MS-related reduced cell surface expression of the activating NK-cell receptors DNAM-1 and 2B4 (Fig. 3B) had any impact on NK-cell cytolytic function, the release of cytolytic granules (degranulation) in response to both MHC class I-deficient target cells as well as MHC class I-expressing CD4+ T cells was investigated (Fig. 4A). Despite reduced cell surface expression of DNAM-1 and 2B4, degranulation of low-dose IL-2–activated NK cells (closed symbols) in response to MHC class I-deficient K562 (Fig. 4B, Left) as well as 721.221 (Fig. 4B, Right) target cells was not diminished in MS patients. In contrast, NK cells derived from MS patients exhibited a significantly reduced degranulation in response to MHC I-expressing antigen-activated CD4+ T cells (Fig. 4C, Right). On the one hand, antigen activation of CD4+ T cells was a prerequisite for NK-cell activation, because NK-cell cytolytic function was only induced when CD4+ T cells were stimulated with IL-2 in combination with staphylococcal enterotoxin B (SEB) (Fig. 4C, Right) but not with IL-2 alone (Fig. 4C, Left). On the other hand, IL-2 activation of NK cells was also a prerequisite, because freshly isolated resting NK cells did not respond to IL-2/SEB-activated T cells (Fig. 4D). Taken together, our data demonstrated that the cytolytic activity of NK cells in response to autologous antigen-activated CD4+ T cells seemed to be impaired as one feature of MS (Fig. 4C).
IL-2R Modulation Enhances Degranulation of NK Cells in a Process Depending on the Presence of Dendritic Cells.
To investigate the impact of IL-2R modulation on NK-cell cytolytic activity, release of cytolytic granules in response to K562, 721.221 (Fig. 4B), or antigen-activated CD4+ T target cells (Fig. 4C, Right) was determined in PBMCs stimulated with either low-dose IL-2 alone or IL-2 in the presence of DAC HYP (Fig. 4A). Neutralization of the IL-2Rα chain resulted in a significantly increased cytolytic activity of NK cells in response to both MHC class I-deficient target cells (Fig. 4B) as well as MHC class I-expressing antigen-activated CD4+ T cells (Fig. 4C, Right). However, NK cells derived from MS patients still exhibited a significantly reduced cytolytic activity toward antigen-activated CD4+ T cells (Fig. 4C, Right). Interestingly, increased degranulation of NK cells in response to antigen-activated CD4+ T cells was lost when NK cells were purified before stimulation with IL-2/DAC HYP but restored by the addition of myeloid DCs (mDCs) (Fig. 4E). In summary, IL-2R modulation boosts NK-cell cytolytic activity in a DC-mediated process.
Impaired DNAM-1/CD155 Interactions in MS Result in Decreased NK-Cell Cytolytic Activity.
We next explored the cellular and molecular origin of the regulatory disturbance by performing crisscross experiments (Fig. 5A). Therefore, degranulation of NK cells derived from therapy-naïve MS patients in response to autologous CD4+ T cells (Fig. 5A, Left) or allogeneic CD4+ T cells derived from independent healthy individuals (Fig. 5A, Center) was compared with that of healthy individuals. In a third setup, the cytolytic activity of NK cells derived from healthy individuals was tested in response to allogeneic CD4+ T cells derived from independent healthy individuals or therapy-naïve MS patients (Fig. 5A, Right). Crisscross experiments revealed that NK cells from MS patients either exhibited a higher or lower cytolytic activity toward allogeneic healthy donor (HD) CD4+ T cells than those derived from healthy individuals (Fig. 5A, Center). On the other hand, CD4+ T cells derived from MS patients induced significantly less cytolytic activity in NK cells of healthy individuals than those derived from HDs (Fig. 5A, Right), although to a lower degree than observed in the syngenic setup (Fig. 5A, Left). These data indicated that CD4+ T cells of MS patients are at least partially responsible for the defective immune-regulatory function. To understand the mechanism of action behind this MS-related CD4+ T-cell evasion, we further investigated which NK-cell receptor–ligand interaction was responsible for T cell-dependent induction of NK cell-mediated cytolysis. Therefore, we compared the expression of the respective ligands for the activating NK-cell receptors NKG2D, DNAM-1, 2B4, NKp30, NKp44, and NKp46 on CD4+ T cells stimulated with IL-2 alone or in combination with SEB (Fig. S3A). IL-2–activated CD4+ T cells, which failed to trigger NK-cell degranulation (Fig. 4C, Left), mainly expressed the 2B4 ligand CD48 on their cell surface (Fig. 5B and Fig. S3A). Stimulation of CD4+ T cells with IL-2 in combination with SEB that had been shown to trigger cytolytic activity of NK cells (Fig. 4C, Right) resulted in a selective up-regulation of the DNAM-1 ligand CD155 (Fig. 5B) on CD4+ T cells, but none of the other ligands (Fig. S3A), suggesting that CD155/CD48 coexpression on antigen-activated CD4+ T cells might be responsible for induction of cytolytic activity in NK cells. Of note, CD155 expression was observed on all CD4+ T-cell subsets with the strongest up-regulation on central memory T cells (Fig. S3B). Our hypothesis that coexpression of CD155 is required for triggering cytolytic activity was further supported by the observed positive correlation between CD155 expression levels on CD4+ T cells and the degree of degranulation of NK cells (Fig. 5C). Strikingly, interference with up-regulation of CD155 on the cell surface of antigen-activated CD4+ T cells using siRNA (Fig. 5D, Left) significantly impaired the cytolytic activity of NK cells (Fig. 5D, Right), indicating that CD155 is indeed responsible for CD4+ T cell-mediated induction of NK-cell cytolytic activity. In accordance with the MS-related decreased cytolytic activity of NK cells in response to antigen-activated CD4+ T cells (Fig. 4C), significantly less CD4+ T cells of MS patients up-regulated CD155 on their cell surface upon antigen activation (Fig. 5E, Left) compared with healthy individuals. Of note, the expression of CD48 was also slightly reduced in MS patients (Fig. 5E, Right). Overall, our data proposed that defective cytolytic activity of NK cells in MS is most likely attributable to an impaired DNAM-1/CD155 and 2B4/CD48 interaction between NK cells and CD4+ T cells.
Fig. 5.

Impaired DNAM-1/CD-155 interactions result in lower cytolytic activity of NK cells in MS. (A) Illustration of crisscross experiments to investigate defective NK-mediated immune regulation in MS (upper row). (A, Left and Center) Degranulation of IL-2/DAC HYP-stimulated NK cells derived from HDs (blue circles; n = 19) or MS patients (red triangles; n = 10) in response to IL-2/SEB–activated CD4+ T cells derived from the same donor (syngenic setup) (Left) or an independent HD (allogeneic setup) (Center). (A, Right) Degranulation of IL-2/DAC HYP-stimulated NK cells of HDs in response to allogeneic IL-2/SEB-activated CD4+ T cells derived either from HDs (blue circles) or MS patients (red circles). Unpaired Student’s t test (Left), Mann–Whitney test (Center), and paired Student’s t test (Right) were used. (B, Left) Dot plot showing CD155 and CD48 expression on CD4+ T cells stimulated for 4 d with IL-2 and IL-2/SEB. (B, Center and Right) Proportions of CD155-expressing (n = 10) (Center) and CD48-expressing (n = 9) (Right) IL-2 with or without SEB-activated CD4+ T cells derived from HDs. Wilcoxon matched-pairs signed rank test was used. (C) Proportions of CD107a+ NK cells after coincubation with syngenic CD4+ T cells stimulated for 2 and 4 d with IL-2/SEB displayed against proportions of the corresponding CD155+ CD4+ T cells. Correlation was analyzed by Pearson test. (D, Left) Proportions of CD155-expressing CD4+ T cells transfected with control (blue circles) or CD155-specific siRNA (red triangles) during stimulation with IL-2/SEB. (D, Right) Degranulation of syngenic NK cells in response to control (blue circles) or CD155-specific siRNA-treated (red circles) activated CD4+ target cells. Paired Student’s t test. (E) Expression of CD155 (n = 33HD/22MS) (Left) and CD48 (n = 19 HDs/22 MS patients) (Right) on CD4+ T cells derived from HDs (blue circles) or MS patients (red triangles) following 4-d stimulation with IL-2/SEB. Unpaired Student’s t test was used. Error bars indicate the SD. *P < 0.05; **P < 0.01; ****P < 0.0001.
Fig. S3.

Expression of distinct NK-cell receptor ligands on IL-2 with or without SEB-activated CD4+ T cells. (A) CD4+ T cells (n = 10 HDs) were stimulated for 4 d with IL-2 or IL-2/SEB, and the expression of the indicated ligands for the respective NK-cell receptors was determined by flow cytometry using fluorochrome-conjugated antibodies or NCR-Fc proteins in the case of the NCR ligands. Proportions of NK-cell ligand-expressing CD4+ T cells are displayed. (B, Left) Representative dot blot (n = 5 HDs) showing the distribution of CD27+CD45RO− naïve, CD27+CD45RO+ central memory, and CD27−CD45RO+ effector memory CD4+ T cells. (B, Right) CD155 expression on IL-2– or IL-2/SEB-activated CD4+ T-cell subsets. Error bars indicate the SD. P values were calculated by Wilcoxon matched-pairs signed rank test. *P < 0.05; **P < 0.01; ***P < 0.01.
Therapeutic Modulation of the IL-2R by DAC HYP Restores Impaired NK-Cell Immune-Regulatory Functions in MS Patients.
So far, our data revealed that MS alters the NK-cell compartment on many different levels, including expression of certain activating NK-cell receptors (Fig. 3) as well as cytolytic activity in response to CD4+ T cells. To investigate the therapeutic effects of IL-2R modulation on the observed alterations, phenotype and function of NK cells derived from MS patients treated with DAC HYP (the SELECT and DECIDE studies) were compared with those receiving IFN-β (IFN-β treated patients and patients from the DECIDE study). One-year treatment with IFN-β had no impact on the CD56bright NK-cell subset (Fig. 6A, Upper Left), whereas frequencies of CD56bright NK cells were significantly increased in MS patients treated with DAC HYP compared with baseline (Fig. 6A, Lower Left, SELECT study) and patients treated with IFN-β (Fig. 6A, Right, DECIDE study). Moreover, the proportions of GrK-expressing CD56bright NK cells were slightly increased in response to DAC HYP (Fig. 6B, SELECT and DECIDE studies). Whereas treatment of MS patients with IFN-β had no impact on the degranulation of NK cells (Fig. 6C, Left), IL-2R modulation improved cytolytic activity of NK cells in response to allogeneic T cells (Fig. 6C, Right, SELECT study). Of note, the expression of the activating NK-cell receptors DNAM-1 and 2B4, which were expressed to a lower degree on the cell surface of MS patients (Fig. 3B), remained unaltered (Fig. S4A, SELECT study). So far, our setup only focused on the impact of IL-2R modulation on NK cells, because antigen-activated but otherwise “untreated” CD4+ T cells were used as target cells. For further investigation of the therapeutic effects of IL-2R modulation on CD4+ target cells, cytolytic activity of NK cells of MS patients treated with DAC HYP in response to autologous CD4+ T cells was compared with that of MS patients treated with IFN-β (Fig. 6D, DECIDE study). NK cells of DAC HYP-treated patients revealed a significantly enhanced cytolytic activity in response to syngeneic antigen-activated CD4+ T cells than those treated with IFN-β (Fig. 6D, Left), and accordingly frequencies of CD155 expressing CD4+ T cells were also significantly increased under DAC HYP treatment (Fig. 6D, Right). Taken together, these data suggest that therapeutic immune modulation of the IL-2R at least partially restores impaired immune-regulatory function of NK cells in MS by both targeting the NK-cell as well as the T-cell target side (Fig. 7).
Fig. 6.

Therapeutic IL-2R modulation in MS patients restores impaired immune-regulatory function of NK cells via up-regulation of the DNAM-1 ligand CD155. Phenotype and function of NK cells derived from MS patients before (closed red triangles down) and after 1-y treatment with IFN-β (open red triangles down) (n = 13) or with DAC HYP (open cayenne triangles down; SELECT study, n = 9) were investigated. Furthermore, phenotype and function of NK cells derived from 16 MS patients of the DECIDE study were investigated in a blinded fashion. Unblinding revealed that 6 patients had received IFN-β and 10 patients had received DAC HYP. (A) Proportions of NK cells and their subsets from the indicated trials are displayed. Representative CD16 versus CD56 plots of NK cells (Upper Right) from the DECIDE trial are shown. Wilcoxon matched-pairs signed rank test (IFN-β; SELECT) and unpaired Student’s t test (DECIDE) were used. (B) Proportions and MFI of GrK-expressing CD56bright and CD56dim NK cells from the SELECT (Left) and DECIDE (Right) trials. Wilcoxon matched-pairs signed rank test (SELECT) and unpaired Student’s t test (DECIDE) were used. (C) Degranulation of IL-15–stimulated (48 h) NK cells at baseline (closed red triangles down) and after 1-y treatment with IFN-β (open red triangles down) (n =13) or DAC HYP (open cayenne triangles down; SELECT study) (n = 6) in response to IL-2/SEB-activated allogeneic CD4+ T cells derived from independent HDs. Paired Student’s t test was used. (D, Left and Center) Representative CD107a versus CD56 plots of NK cells (Left) and proportions (Center) of degranulating IL-15–activated NK cells from the IFN-β (open red triangles) or DAC HYP (open cayenne triangles) arm of the DECIDE study in response to autologous (autol.) IL-2/SEB-activated (48 h) CD4+ T cells (Center). (D, Right) Proportions of CD155+ CD4+ T cells derived from MS patients treated with either IFN-β (open red triangles down) or DAC-HYP (open cayenne triangles down) following 48 h of stimulation with IL-2/SEB. Unpaired Student’s t test was used. *P < 0.05; **P < 0.01.
Fig. S4.

In vivo impact of DAC HYP on NK cell-activating and cytokine receptors. PBMCs derived from the PB of MS patients (n = 9) from the SELECT trial at baseline (closed red triangle down) and after 52 wk of DAC HYP treatment (open cayenne triangles down) were stained with fluorochome-conjugated lineage-specific antibodies (CD3, CD56, and CD16) and antibodies directed against activating NK-cell receptors (DNAM-1, 2B4, and NKp44) (A) and IL-2R α-chain (CD25, clone 7G7B6) and β-chain (CD122) (B). Percentages (left side of the graph) and MFIs (gray background of cell surface receptor-positive CD56bright and CD56dim NK subsets) are displayed. Error bars indicate the SD. Wilcoxon matched-pairs signed rank test was performed. *P < 0.05; **P < 0.01; ***P < 0.0001.
Fig. 7.

Working hypothesis. Antigen-triggered up-regulation of the DNAM-1 ligand CD155 renders CD4+ T cells more sensitive to NK cell-mediated lysis (Left). Impaired immune-regulatory functions of NK cells in MS patients are attributable to reduced up-regulation of CD155 on antigen-activated T cells on the one hand and lower expression of its receptor DNAM-1 on NK cells on the other hand (Center). Therapeutic immune modulation with DAC HYP restores defective immune-regulatory function of NK cells by both improving their cytolytic capacity as well as increasing CD155 expression on CD4+ T cells (Right).
Discussion
The aim of the current study was to characterize the role of NK cells in human CNS autoimmunity and the impact of IL-2R modulation on NK-cell immune-regulatory functions. Investigating the presence, distribution, and function of NK cells in three different compartments (CNS, CSF, and PB), our data revealed an important role of NK cells in controlling T-cell activity in vivo and a deficit of NK-mediated control of T-cell activity in MS that could be restored by therapeutic modulation of the IL-2R. Thus, in addition to regulatory T cells and tolerogenic DCs, NK cells seem to be important players in controlling T-cell activation and MS-related impairment of this cell population might be one of the driving forces in the pathogenesis of this disease.
MS-related higher frequencies of the NK-cell activation marker NKp44-expressing CD56bright NK cells suggest MS-related activity of this subset in vivo. Interestingly, NK cells seem not only control T-cell activity in the periphery but also in the CNS, because occurrence of immune-regulatory GrK-expressing NK cells in active MS lesions in close proximity to T cells indicates an active role of these cells in regulating T cell-mediated inflammation in the CNS. CSF analysis revealed that in accordance with the literature (42), the majority of intrathecal NK cells were CD56bright NK cells, and both enhanced adhesion to and transmigration of this subset across primary HBMECs suggest that increased proportions of CD56bright NK cells are at least partly attributable to their higher trafficking capacity across the BBB. Enhanced trafficking capacity could be an intrinsic feature of the CD56bright NK-cell subset and accordingly static imaging of distinct NK-cell subsets added to HBMEC monolayers revealed a twofold-higher motility of CD56bright NK cells compared with their CD56dim counterparts. Moreover, HLA-C expressed on HBMECs (Fig. S5) might inhibit adhesion and trafficking of KIR-expressing CD56dim NK cells through interaction with this inhibitory receptor as reported elsewhere (43), whereas CD56bright NK cells are not inhibited, because HBMECs do not express the inhibitory NKG2-A ligand HLA-E (Fig. S5). Finally, reduction of intrathecal CD56bright NK-cell frequencies to levels of healthy individuals in MS patients treated with the α4β1 integrin blocker (44) natalizumab indicates that transmigration of NK cells into the CNS depends on VLA-4. The alternative MCAM-dependent pathway that has been recently described for Th17 (38) cells can be ruled out, because NK cells do not express this receptor. Of note, the trafficking capacity of CD56bright NK cells was not impaired in MS patients and similar proportions of CD56bright NK cells observed in the CSF of both MS patients as well as healthy individuals propose a general role of this NK-cell subset in CNS immune surveillance. Intrathecal CD56bright NK-cell/CD4 T-cell ratios did not differ between MS patients and healthy individuals. Because the majority of intrathecal NK cells are immune-regulatory CD56bright NK cells, a disease-accelerating role of NK cells in CNS autoimmunity as it has been proposed (45–48) is unlikely.
Fig. S5.
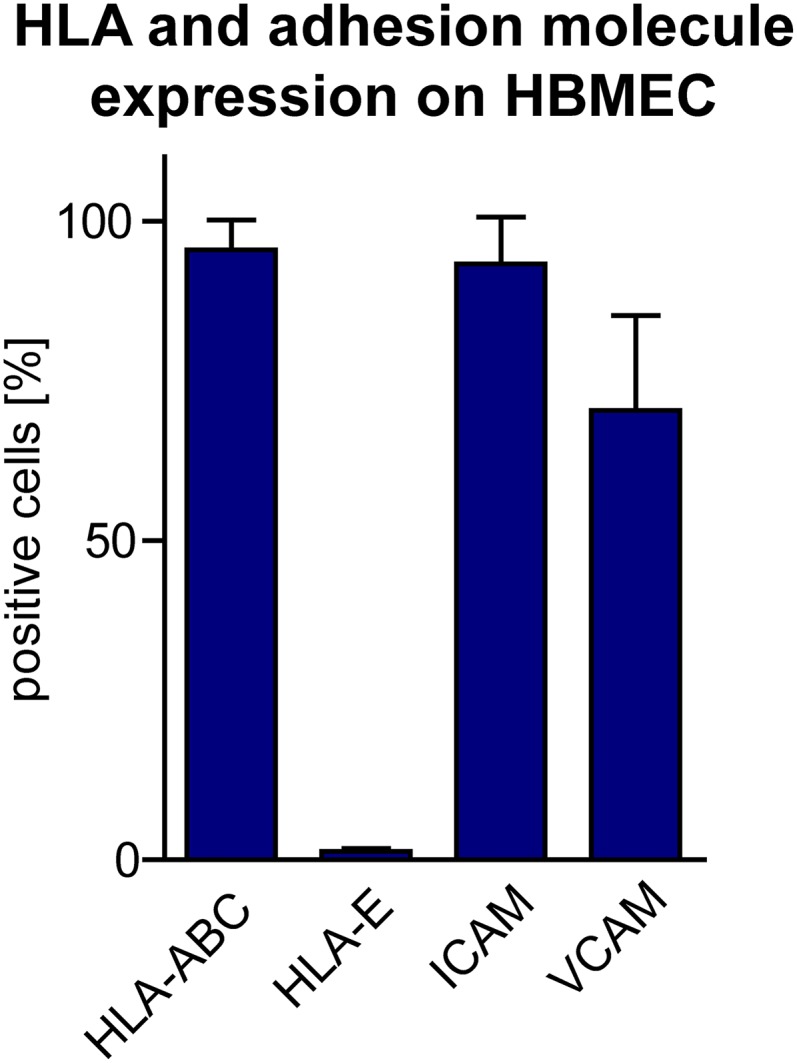
HLA and adhesion molecule expression on HBMECs. Expression of HLA-A/B/C, HLA-E, ICAM, and VCAM was analyzed by flow cytometry on HBMECs using the respective fluorochrome-conjugated antibodies. Error bars indicate the SD of n = 3 independent experiments.
MS is associated with alterations of the peripheral NK-cell compartment. We found reduced cell surface expression of the activating NK-cell receptor DNAM-1 (CD226), a genetic alteration consistently found in MS-association studies (16–18), and 2B4. DNAM-1, the receptor for Nectin-2 (CD112) and PVR (CD155), is an activating NK-cell receptor, which is crucial for controlling NK-cell cytotoxicity (reviewed in ref. 49) and requires the coactivating receptor 2B4 for full NK-cell activation (40, 41, 50). Indeed, our data revealed that, at least for the T-cell stimulation protocol used in the current study, DNAM-1/CD155 as well 2B4/CD48 interactions seemed to be a prerequisite for NK-cell mediated control of CD4+ T-cell activation (Fig. 7, Top). Although IL-2–activated CD4+ T cells only expressed the 2B4 ligand CD48 on their cell surface and failed to activate NK-cell cytolytic function, stimulation of T cells with IL-2 and SEB resulted in an up-regulation of the DNAM-1 ligand CD155 concomitantly with an enhanced NK-cell cytolytic activity (Fig. 7, Top). Moreover, cytolytic activity of NK cells positively correlated with expression of CD155 on CD4+ T cells and reduced up-regulation of CD155 expression on CD4+ T cells using siRNA resulted in lower NK-cell response. With regard to the siRNA experiments, one has to keep in mind the recently reported role of CD155 as a costimulatory molecule for CD4+ T cells (51). Thus, CD155 knock down could also induce a suboptimal activation of CD4+ T cells, resulting in a reduced susceptibility to NK-cell killing by other mechanisms than CD155. Strikingly, we observed a significantly reduced cell surface expression of both DNAM-1 as well as its coreceptor 2B4 on NK cells derived from MS patients, proposing that this might result in a MS-related decrease of NK-cell-mediated control on T-cell activity in vivo; however, it might be possible that other NK-cell receptors might also be involved. Furthermore, a recent study revealing a crucial role of DNAM-1 in NK-cell “licensing” (52) suggests that NK cells of MS patients might be less “licensed.”
Our hypothesis that impaired DNAM-1/CD155 interactions in MS disrupts NK-mediated control of T-cell activity (Fig. 7, Middle) is further supported by genome-wide association studies (GWAS) revealing that a single nucleotide polymorphism in the CD226 gene, leading to one amino acid substitution in the DNAM-1 receptor (Gly307Ser/rs763361T), is associated with a higher incidence in developing several autoimmune diseases including MS (16–18). Although additional work is required to elucidate whether this amino acid substitution, which occurs in the intracellular domain of DNAM-1, affects DNAM-1 signaling and NK-cell cytolytic function (49), these data suggest that DNAM-1 plays critical role in controlling autoimmunity. MS-related reduced cell surface expression of DNAM-1 could be also attributable to down-modulation in response to sustained receptor engagement, because receptor down-modulation has been shown for impaired NK cell function in tumor control [e.g., down-regulation of DNAM-1 by CD155 expressing tumor cells (53)]. Binding of the CD226 antagonists CD96 and TIGIT (T-cell immunoreceptor with Ig and ITAM domains) result in decreased cytokine secretion (54) and degranulation (55) by NK cells, respectively. Thus, investigating the role of these two CD226 antagonists that are both expressed on human NK cells in the observed defective NK-mediated regulation of T-cell activity in MS is further warranted.
In addition to a higher threshold for NK-cell activation attributable to lower expression of DNAM-1 as well as a gene polymorphism in the CD226 gene, our study clearly demonstrated that impaired immune regulation in MS was also attributable to a CD4+ T-cell evasion mediated by lower up-regulation of the DNAM-1 ligand CD155 upon antigen activation (Fig. 7, Middle). Down modulation of CD155 seems to be a common concept used by CD4+ T cells to escape NK cell-mediated control. In HIV-1–infected CD4+ T cells, the early viral Nef protein down-modulates CD155 expression, thereby preventing NK cell-mediated lysis of infected T cells (15). Of note, NK-cell cytolytic activity toward antigen-activated MHC class I-expressing CD4+ T cells seems to be impaired in MS, whereas no deficit in response to MHC class I-deficient tumor target cells was observed. MHC class I deficiency lowers the threshold for NK-cell activation tremendously (13), and therefore lower expression of certain activating NK-cell receptors in MS might be negligible.
MS seems not only to alter NK-cell immune-regulatory functions but also their differentiation. It is well accepted that NK cells differentiate from the more immature CD56bright to the mature CD56dim stage (56, 57). We found a slight but significant decrease of peripheral NK cells in MS, a finding that was also observed in earlier studies (56, 57). We could further show that the decrease is attributable to a reduction of the CD56dim NK-cell subset, whereas frequencies of CD56bright NK cells remained unaltered, thus suggesting that NK-cell maturation might be impaired in MS. The finding that therapeutic immune modulation of the IL-2R with daclizumab significantly enhances frequencies of the immature CD56bright, but not the mature CD56dim NK-cell subset (10), further supports this hypothesis. It is likely that although daclizumab promotes differentiation of CD56bright NK cells from a common innate lymphoid cell (ILC) progenitor (58), NK cells then get trapped in the more immature CD56bright stage because of a failure in further maturation. Observed lower frequencies in IL-2Rα as well as β-chain–expressing CD56bright NK cells in MS patients might be a possible explanation for diminished NK-cell maturation, because among others, the IL-2R drives NK-cell maturation. Furthermore, cytokines secreted by activated T cells could also suppress the CD56dim NK-cell subset. It has been shown that IL-21 secreted by antigen-activated T cells including Th17 cells enhances NK-cell function (59, 60) but antagonizes NK-cell viability, thus indicating a role for this cytokine in promoting NK-cell degeneration by autoreactive T cells (61).
DAC HYP is a new promising MS therapy under investigation, which recently demonstrated superior efficacy relative to IFN-β on annualized relapse rate as well as MRI lesions in a phase III clinical study [the DECIDE study (32)]. It has been postulated that DAC HYP largely acts via modulation of NK-cell function (reviewed in ref. 4). In our study, we had the unique opportunity to analyze immune cells from MS patients, who participated in the DECIDE trial and received either DAC HYP or IFN-β as part of the study protocol. Moreover, we analyzed biomaterial from MS patients before and following 12 mo of DAC HYP treatment as part of the SELECT study (62). Our data revealed that therapeutic modulation of the IL-2R with DAC HYP induced changes in NK-cell phenotype and function. Frequencies of CD56bright NK cells were significantly increased in DAC HYP-treated MS patients in comparison with both baseline levels (the SELECT study) as well as patients of the IFN-β arm (the DECIDE study). Interestingly, frequencies of NKp44-expressing (a surrogate marker for NK-cell activation) CD56bright NK cells were also enhanced following 1-y treatment with DAC HYP (the SELECT study), indicating that immune modulation of the IL-2R triggers activity of this NK-cell subset in vivo.
IFN-β is a well-established first-line therapy for treatment of MS that has also been suggested to have an impact on the NK-cell compartment, but to date IFN-β’s effect on NK-cell immune-regulatory function is still poorly understood (22–24, 63). Comparing patients before and following 1-y treatment with DAC HYP (the SELECT study) with those treated with IFN-β demonstrated that DAC HYP increased NK-cell cytotoxicity, whereas it remained unaltered in MS patients treated with IFN-β, suggesting that the latter treatment has no impact on NK-cell immune-regulatory function. Along these lines, we could also show that NK-cell cytolytic activity in response to antigen-activated CD4+ T cells was significantly enhanced in MS patients treated with DAC HYP relative to IFN-β (the DECIDE study). In correlation with the recently demonstrated superior efficacy of DAC HYP compared with IFN-β [the DECIDE study (32)], our finding further supports the hypothesis that NK cells are crucial players in controlling T-cell activity. Moreover, NK cells might even reduce the dependency on T-cell immune-regulatory functions, because regulatory T cells are strongly decreased in patients treated with DAC HYP, despite its therapeutic benefit (10, 62).
DAC HYP restores impaired immune-regulation by targeting both the NK-cell as well as the T-cell side (Fig. 7, Bottom). On the one hand, IL-2R modulation resulted in an increased cytolytic capacity of NK cells [in accordance with the literature (10, 30, 31, 33)]. The puzzling finding that neutralization of the IL-2Rα chain results in enhanced cytotoxicity of NK cells might be attributable to a higher availability of T cell-derived IL-2 for NK-cell activation, as has been proposed by others (30). Nevertheless, our study suggests that another mechanism is also likely. We could demonstrate that DAC HYP-mediated increased activation of NK cells depends on the presence of DCs. DCs have been shown to cross-present IL-2 and IL-15 to lymphocytes via the IL-2Rα (64) and IL-15Rα chain (57, 65, 66), respectively. Both cytokines are transpresented to and signal through the IL-2Rβ and common γ-chain, and blocking IL-2Rα cross-presentation using DAC HYP might therefore result in enhanced IL-15 signaling in NK cells, leading to the increased cytolytic activity. On the other hand, we observed significantly higher frequencies of CD155-expressing CD4+ T cells upon antigen activation in MS patients treated with DAC HYP compared with those of the IFN-β arm (the DECIDE study). Therefore, immune modulation of the IL-2R does not only trigger NK-cell cytotoxicity but also seems to restore impaired DNAM-1/CD155 interaction in MS patients by rendering CD4+ T cells more sensitive to NK cell-mediated lysis (Fig. 7, Bottom). This hypothesis is further supported by an earlier study suggesting that activated T cells derived from MS patients under daclizumab therapy seem to be more sensitive to NK-mediated lysis than activated T cells from baseline (10).
In conclusion, our data postulate that functionally disturbed immune-regulatory networks of NK cell-mediated T-cell regulation in CNS autoimmunity is caused by impaired DNAM-1/CD155 interaction and restored by therapeutic modification of the IL-2R with DAC HYP.
Materials and Methods
Detailed methods are provided in SI Materials and Methods.
Patients and Healthy Controls.
A total of 182 patients with the diagnosis of clinically isolated syndrome (CIS) or clinically definite relapsing-remitting MS (RRMS) according to the 2010 revised McDonald diagnostic criteria (67) were enrolled in this study. Patient demographics are summarized in Table S1. Human tissue samples from seven MS patients (paraffin-embedded section of three MS patients; frozen sections of four MS patients) were investigated retrospectively. None of the study authors was involved in decision-making with respect to biopsy. The study was performed in accordance with the declaration of Helsinki and approved by the local ethics committees of the Universities of Dresden, Münster, and Munich (LMU Munich, registration no. 245/02; Ethik-Kommission der Ärztekammer Westfalen-Lippe und der Medizinischen Fakultät der Westfälischen Wilhelms-Universität Münster; registration nos. 2010-262-f-S and 2012-236-f-S). For patient samples derived from the SELECT trial, institutional review board/ethics committee approval was obtained at each participating center (62). Lumbar puncture was performed for medical reasons only. All participants of this study provided written informed consent.
Table S1.
Patient demographics
| Biomaterial | Sex | Age, y (range) | Disease | Treatment |
| PBMCs | 44 f, 23 m | 36 (19–65) | 67 Healthy individuals | None |
| PBMCs | 43 f, 13 m | 36 (20–61) | 12 CIS, 44 RRMS | None |
| PBMCs | 9 f, 4 m | 32 (24–60)* | 7 CIS, 6 RRMS* | IFN-β |
| PBMCs | 8 f, 1 m | 40 (23–51)* | 9 RRMS | DAC HYP (SELECT) |
| PBMCs | 5 f, 1 m | 39 (20–48) | 6 RRMS | IFN-β1a (DECIDE) |
| PBMCs | 8 f, 1 m | 35 (20–49) | 10 RRMS | DAC HYP (DECIDE) |
| PB/CSF | 14 f, 11 m | 34 (18–55) | 25 Somatoform disorder† | None |
| PB/CSF | 47 f, 20 m | 36 (20–78) | 20 CIS, 47 RRMS | None |
| PB/CSF | 12 f, 5 m | 38 (22–54) | 17 RRMS | Natalizumab |
*At baseline. †Patients with a somatoform disorder that did not show any signs of an inflammatory CSF syndrome served as a control group (72). f, female; m, male.
Immunohistochemistry.
All lesions fulfilled the generally accepted criteria for the diagnosis of MS (67). Demyelinating activity was classified as described in detail earlier (68).
Tissue specimens were fixed in PBS supplemented with 4% (wt/vol) paraformaldehyde and embedded in paraffin. Tissue samples were cut in 4-µm-thick sections that were stained with hematoxylin/eosin (H&E) and Luxol-fast blue. Immunohistochemical staining was performed with an avidin–biotin technique using an automated staining device (DakoLink 48). For the detection of NK and T cells in the lesions of MS patients, sections were treated with EnVision FLEX (DAKO) target retrieval solution; probed with anti-CD56 (123C3; DAKO), anti-GrK (69884; Abcam), and anti-CD3 (EPR4517; Epitomics); and analyzed with Axio Scope.A1 (Zeiss).
Cells and Cell Culture.
Blood was withdrawn into EDTA-containing tubes (K2E Vacutainer; BD), and PBMCs were isolated by density centrifugation and cryopreserved in liquid nitrogen according to our standard operating procedures (SOPs) (69). Frozen PBMCs from the SELECT and DECIDE study were collected according to the respective study protocols and obtained from study investigators by shipping in sealed liquid nitrogen containers with continuous temperature surveillance. Frozen PBMCs were thawed according to our SOPs as previously described (69). NK cells were isolated from freshly isolated PBMCs using the NK-cell enrichment kit (Stem Cell Technologies) (70).
SEB-activated (Sigma) CD4+ T cells (SEB aCD4+ T cells) were generated by stimulation of thawed PBMCs in Roswell Park Memorial Institute (RPMI)-1640 medium supplemented with 10% (vol/vol) heat-inactivated FCS, 200 IU/mL recombinant human IL-2 (Peprotech), and 100 µg/mL SEB at cell densities of 2 × 10⁶ cells/mL. Following 4 d of stimulation at 37 °C and 5% (vol/vol) CO2 CD4+ T cells were isolated using the CD4 T Cell Isolation Kit II (Miltenyi) according to the manufacturer’s instructions.
Flow Cytometry.
For labeling of cell surface molecules, PBMCs were stained with fluorochrome-conjugated antibodies diluted in PBS/0.5% BSA/2 mM EDTA and incubated for 45 min at 4 °C at the indicated working concentrations (Table S2). For intracellular staining of perforin and GrK, cell surface-labeled PBMCs were permeabilized with fixation/permeabilization solution (eBiosciences), followed by intracellular staining with fluorochrome-conjugated anti-GrK and anti-perforin diluted in permeabilization solution (eBiosciences) at the indicated working concentrations (Table S2) according to the manufacturer’s instructions. NKp30, NKp44, and NKp46 ligands were stained with 10 µg/mL of the respective Fc-fusion protein (R&D Systems) as described above. Following extensive washing, bound fusion proteins were labeled with 1:50 diluted FITC-conjugated goat anti-human IgG. Flow cytometry of CSF and whole blood cells was performed as previously described (71). All flow cytometry data were acquired on a Gallios (Beckman Coulter) or Navios (Beckman Coulter) flow cytometer, and the resulting data were analyzed using Kaluza Flow Cytometry Analysis version 1.2 software (Beckman Coulter) and Prism version 5.04 software (GraphPad).
Table S2.
Antibodies used for flow cytometry
| Antibodies | Fluorochrome | Clone | Company | Working concentration |
| CD1c | BrilliantViolet421 | L161 | Biolegend | 1:50 |
| CD3 | ECD | UCHT1 | Beckman Coulter | 1:50 |
| CD3 | PC5.5 | UCHT1 | Beckman Coulter | 1:200 |
| CD3 | PerCP/Cy5.5 | UCHT1 | Biolegend | 1:50 |
| CD3 | PacificBlue | UCHT1 | Invitrogen | 1:50 |
| CD3 | BrilliantViolet510 | OKT3 | Biolegend | 1:50 |
| CD4 | APC | M-T466 | Miltenyi | 1:50 |
| CD4 | BrilliantViolet421 | RPA-T4 | Biolegend | 1:50 |
| CD8 | APC-A700 | B9.11 | Beckman Coulter | 1:50 |
| CD11a | PE | HI111 | Biolegend | 1:50 |
| CD14 | FITC | RMO52 | Beckman Coulter | 1:50 |
| CD14 | APC | MoP9 | BD Biosciences | 1:50 |
| CD16 | APC-A750 | 3G8 | Beckman Coulter | 1:50 |
| CD19 | FITC | HIB19 | BD Biosciences | 1:50 |
| CD25 | FITC | 7G7B6 | Ancell | 1:50 |
| CD25 | PE | B1.49.9 | Beckman Coulter | 1:50 |
| CD27 | APC | L128 | BD Biosciences | 1:50 |
| CD29 | FITC | TS2/16 | eBiosciences | 1:50 |
| CD44 | PerCP/Cy5.5 | IM7 | Biolegend | 1:50 |
| CD45 | KromeOrange | J.33 | Beckman Coulter | 1:50 |
| CD45RO | APC-A700 | UCHL1 | Biolegend | 1:50 |
| CD48 | FITC | MEM-102 | Biolegend | 1:50 |
| CD49d | PC7 | 9F10 | Biolegend | 1:50 |
| CD54 | FITC | MEM111 | Biolegend | 1:50 |
| CD54 | PacificBlue | HCD54 | Biolegend | 1:50 |
| CD56 | ECD | N901 | Beckman Coulter | 1:50 |
| CD56 | PC7 | N901 | Beckman Coulter | 1:50 |
| CD56 | APC | NCAM16.2 | BD Biosciences | 1:50 |
| CD62L | APC-A750 | Dreg-56 | Invitrogen | 1:50 |
| CD106 | APC | STA | Biolegend | 1:50 |
| CD107a | FITC | H4A3 | BD Pharmingen | 1:50 |
| CD112 | PE | R2.525 | BD Pharmingen | 1:50 |
| CD122 | PE | Mik-β2 | BD Pharmingen | 1:50 |
| CD155 | PE | SKIL4 | Biolegend | 1:50 |
| CD159a | PE | Z199 | Beckman Coulter | 1:50 |
| CD159a | PC7 | Z199 | Beckman Coulter | 1:50 |
| CD196 | PC7 | 11A9 | BD Biosciences | 1:50 |
| CD197 | PerCP/Cy5.5 | GO43H7 | Biolegend | 1:50 |
| CD226 | PE | 11A8 | Biolegend | 1:50 |
| CD244 | PE | C1.7 | Beckman Coulter | 1:50 |
| CD244 | PerCP/Cy5.5 | C1.7 | Biolegend | 1:50 |
| CD314 | PE | 149810 | R&D Systems | 1:50 |
| CD335-Fc | R&D Systems | 10 µg/mL | ||
| CD336-Fc | R&D Systems | 10 µg/mL | ||
| CD336 | APC | P44-8 | Biolegend | 1:50 |
| CD337-Fc | R&D Systems | 10 µg/mL | ||
| CX3CR1 | FITC | 2A9-1 | Biolegend | 1:50 |
| CXCR3 | PE | G025H7 | Biolegend | 1:50 |
| GrK | FITC | GM6C3 | Santa Cruz | 1:20 |
| HLA-A/B/C | FITC | W6/32 | Biolegend | 1:50 |
| HLA-E | PE | 3D12HLA-E | eBiosciences | 1:50 |
| Goat anti-human IgG | FITC | Antibodies-online | 1:25 | |
| MIC-A/B | PE | 6D4 | BD Pharmingen | 1:50 |
| Perforin | FITC | DG9 | Biolegend | 1:20 |
| Perforin | PE | DG9 | Biolegend | 1:20 |
| ULBP1 | PE | 170818 | R&D Systems | 1:50 |
| ULBP2/5/6 | APC | 165903 | R&D Systems | 1:50 |
Static Imaging of NK Cells.
Static imaging of CD56bright and CD56dim NK-cell subsets was performed as previously described (38).
Conjugation Assay.
Conjugation assays were performed as previously described (72).
Migration Assay.
Migration assays were performed as previously described (Fig. S2 and ref. 73). The confluence of the HBMEC monolayer was monitored by testing its permeability for Evans Blue (Sigma) (Fig. 2B). HBMECs were stimulated with 500 IU/mL IFN-γ (Peprotech) and TNF-α (Peprotech) 24 h prior to the assay. PBMCs were added to the upper compartment, and the transmigration of NK-cell subsets across the HBMEC monolayer after 6 h was determined by flow cytometry. A well containing 5 × 10⁵ thawed PBMCs in 700 µL of RPMI-1640/2% B27 served as an in vitro control. The percentage of migrated cells for each cell type was calculated after the following equation:
Degranulation Assay.
Release of cytolytic granules by NK cells was determined using an effector to target cell ratio of 1:1 as previously described (70).
Silencing of CD155 Expression in SEB-Activated Primary Human CD4+ T Cells.
SEB-activated CD4+ T cells were generated as described above. Cells were harvested on days 2 and 3 and transfected with either CD155-specific siRNA [5′-CAACUUUAAUCUGCAACGUdTdTUU-3′ (74)] or ON-TARGETplus nontargeting siRNA #1 (both from ThermoScientific) by electroporation using the BTX ECM 830 Square Electroporator.
Statistics.
Data were analyzed using the Prism version 5.04 software (GraphPad). The D’Agostino–Pearson omnibus normality test was performed to test for Gaussian distribution. Depending on the result, unpaired Student’s t test or Mann–Whitney test was used to compare means between two independent groups, whereas paired Student’s t test or Wilcoxon matched-pairs signed rank test was used for different treatments within the same patient group and for comparisons between PB and CSF. >Two datasets were compared using Kruskal–Wallis with Dunn’s posttest. Correlation was analyzed by Pearson test. Data depicted in the figures display means ± SD. Box plots show the median with whiskers depicting minimal to maximal values. Differences were considered statistically significant with the following P values: *P < 0.05, **P < 0.01, ***P < 0.001, and ****P < 0.0001.
SI Materials and Methods
Immunohistochemistry.
All lesions fulfilled the generally accepted criteria for the diagnosis of MS (67). Demyelinating activity was classified as described in detail earlier (68).
Tissue specimens were fixed in 4% (wt/vol) paraformaldehyde and embedded in paraffin. Tissue samples were cut in 4-µm-thick sections that were stained with H&E and Luxol-fast blue. Immunohistochemical staining was performed with an avidin–biotin technique using an automated staining device (DakoLink 48). The primary antibodies were rabbit anti-myelin basic protein (1:1,000) (Boehringer Mannheim), mouse anti-KiM1P (1:5,000) (H.-J. Radzun, Department of Pathology, University of Göttingen, Goettingen, Germany), mouse anti-CD3 (1:25) (DAKO), mouse anti-CD20 (1:700) (DAKO), and mouse anti-MRP14 (1:2,000) (Biomedical). For the detection of NK and T cells in the lesions of MS patients, paraffin-embedded human brain tissue sections were deparaffinized and rehydrated twice with xylol, 99% (vol/vol) ethanol, 96% (vol/vol) ethanol, and finally with 70% (vol/vol) ethanol for 7 min each. Afterward, sections were pretreated with EnVision FLEX (DAKO) target retrieval solution. Following 20 min, heat-induced retrieval sections were cooled down for 20 min. Tissues were rinsed three time with PBS for 4 min each and incubated with PBS supplemented with 10% (vol/vol) FCS (surface staining) or PBS supplemented with 10% (vol/vol) FCS and 0.5% Triton X-100 (intracellular staining; Sigma) for 30 min. Primary anti-CD56 (123C3; DAKO), anti-GrK (69884; Abcam), and anti-CD3 (EPR4517; Epitomics) were diluted 1:100 (CD56 and GrK) and 1:500 (CD3) in 150 µL of PBS supplemented with 10% (vol/vol) FCS. Tissues were incubated with both antibodies for 1 h at room temperature and finally rinsed three times for 4 min in PBS. Sections were incubated with Alexa Fluor 568 anti-mouse [for CD56; Invitrogen; 1:500 in 150 µL of PBS/10% (vol/vol) FCS] and Alexa Fluor 488 anti-rabbit [for CD3 and GrK; Invitrogen; 1:500 in 150 µL of PBS/10% (vol/vol) FCS] for 45 min. Finally, the sections were rinsed three times with PBS for 4 min, dried, covered with ProLong Gold plus DAPI and analyzed with Axio Scope.A1 (Zeiss).
Cells and Cell Culture.
Blood was withdrawn into EDTA-containing tubes (K2E Vacutainer; BD), and PBMCs were isolated by density centrifugation and cryopreserved in liquid nitrogen according to our SOPs (69). Frozen PBMCs from the SELECT and DECIDE studies were collected according to the respective study protocols and obtained from study investigators by shipping in sealed liquid nitrogen containers with continuous temperature surveillance. Frozen PBMCs were thawed according to our SOPs as previously described (69).
NK cells were isolated from freshly isolated PBMCs using the NK-cell enrichment kit (Stem Cell Technologies) (70). Purity of isolated NK cells (95–99% CD3−CD56+) was determined by flow cytometry using PerCP/Cy5.5-conjugated anti-CD3 (Biolegend) and PC7-conjugated anti-CD56 (Beckman Coulter) antibodies.
mDCs were isolated from the same PBMCs as NK cells using the CD1c (BDCA-1) and DC-isolation kit (Miltenyi). The purity of CD1c+CD19−CD14low/− cells (>90%) was confirmed by flow cytometry.
SEB-activated (Sigma) CD4+ T cells (SEB aCD4+ T cells) were generated by stimulation of thawed PBMCs in RPMI-1640 medium supplemented with 10% (vol/vol) heat-inactivated FCS, 200 IU/mL recombinant human IL-2 (Peprotech), and 100 µg/mL SEB at cell densities of 2 × 10⁶ cells/mL. Following 4 d of stimulation at 37 °C and 5% (vol/vol) CO2, CD4+ T cells were isolated using the CD4 T Cell Isolation Kit II (Miltenyi) according to the manufacturer’s instructions. Purity of isolated CD4+ T cells was confirmed by flow cytometry using PerCP/Cy5.5-conjugated anti-CD3 (Biolegend) and allophycocyanin (APC)-conjugated anti-CD4 antibodies (Miltenyi). Purity of CD3+CD4+ cells was >90%.
Primary HBMECs (Sciencell) were cultured in Fibronectin-coated (Sigma) cell culture flasks in ECM-b medium (Sciencell) as previously described (38).
The human erythroid leukemia cell line K562 (American Type Culture Collection) and the B-cell lymphoma line 721.221 (kindly provided by Carsten Watzl, Leibniz Research Centre for Working Environment and Human Factors, Dortmund, Germany) were cultured at cell densities between 1 and 6 × 10⁵ cells/mL as previously described (70). Whereas K562 used in this study expressed the NKG2D ligands ULBP-1 and MIC-A/B and the DNAM-1 ligands CD112 and CD155, 721.221 cells did not express any NKG2D ligands on their cell surface but were positive for the DNAM-1 ligand CD155 and CD48, the ligand for the coactivating NK-cell receptor 2B4.
Flow Cytometry.
For labeling of cell surface molecules, PBMCs were stained with fluorochrome-conjugated antibodies diluted in PBS/0.5% BSA/2 mM EDTA and incubated for 45 min at 4 °C at the indicated working concentrations (Table S2). For intracellular staining of perforin and GrK, cell surface-labeled PBMCs were permeabilized with fixation/permeabilization solution (eBiosciences), followed by intracellular staining with fluorochrome-conjugated anti-GrK and anti-perforin diluted in permeabilization solution (eBiosciences) at the indicated working concentrations (Table S2) according to the manufacturer’s instructions. NKp30, NKp44, and NKp46 ligands were stained with 10 µg/mL of the respective Fc-fusion protein (R&D Systems) as described for extracellular staining. Following extensive washing, bound fusion proteins were labeled with 1:50 diluted FITC-conjugated goat anti-human IgG (antibodies online; www.antibodies-online.com). Flow cytometry of CSF and whole blood cells was performed as previously described (71). All flow cytometry data were acquired on a Gallios (Beckman Coulter) or Navios (Beckman Coulter) flow cytometer, and the resulting data were analyzed using Kaluza Flow Cytometry Analysis version 1.2 software (Beckman Coulter) and Prism version 5.04 software (GraphPad).
Static Imaging of NK Cells.
Static imaging was performed as previously described (31). Briefly, primary HBMECs (5 × 10⁴ cells/slide) were cultured for 48 h in IBIDI slides (IBIDI). CD3−CD56brightCD16− and CD3−CD56dimCD16+ NK cells were isolated by CD56+CD16+ and CD56+CD16− NK-cell isolation kits (Miltenyi), rested overnight, and added to the slides (5 × 10⁴ cells/slide). Images were recorded using Keyence BZ-99 microscope and BZ II viewer (Keyence) for 30 min (every 30th frame, 20× magnification). During recording, the slides were incubated at 37 °C. Covered Beeline distance was determined using ImageJ.
Conjugation Assay.
Conjugation assays were performed as previously described (72) with minor modifications. Briefly, 1 × 10⁷ HBMECs were stained for 30 min in 1 mL of RPMI-1640/10% (vol/vol) heat-inactivated FCS/2 mM l-glutamine/1 mM Na-pyruvate containing 0.1 µg/mL CellTracker Green (Invitrogen) at 37 °C and 5% (vol/vol) CO2, washed, and incubated for another 30 min in 1 mL of RPMI-1640/10% (vol/vol) heat-inactivated FCS/2 mM l-glutamine/1 mM Na-pyruvate at 37 °C and 5% (vol/vol) CO2; 10 × 106 NK cells were stained for 30 min at 37 °C and 5% (vol/vol) CO2 in 1 mL of RPMI-1640/10% (vol/vol) heat-inactivated FCS/2 mM l-glutamine/1 mM Na-pyruvate containing 20 µL/mL PC7-conjugated anti-CD56 (Beckman Coulter), followed by a washing step. NK cells and HBMECs were mixed at a 1:2 effector to target cell ratio with 1 × 10⁵ NK cells and 2 × 10⁵ target cells at 4 °C. Cells were spun down at 20 × g for 3 min, and conjugate formation was stopped by vortexing and fixation of cells using 0.5% paraformaldehyde solution (Merck) after 0, 5, 10, 20, or 30 min of incubation at 37 °C. Conjugate formation was determined by flow cytometry (Gallios; Beckman Coulter) and is represented as the fraction of CD56+ NK cells that shifted into two-color conjugates.
Migration Assay.
Migration assays were performed as previously described (73). Briefly, HBMECs were grown for 3–4 d at 37 °C and 5% (vol/vol) CO2 on polyester membrane-bottom transwell inserts (3-µm pore size; Corning) until a confluent monolayer was achieved. The confluence of the HBMEC monolayer was monitored by testing its permeability for Evans Blue (Sigma) (Fig. S2). HBMECs were stimulated with 500 IU/mL IFN-γ (Peprotech) and TNF-α (Peprotech) 24 h prior to the assay. Following washing of the transwell system 5 × 10⁵ thawed PBMCs resuspended in RPMI-1640/2% B27 (Gibco) were added to the upper compartment and the transmigration of CD56bright and CD56dim NK cell subsets across the HBMEC monolayer after 6 h was determined by flow cytometry using flow count fluorospheres (Beckman Coulter), PC5.5-conjugated CD3 (Biolegend), PC7-conjugated CD56 (Beckman Coulter), and APC-A750–conjugated CD16 (Beckman Coulter) antibodies. A well containing 5 × 10⁵ thawed PBMCs in 700 µL of RPMI-1640/2% B27 served as an in vitro control. The percentage of migrated cells for each cell type was calculated after the following equation:
Degranulation Assay.
Release of cytolytic granules by NK cells was determined using an effector to target cell ratio of 1:1 as previously described (70) with minor modifications. Briefly, 2 × 10⁶/mL PBMCs, NK cells, or NK cells plus DCs (5/1) were stimulated for either 7 d with 10 IU/mL IL-2 with or without 10 µg/mL DAC HYP (Biogen) or 2 d with 10 ng/mL IL-15; 2 × 10⁵ stimulated cells were added to 2 × 10⁵ target cells (K562, 721.221, IL-2–activated, or IL-2– plus SEB-activated CD4+ T cells in a total volume of 100 µL of RPMI-1640 supplemented with 2 mM l-glutamine, 1 mM Na-pyruvate, and 10% (vol/vol) heat-inactivated FCS, 10 µL/mL FITC-conjugated anti-CD107a (BD Pharmingen), 10 µL/mL PerCP/Cy5.5-conjugated CD3 (Biolegend), 10 µL/mL PC7-conjugated CD56 (Beckman Coulter), and 6 µg/mL monensin (Sigma)]. Cells were mixed and centrifuged at 18 × g for 3 min, followed by 2 h of incubation at 37 °C/5% (vol/vol) CO2. Afterward, the cells were washed and degranulation of CD56+CD3− NK cells was analyzed by flow cytometry.
Silencing of CD155 Expression in SEB-Activated Primary Human CD4+ T Cells.
PBMCs of healthy individuals were thawed and incubated for 4 d at cell densities of 2 × 10⁶ cells/mL in RPMI-1640 supplemented with 10% (vol/vol) heat-inactivated FCS, 2 mM l-glutamine, 1 mM Na-pyruvate, 200 IU/mL IL-2, and 100 µg/mL SEB at 37 °C and 5% (vol/vol) CO2. PBMCs were harvested on days 2 and 3, centrifuged for 5 min at 300 × g. The supernatant was kept for further cell culture, and cells were washed twice with RPMI and 4 × 10⁶ cells each were resuspended in 200 µL of RPMI supplemented with 8 µg of CD155-specific siRNA [5′-CAACUUUAAUCUGCAACGUdTdTUU-3′ (74)] or ON-TARGETplus nontargeting siRNA #1 (both ThermoScientific). PBMC–siRNA suspensions were transferred into electroporation cuvettes plus no. 640 (4-mm gap; BTX) and transfected with the BTX ECM 830 Square Electroporator using BTX Safety Stand 630B, in low voltage (LV) mode with a single pulse of a voltage of 500 V and 0.8-ms pulse length at room temperature. Afterward, transfected cells were further cultivated in the respective supernatant. On day 4, PBMCs were harvested and CD4+ T cells were isolated as described above. Purity and CD155 expression was checked by flow cytometry using FITC-conjugated anti-CD56 (BD Biosciences), PE-conjugated anti-CD155 (Biolegend), APC-conjugated anti-CD4 (Miltenyi), and BV510-conjugated anti-CD3 (Biolegend) antibodies. CD155-silenced or nonsilenced CD4+ T cells were used as NK target cells in degranulation assays. Untransfected CD4+ T cells served as controls.
Supplementary Material
Acknowledgments
The authors thank all patients included in this study for their participation. The authors also thank Daniela Roosterman, Verena Schütte, Schumina Säuberlich, Kerstin Gottschalk, and Claudia Kemming for excellent technical assistance. This work was supported by German Research Foundation (DFG) Individual Research Grant GR3946 “The Role of NK Cells in the Immune Regulation of MS” (to C.C.G.); DFG Center Grant CRC128 “Multiple Sclerosis” Projects A09 (to H.W.), B01 (to N.S. and H.W.), Z1 (to T.K.), and Z2 (to H.W. and R.H.); the Ministry of Education and Research (BMBF) [German Competence Network MS (Krankheitsbezogenes Kompetenznetz MS - KKNMS)]; a grant from the “Stiftung Neuromedizin” (to C.C.G. and L.K.); Biogen; and the DFG EXC 1003 Cells in Motion (CiM) – Cluster of Excellence (to H.W. and S.G.M.).
Footnotes
Conflict of interest statement: A.S.-M., A.R., A.P.-F., T.S.-H., S.H., K.H., M.K., M.H., K.D., R.H., and T.Z. have no financial disclosures. C.C.G. received speaker honoraria and travel expenses for attending meetings from Bayer Health Care, Genzyme, and Novartis Pharma GmbH. T.K. received honoraria for lectures from Novartis, Biogen Idec, Teva, Bayer Health Care, EXCEMED, and Sanofi Aventis, and served as a consultant for Genzyme. N.S. received honoraria for advisory boards and travel expenses from Biogen Idec. L.K. received compensation for serving on scientific advisory boards for Genzyme. L.K. received speaker honoraria and travel support from Novartis, Merck Serono, and CSL Behring. L.K. receives research support from Novartis. S.G.M. received honoraria for lecturing, travel expenses for attending meetings, and financial research support from Almirall, Bayer Health Care, Biogen, Genzyme, Merck Serono, Novartis, Novo Nordisk, Roche, Sanofi-Aventis, and Teva. H.W. received compensation for serving on Scientific Advisory Boards/Steering Committees for Bayer Healthcare, Biogen Idec, Genzyme, Merck Serono, Novartis, and Sanofi Aventis. H.W. also received speaker honoraria and travel support from Bayer Vital GmbH, Bayer Schering AG, Biogen Idec, CSL Behring, Fresenius Medical Care, Genzyme, Glaxo Smith Kline, GW Pharmaceuticals, Lundbeck, Merck Serono, Omniamed, Novartis, and Sanofi-Aventis. H.W. received compensation as a consultant from Biogen Idec, Merck Serono, Novartis, and Sanofi-Aventis. H.W. received research support from Bayer Vital, Biogen Idec, Genzyme Merck Serono, Novartis, Sanofi-Aventis Germany, and Sanofi US.
This article is a PNAS Direct Submission.
This article contains supporting information online at www.pnas.org/lookup/suppl/doi:10.1073/pnas.1524924113/-/DCSupplemental.
References
- 1.Dendrou CA, Fugger L, Friese MA. Immunopathology of multiple sclerosis. Nat Rev Immunol. 2015;15(9):545–558. doi: 10.1038/nri3871. [DOI] [PubMed] [Google Scholar]
- 2.Kingwell E, et al. Incidence and prevalence of multiple sclerosis in Europe: A systematic review. BMC Neurol. 2013;13(128):128. doi: 10.1186/1471-2377-13-128. [DOI] [PMC free article] [PubMed] [Google Scholar]
- 3.Sawcer S, et al. International Multiple Sclerosis Genetics Consortium; Wellcome Trust Case Control Consortium 2 Genetic risk and a primary role for cell-mediated immune mechanisms in multiple sclerosis. Nature. 2011;476(7359):214–219. doi: 10.1038/nature10251. [DOI] [PMC free article] [PubMed] [Google Scholar]
- 4.Wiendl H, Gross CC. Modulation of IL-2Rα with daclizumab for treatment of multiple sclerosis. Nat Rev Neurol. 2013;9(7):394–404. doi: 10.1038/nrneurol.2013.95. [DOI] [PubMed] [Google Scholar]
- 5.Cerboni C, et al. Antigen-activated human T lymphocytes express cell-surface NKG2D ligands via an ATM/ATR-dependent mechanism and become susceptible to autologous NK-cell lysis. Blood. 2007;110(2):606–615. doi: 10.1182/blood-2006-10-052720. [DOI] [PubMed] [Google Scholar]
- 6.Ardolino M, et al. DNAM-1 ligand expression on Ag-stimulated T lymphocytes is mediated by ROS-dependent activation of DNA-damage response: Relevance for NK-T cell interaction. Blood. 2011;117(18):4778–4786. doi: 10.1182/blood-2010-08-300954. [DOI] [PubMed] [Google Scholar]
- 7.Farag SS, Caligiuri MA. Human natural killer cell development and biology. Blood Rev. 2006;20(3):123–137. doi: 10.1016/j.blre.2005.10.001. [DOI] [PubMed] [Google Scholar]
- 8.Molinero LL, Fuertes MB, Rabinovich GA, Fainboim L, Zwirner NW. Activation-induced expression of MICA on T lymphocytes involves engagement of CD3 and CD28. J Leukoc Biol. 2002;71(5):791–797. [PubMed] [Google Scholar]
- 9.Maasho K, Opoku-Anane J, Marusina AI, Coligan JE, Borrego F. NKG2D is a costimulatory receptor for human naive CD8+ T cells. J Immunol. 2005;174(8):4480–4484. doi: 10.4049/jimmunol.174.8.4480. [DOI] [PubMed] [Google Scholar]
- 10.Bielekova B, et al. Regulatory CD56(bright) natural killer cells mediate immunomodulatory effects of IL-2Ralpha-targeted therapy (daclizumab) in multiple sclerosis. Proc Natl Acad Sci USA. 2006;103(15):5941–5946. doi: 10.1073/pnas.0601335103. [DOI] [PMC free article] [PubMed] [Google Scholar]
- 11.Cerboni C, Ardolino M, Santoni A, Zingoni A. Detuning CD8+ T lymphocytes by down-regulation of the activating receptor NKG2D: Role of NKG2D ligands released by activated T cells. Blood. 2009;113(13):2955–2964. doi: 10.1182/blood-2008-06-165944. [DOI] [PubMed] [Google Scholar]
- 12.Cella M, et al. CHAVI Clinical Core B; NIAID Center for HIV/AIDS Vaccine Immunology Loss of DNAM-1 contributes to CD8+ T-cell exhaustion in chronic HIV-1 infection. Eur J Immunol. 2010;40(4):949–954. doi: 10.1002/eji.200940234. [DOI] [PMC free article] [PubMed] [Google Scholar]
- 13.Lanier LL. Up on the tightrope: Natural killer cell activation and inhibition. Nat Immunol. 2008;9(5):495–502. doi: 10.1038/ni1581. [DOI] [PMC free article] [PubMed] [Google Scholar]
- 14.Andresen L, Jensen H, Pedersen MT, Hansen KA, Skov S. Molecular regulation of MHC class I chain-related protein A expression after HDAC-inhibitor treatment of Jurkat T cells. J Immunol. 2007;179(12):8235–8242. doi: 10.4049/jimmunol.179.12.8235. [DOI] [PubMed] [Google Scholar]
- 15.Matusali G, Potestà M, Santoni A, Cerboni C, Doria M. The human immunodeficiency virus type 1 Nef and Vpu proteins downregulate the natural killer cell-activating ligand PVR. J Virol. 2012;86(8):4496–4504. doi: 10.1128/JVI.05788-11. [DOI] [PMC free article] [PubMed] [Google Scholar]
- 16.Hafler JP, et al. International Multiple Sclerosis Genetics Consortium (IMSGC) CD226 Gly307Ser association with multiple autoimmune diseases. Genes Immun. 2009;10(1):5–10. doi: 10.1038/gene.2008.82. [DOI] [PMC free article] [PubMed] [Google Scholar]
- 17.Alcina A, et al. The autoimmune disease-associated KIF5A, CD226 and SH2B3 gene variants confer susceptibility for multiple sclerosis. Genes Immun. 2010;11(5):439–445. doi: 10.1038/gene.2010.30. [DOI] [PubMed] [Google Scholar]
- 18.Qiu ZX, Zhang K, Qiu XS, Zhou M, Li WM. CD226 Gly307Ser association with multiple autoimmune diseases: A meta-analysis. Hum Immunol. 2013;74(2):249–255. doi: 10.1016/j.humimm.2012.10.009. [DOI] [PubMed] [Google Scholar]
- 19.Nielsen N, Ødum N, Ursø B, Lanier LL, Spee P. Cytotoxicity of CD56(bright) NK cells towards autologous activated CD4+ T cells is mediated through NKG2D, LFA-1 and TRAIL and dampened via CD94/NKG2A. PLoS One. 2012;7(2):e31959. doi: 10.1371/journal.pone.0031959. [DOI] [PMC free article] [PubMed] [Google Scholar]
- 20.Cooper MA, Fehniger TA, Caligiuri MA. The biology of human natural killer-cell subsets. Trends Immunol. 2001;22(11):633–640. doi: 10.1016/s1471-4906(01)02060-9. [DOI] [PubMed] [Google Scholar]
- 21.Cooper MA, et al. Human natural killer cells: A unique innate immunoregulatory role for the CD56(bright) subset. Blood. 2001;97(10):3146–3151. doi: 10.1182/blood.v97.10.3146. [DOI] [PubMed] [Google Scholar]
- 22.Perini P, et al. Effect of IFNbeta and anti-IFNbeta antibodies on NK cells in multiple sclerosis patients. J Neuroimmunol. 2000;105(1):91–95. doi: 10.1016/s0165-5728(00)00196-x. [DOI] [PubMed] [Google Scholar]
- 23.Saraste M, Irjala H, Airas L. Expansion of CD56Bright natural killer cells in the peripheral blood of multiple sclerosis patients treated with interferon-beta. Neurol Sci. 2007;28(3):121–126. doi: 10.1007/s10072-007-0803-3. [DOI] [PubMed] [Google Scholar]
- 24.Vandenbark AA, et al. Interferon-beta-1a treatment increases CD56bright natural killer cells and CD4+CD25+ Foxp3 expression in subjects with multiple sclerosis. J Neuroimmunol. 2009;215(1-2):125–128. doi: 10.1016/j.jneuroim.2009.08.007. [DOI] [PubMed] [Google Scholar]
- 25.Sand KL, Knudsen E, Rolin J, Al-Falahi Y, Maghazachi AA. Modulation of natural killer cell cytotoxicity and cytokine release by the drug glatiramer acetate. Cell Mol Life Sci. 2009;66(8):1446–1456. doi: 10.1007/s00018-009-8726-1. [DOI] [PMC free article] [PubMed] [Google Scholar]
- 26.Putzki N, Baranwal MK, Tettenborn B, Limmroth V, Kreuzfelder E. Effects of natalizumab on circulating B cells, T regulatory cells and natural killer cells. Eur Neurol. 2010;63(5):311–317. doi: 10.1159/000302687. [DOI] [PubMed] [Google Scholar]
- 27.Skarica M, Eckstein C, Whartenby KA, Calabresi PA. Novel mechanisms of immune modulation of natalizumab in multiple sclerosis patients. J Neuroimmunol. 2011;235(1-2):70–76. doi: 10.1016/j.jneuroim.2011.02.010. [DOI] [PubMed] [Google Scholar]
- 28.Johnson TA, et al. Reduction of the peripheral blood CD56(bright) NK lymphocyte subset in FTY720-treated multiple sclerosis patients. J Immunol. 2011;187(1):570–579. doi: 10.4049/jimmunol.1003823. [DOI] [PubMed] [Google Scholar]
- 29.Kowarik MC, et al. Differential effects of fingolimod (FTY720) on immune cells in the CSF and blood of patients with MS. Neurology. 2011;76(14):1214–1221. doi: 10.1212/WNL.0b013e3182143564. [DOI] [PubMed] [Google Scholar]
- 30.Martin JF, Perry JS, Jakhete NR, Wang X, Bielekova B. An IL-2 paradox: Blocking CD25 on T cells induces IL-2-driven activation of CD56(bright) NK cells. J Immunol. 2010;185(2):1311–1320. doi: 10.4049/jimmunol.0902238. [DOI] [PMC free article] [PubMed] [Google Scholar]
- 31.Jiang W, Chai NR, Maric D, Bielekova B. Unexpected role for granzyme K in CD56bright NK cell-mediated immunoregulation of multiple sclerosis. J Immunol. 2011;187(2):781–790. doi: 10.4049/jimmunol.1100789. [DOI] [PMC free article] [PubMed] [Google Scholar]
- 32.Kappos L, et al. Daclizumab HYP versus interferon beta-1a in relapsing multiple sclerosis. N Engl J Med. 2015;373(15):1418–1428. doi: 10.1056/NEJMoa1501481. [DOI] [PubMed] [Google Scholar]
- 33.Bielekova B, et al. Effect of anti-CD25 antibody daclizumab in the inhibition of inflammation and stabilization of disease progression in multiple sclerosis. Arch Neurol. 2009;66(4):483–489. doi: 10.1001/archneurol.2009.50. [DOI] [PMC free article] [PubMed] [Google Scholar]
- 34.Bielekova B, et al. Intrathecal effects of daclizumab treatment of multiple sclerosis. Neurology. 2011;77(21):1877–1886. doi: 10.1212/WNL.0b013e318239f7ef. [DOI] [PMC free article] [PubMed] [Google Scholar]
- 35.Wynn D, et al. CHOICE investigators Daclizumab in active relapsing multiple sclerosis (CHOICE study): A phase 2, randomised, double-blind, placebo-controlled, add-on trial with interferon beta. Lancet Neurol. 2010;9(4):381–390. doi: 10.1016/S1474-4422(10)70033-8. [DOI] [PubMed] [Google Scholar]
- 36.Caligiuri MA. Human natural killer cells. Blood. 2008;112(3):461–469. doi: 10.1182/blood-2007-09-077438. [DOI] [PMC free article] [PubMed] [Google Scholar]
- 37.Man S, Ubogu EE, Ransohoff RM. Inflammatory cell migration into the central nervous system: A few new twists on an old tale. Brain Pathol. 2007;17(2):243–250. doi: 10.1111/j.1750-3639.2007.00067.x. [DOI] [PMC free article] [PubMed] [Google Scholar]
- 38.Schneider-Hohendorf T, et al. VLA-4 blockade promotes differential routes into human CNS involving PSGL-1 rolling of T cells and MCAM-adhesion of TH17 cells. J Exp Med. 2014;211(9):1833–1846. doi: 10.1084/jem.20140540. [DOI] [PMC free article] [PubMed] [Google Scholar]
- 39.Zingoni A, Ardolino M, Santoni A, Cerboni C. NKG2D and DNAM-1 activating receptors and their ligands in NK-T cell interactions: Role in the NK cell-mediated negative regulation of T cell responses. Front Immunol. 2013;3(408):408. doi: 10.3389/fimmu.2012.00408. [DOI] [PMC free article] [PubMed] [Google Scholar]
- 40.Kim HS, Das A, Gross CC, Bryceson YT, Long EO. Synergistic signals for natural cytotoxicity are required to overcome inhibition by c-Cbl ubiquitin ligase. Immunity. 2010;32(2):175–186. doi: 10.1016/j.immuni.2010.02.004. [DOI] [PMC free article] [PubMed] [Google Scholar]
- 41.Kim HS, Long EO. Complementary phosphorylation sites in the adaptor protein SLP-76 promote synergistic activation of natural killer cells. Sci Signal. 2012;5(232):ra49. doi: 10.1126/scisignal.2002754. [DOI] [PMC free article] [PubMed] [Google Scholar]
- 42.Hamann I, et al. Characterization of natural killer cells in paired CSF and blood samples during neuroinflammation. J Neuroimmunol. 2013;254(1-2):165–169. doi: 10.1016/j.jneuroim.2012.08.009. [DOI] [PubMed] [Google Scholar]
- 43.Burshtyn DN, Shin J, Stebbins C, Long EO. Adhesion to target cells is disrupted by the killer cell inhibitory receptor. Curr Biol. 2000;10(13):777–780. doi: 10.1016/s0960-9822(00)00568-6. [DOI] [PubMed] [Google Scholar]
- 44.Yednock TA, et al. Prevention of experimental autoimmune encephalomyelitis by antibodies against α 4 β 1 integrin. Nature. 1992;356(6364):63–66. doi: 10.1038/356063a0. [DOI] [PubMed] [Google Scholar]
- 45.Flodström-Tullberg M, Bryceson YT, Shi FD, Höglund P, Ljunggren HG. Natural killer cells in human autoimmunity. Curr Opin Immunol. 2009;21(6):634–640. doi: 10.1016/j.coi.2009.09.012. [DOI] [PubMed] [Google Scholar]
- 46.Lünemann A, Lünemann JD, Münz C. Regulatory NK-cell functions in inflammation and autoimmunity. Mol Med. 2009;15(9-10):352–358. doi: 10.2119/molmed.2009.00035. [DOI] [PMC free article] [PubMed] [Google Scholar]
- 47.Fogel LA, Yokoyama WM, French AR. Natural killer cells in human autoimmune disorders. Arthritis Res Ther. 2013;15(4):216. doi: 10.1186/ar4232. [DOI] [PMC free article] [PubMed] [Google Scholar]
- 48.Gandhi R, Laroni A, Weiner HL. Role of the innate immune system in the pathogenesis of multiple sclerosis. J Neuroimmunol. 2010;221(1-2):7–14. doi: 10.1016/j.jneuroim.2009.10.015. [DOI] [PMC free article] [PubMed] [Google Scholar]
- 49.de Andrade LF, Smyth MJ, Martinet L. DNAM-1 control of natural killer cells functions through nectin and nectin-like proteins. Immunol Cell Biol. 2014;92(3):237–244. doi: 10.1038/icb.2013.95. [DOI] [PubMed] [Google Scholar]
- 50.Bryceson YT, March ME, Ljunggren HG, Long EO. Synergy among receptors on resting NK cells for the activation of natural cytotoxicity and cytokine secretion. Blood. 2006;107(1):159–166. doi: 10.1182/blood-2005-04-1351. [DOI] [PMC free article] [PubMed] [Google Scholar]
- 51.Yamashita-Kanemaru Y, et al. CD155 (PVR/Necl5) mediates a costimulatory signal in CD4+ T cells and regulates allergic inflammation. J Immunol. 2015;194(12):5644–5653. doi: 10.4049/jimmunol.1401942. [DOI] [PubMed] [Google Scholar]
- 52.Enqvist M, et al. Coordinated expression of DNAM-1 and LFA-1 in educated NK cells. J Immunol. 2015;194(9):4518–4527. doi: 10.4049/jimmunol.1401972. [DOI] [PubMed] [Google Scholar]
- 53.Carlsten M, et al. Primary human tumor cells expressing CD155 impair tumor targeting by down-regulating DNAM-1 on NK cells. J Immunol. 2009;183(8):4921–4930. doi: 10.4049/jimmunol.0901226. [DOI] [PubMed] [Google Scholar]
- 54.Chan CJ, et al. The receptors CD96 and CD226 oppose each other in the regulation of natural killer cell functions. Nat Immunol. 2014;15(5):431–438. doi: 10.1038/ni.2850. [DOI] [PubMed] [Google Scholar]
- 55.Stanietsky N, et al. The interaction of TIGIT with PVR and PVRL2 inhibits human NK cell cytotoxicity. Proc Natl Acad Sci USA. 2009;106(42):17858–17863. doi: 10.1073/pnas.0903474106. [DOI] [PMC free article] [PubMed] [Google Scholar]
- 56.Chan A, et al. CD56bright human NK cells differentiate into CD56dim cells: Role of contact with peripheral fibroblasts. J Immunol. 2007;179(1):89–94. doi: 10.4049/jimmunol.179.1.89. [DOI] [PubMed] [Google Scholar]
- 57.Huntington ND, et al. IL-15 trans-presentation promotes human NK cell development and differentiation in vivo. J Exp Med. 2009;206(1):25–34. doi: 10.1084/jem.20082013. [DOI] [PMC free article] [PubMed] [Google Scholar]
- 58.Perry JS, et al. Inhibition of LTi cell development by CD25 blockade is associated with decreased intrathecal inflammation in multiple sclerosis. Sci Transl Med. 2012;4(145):145ra106. doi: 10.1126/scitranslmed.3004140. [DOI] [PMC free article] [PubMed] [Google Scholar]
- 59.Kasaian MT, et al. IL-21 limits NK cell responses and promotes antigen-specific T cell activation: A mediator of the transition from innate to adaptive immunity. Immunity. 2002;16(4):559–569. doi: 10.1016/s1074-7613(02)00295-9. [DOI] [PubMed] [Google Scholar]
- 60.Li Q, et al. Multiple effects of IL-21 on human NK cells in ex vivo expansion. Immunobiology. 2015;220(7):876–888. doi: 10.1016/j.imbio.2015.01.009. [DOI] [PubMed] [Google Scholar]
- 61.Shi FD, Van Kaer L. Reciprocal regulation between natural killer cells and autoreactive T cells. Nat Rev Immunol. 2006;6(10):751–760. doi: 10.1038/nri1935. [DOI] [PubMed] [Google Scholar]
- 62.Gold R, et al. SELECT study investigators Daclizumab high-yield process in relapsing-remitting multiple sclerosis (SELECT): A randomised, double-blind, placebo-controlled trial. Lancet. 2013;381(9884):2167–2175. doi: 10.1016/S0140-6736(12)62190-4. [DOI] [PubMed] [Google Scholar]
- 63.Martínez-Rodríguez JE, et al. Natural killer receptors distribution in multiple sclerosis: Relation to clinical course and interferon-beta therapy. Clin Immunol. 2010;137(1):41–50. doi: 10.1016/j.clim.2010.06.002. [DOI] [PubMed] [Google Scholar]
- 64.Wuest SC, et al. A role for interleukin-2 trans-presentation in dendritic cell-mediated T cell activation in humans, as revealed by daclizumab therapy. Nat Med. 2011;17(5):604–609. doi: 10.1038/nm.2365. [DOI] [PMC free article] [PubMed] [Google Scholar]
- 65.Dubois S, Mariner J, Waldmann TA, Tagaya Y. IL-15Ralpha recycles and presents IL-15 In trans to neighboring cells. Immunity. 2002;17(5):537–547. doi: 10.1016/s1074-7613(02)00429-6. [DOI] [PubMed] [Google Scholar]
- 66.Anton OM, Vielkind S, Peterson ME, Tagaya Y, Long EO. NK Cell Proliferation Induced by IL-15 Transpresentation Is Negatively Regulated by Inhibitory Receptors. J Immunol. 2015;195(10):4810–4821. doi: 10.4049/jimmunol.1500414. [DOI] [PMC free article] [PubMed] [Google Scholar]
- 67.Polman CH, et al. Diagnostic criteria for multiple sclerosis: 2010 revisions to the McDonald criteria. Ann Neurol. 2011;69(2):292–302. doi: 10.1002/ana.22366. [DOI] [PMC free article] [PubMed] [Google Scholar]
- 68.Brück W, et al. Monocyte/macrophage differentiation in early multiple sclerosis lesions. Ann Neurol. 1995;38(5):788–796. doi: 10.1002/ana.410380514. [DOI] [PubMed] [Google Scholar]
- 69.Posevitz-Fejfár A, et al. Effects of blood transportation on human peripheral mononuclear cell yield, phenotype and function: Implications for immune cell biobanking. PLoS One. 2014;9(12):e115920. doi: 10.1371/journal.pone.0115920. [DOI] [PMC free article] [PubMed] [Google Scholar]
- 70.Martinez E, Brzostowski JA, Long EO, Gross CC. Cutting edge: NKG2D-dependent cytotoxicity is controlled by ligand distribution in the target cell membrane. J Immunol. 2011;186(10):5538–5542. doi: 10.4049/jimmunol.1002254. [DOI] [PMC free article] [PubMed] [Google Scholar]
- 71.Lueg G, et al. Clinical relevance of specific T-cell activation in the blood and cerebrospinal fluid of patients with mild Alzheimer’s disease. Neurobiol Aging. 2015;36(1):81–89. doi: 10.1016/j.neurobiolaging.2014.08.008. [DOI] [PubMed] [Google Scholar]
- 72.Gross CC, Brzostowski JA, Liu D, Long EO. Tethering of intercellular adhesion molecule on target cells is required for LFA-1-dependent NK cell adhesion and granule polarization. J Immunol. 2010;185(5):2918–2926. doi: 10.4049/jimmunol.1000761. [DOI] [PMC free article] [PubMed] [Google Scholar]
- 73.Grützke B, et al. Fingolimod treatment promotes regulatory phenotype and function of B cells. Ann Clin Transl Neurol. 2015;2(2):119–130. doi: 10.1002/acn3.155. [DOI] [PMC free article] [PubMed] [Google Scholar]
- 74.Sloan KE, et al. CD155/PVR plays a key role in cell motility during tumor cell invasion and migration. BMC Cancer. 2004;4(73):73. doi: 10.1186/1471-2407-4-73. [DOI] [PMC free article] [PubMed] [Google Scholar]
Associated Data
This section collects any data citations, data availability statements, or supplementary materials included in this article.