Significance
Tumor antigen presentation to CD8+ T cells by MHC class I molecules is crucial for immune responses against cancers, whereas the loss of MHC class I is a common immune evasion strategy used by cancers. However, the molecular mechanisms leading to MHC class I deficiency have remained poorly defined. We demonstrate here that MHC class I transactivator (CITA)/NOD-like receptor (NLR) family, caspase recruitment (CARD) domain containing 5 (NLRC5) is a major target for cancer immune evasion. Reduced expression of MHC class I and related genes in cancer is frequently associated with genetic and epigenetic changes in NLRC5. The reduced NLRC5 expression is linked to impaired CD8+ T-cell activation and poor patient prognosis. These data indicate that CITA/NLRC5 is a novel prognostic marker and potential therapeutic target of cancers.
Keywords: MHC class I, CITA, cancer, immune evasion, NLRC5
Abstract
Cancer cells develop under immune surveillance, thus necessitating immune escape for successful growth. Loss of MHC class I expression provides a key immune evasion strategy in many cancers, although the molecular mechanisms remain elusive. MHC class I transactivator (CITA), known as “NLRC5” [NOD-like receptor (NLR) family, caspase recruitment (CARD) domain containing 5], has recently been identified as a critical transcriptional coactivator of MHC class I gene expression. Here we show that the MHC class I transactivation pathway mediated by CITA/NLRC5 constitutes a target for cancer immune evasion. In all the 21 tumor types we examined, NLRC5 expression was highly correlated with the expression of MHC class I, with cytotoxic T-cell markers, and with genes in the MHC class I antigen-presentation pathway, including LMP2/LMP7, TAP1, and β2-microglobulin. Epigenetic and genetic alterations in cancers, including promoter methylation, copy number loss, and somatic mutations, were most prevalent in NLRC5 among all MHC class I-related genes and were associated with the impaired expression of components of the MHC class I pathway. Strikingly, NLRC5 expression was significantly associated with the activation of CD8+ cytotoxic T cells and patient survival in multiple cancer types. Thus, NLRC5 constitutes a novel prognostic biomarker and potential therapeutic target of cancers.
During cancer progression, neoplastic cells accumulate numerous mutations that constitute potentially immunogenic neo-epitopes. Thus, most tumors concurrently need to use mechanisms that enable escape from immune surveillance for successful growth and progression (1). It has been demonstrated that cancer cells use multiple strategies of immune evasion, including increased resistance to cytotoxic T-cell killing, induction of anergy in activated T cells, elimination of effector T cells, recruitment of regulatory immune cell subsets, and reduced recognition of tumor-associated antigens by effector T cells (2). Impaired MHC class I-mediated antigen presentation is a major immune evasion mechanism in cancer (3, 4), with MHC class I loss reported in cervical cancer (92%) (5), penile cancer (80%) (6), breast cancer (71%) (7), nonsmall cell lung cancer (64%) (8), and esophageal squamous cell carcinoma (67%) (9), among others. Although a number of mechanisms have been described for HLA loss, including the loss of heterozygosity, HLA gene methylation, nonsense/missense mutations, and loss of TAP1/2 or β2-microglobulin (B2M), the dominant underlying molecular mechanism seems to reside at the transcriptional level (10). Transcriptional regulation of MHC class I genes remained largely undefined until the recent discovery of CITA (MHC class I transactivator), known as NLRC5 [NOD-like receptor (NLR) family, caspase recruitment (CARD) domain containing 5] (11, 12). NLRC5 is an IFN-γ–inducible nuclear protein (13–15) that specifically associates with and activates promoters of MHC class I genes by generating a CITA enhanceosome complex with other transcription factors (14, 16, 17). A striking feature of CITA/NLRC5 is that it does not solely induce MHC class I genes but also activates other critical genes involved in the MHC class I antigen-presentation pathway, including the immunoproteasome component LMP2 (PSMB9), peptide transporter TAP1, and B2M (14, 17), thus regulating most of the key components in the MHC class I antigen-presentation machinery. Nlrc5-deficient mice exhibit impaired constitutive and inducible expression of MHC class I genes in vivo (18–22). In addition, Nlrc5-deficient cells display an impaired ability to elicit CD8+ T-cell activation, as evidenced by impaired IFN-γ production and diminished cytolytic activity (18, 19, 21).
Results
Expression of NLRC5 and MHC Class I Genes Is Correlated in Human Cancers.
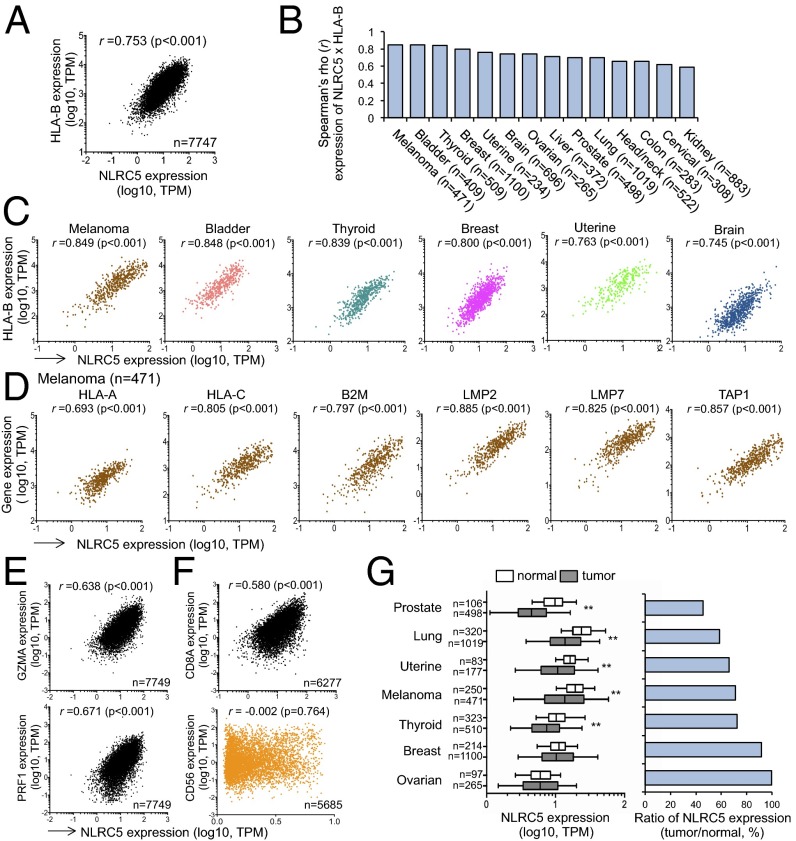
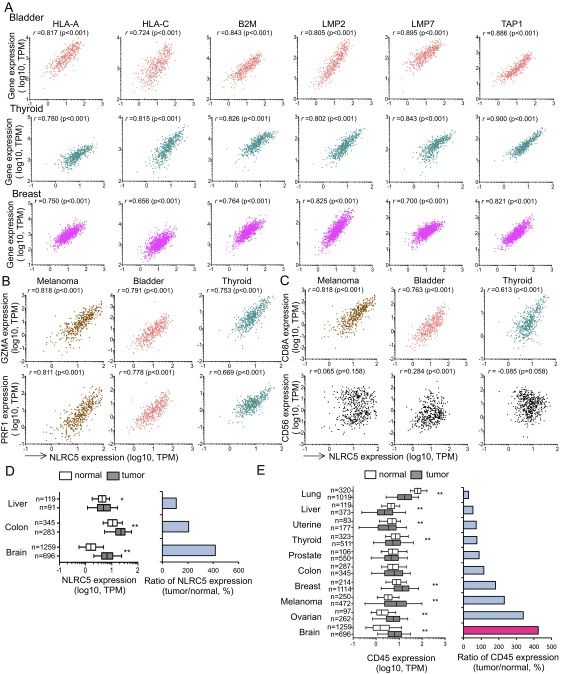
Because of the prominent role of NLRC5 in orchestrating the expression of MHC class I and class I-related genes, we examined gene-expression profiles of biopsy samples from the cohort of 7,747 solid cancer patients in The Cancer Genome Atlas (TCGA) database. The expression of HLA-B was highly correlated with the level of NLRC5 expression in the entire cohort (rs = 0.753) (Fig. 1A). Correlation analysis for gene expression among 14 cancer types demonstrated that HLA-B and NLRC5 expression showed high positive correlation (rs > 0.70) in nine cancer types and intermediate positive correlation (rs > 0.50) in five cancer types (Fig. 1 B and C), with the highest correlation observed in melanoma. In addition to HLA-B, the expression of HLA-A, HLA-C, B2M, LMP2, LMP7 (PSMB8), and TAP1 was also highly correlated with NLRC5 expression in melanoma and other cancers (Fig. 1D and Fig. S1A). Because CITA/NLRC5-mediated MHC class I expression is crucial for optimal activation and cytolytic activity of CD8+ T cells (18, 19), we next examined the expression level of perforin (PRF1) or granzyme A (GZMA), which are known to be associated with cytotoxic T-cell activity in cancer tissues (23). Indeed, the cohort of 16 solid cancer etiologies revealed a significant positive correlation between NLRC5 expression and PRF1 or GZMA (Fig. 1E and Fig. S1B). Although PRF1 and GZMA are expressed in both activated CD8+ T cells and natural killer (NK) cells, NLRC5 expression was correlated only with CD8A but not with the NK cell marker CD56 (Fig. 1F and Fig. S1C). These data indicate that NLRC5 expression in cancer tissues is critical for inducing CD8+ T-cell–dependent cytotoxic activity, likely through the induction of MHC class I expression. Despite the critical function of NLRC5 for MHC class I-dependent immune responses, there are likely to be aberrant mechanisms which may reduce NLRC5 expression in cancers, as indicated by decreased NLRC5 expression in multiple cancer types compared with normal tissues (Fig. 1G). Three cancer types with higher expression of NLRC5 seemed to be exceptions (Fig. S1D), perhaps because of a high inflammatory state (hepatocellular carcinoma and colorectal carcinoma) (24, 25) or increased infiltration of hematopoietic cells characterized by high CD45 expression (brain tumors) (Fig. S1E).
Fig. 1.
Expressions of NLRC5 and MHC class I genes are positively correlated. (A) Scatter plots for the expression of NLRC5 [x axis; log10 values in transcripts per million (TPM)] and HLA-B (y axis; log10 values in TPM) in 16 tumor types (n = 7,747). (B) Spearman rank correlation coefficients between the expression of NLRC5 and HLA-B. Fourteen representative tumor types carrying at least 100 samples are shown. (C) Scatter plots for the expression of NLRC5 and HLA-B in six tumor types showing high correlation coefficients. (D) Scatter plots for the expression of NLRC5 and other MHC class I-related genes in melanoma that have the highest correlation coefficients in B. (E) Scatter plots for the expression of NLRC5 and GZMA or PRF1 in 16 tumor types (n = 7,749). (F) Scatter plots for the expression of NLRC5 and CD8A in 16 tumor types (n = 6,277) or CD56 in 15 tumor types (n = 5,685). Pairwise correlations in A–F were calculated using the Spearman’s ranked correlation test; r, Spearman rho coefficient. (G, Left) NLRC5 expression in indicated normal and tumor tissues. The bar inside the box corresponds to the median; the box corresponds to the 25th–75th percentiles, and the error bars indicate the confidence interval (fifth–95th percentile). Statistical significance was determined by the Mann–Whitney test: **P < 0.01. (Right) The ratio of NLRC5 expression level in tumor and normal tissues.
Fig. S1.
Expression of NLRC5 and MHC class I genes is positively correlated. (A) Scatter plots for the expression of NLRC5 (x axis; log10 values in TPM) and other MHC class I-related genes (y axis; log10 values in TPM) in biopsy samples from patients with bladder cancer (Top Row), thyroid cancer (Middle Row), and breast cancer (Bottom Row). (B) Scatter plots for the expression of NLRC5 and GZMA (Upper Row) or PRF1 (Lower Row) for the three indicated tumor types. (C) Scatter plots for the expression of NLRC5 and CD8A (Upper Row) or CD56 (Lower Row) for the three indicated tumor types. (D, Left) NLRC5 expression in normal and tumor tissues. (Right) The ratio of NLRC5 expression level in tumor and normal tissue. (E, Left) CD45 expression in normal and tumor tissues. (Right) The ratio of CD45 expression level in tumor and normal tissue. In A–C pairwise correlations were calculated using the Spearman’s ranked correlation test. r, Spearman rho coefficient. In D and E the bar inside the box corresponds to the median, the box represents the 25th–75th percentile and the error bars indicate the confidence interval (fifth–95th percentile). Statistical significance was determined by the Mann–Whitney test: *P < 0.05; **P < 0.01.
Preferential Methylation of NLRC5 in Cancer Is Associated with Impaired Cytotoxic T-Lymphocyte Activity.
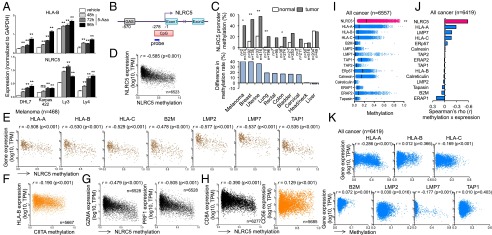
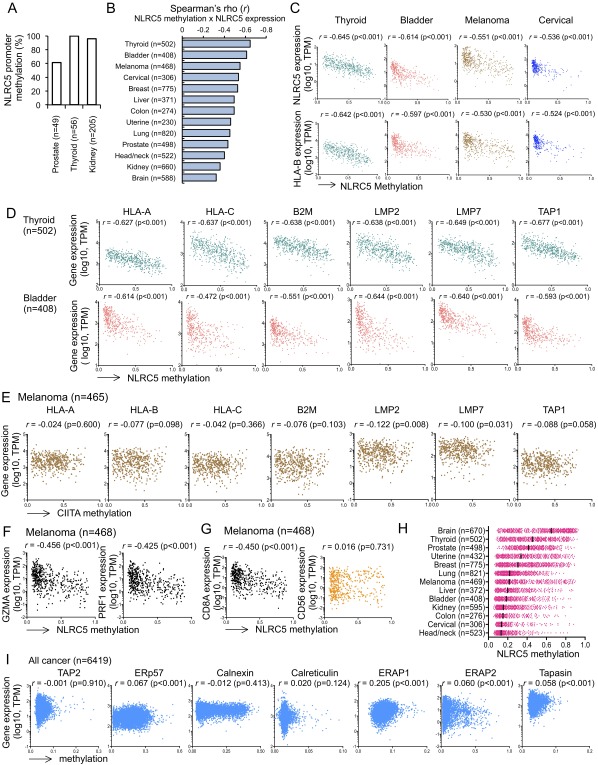
Epigenetic changes in cancer cells represent an important mechanism to alter gene expression in favor of cancer growth and immune evasion (26). Abnormal methylation of CpG islands in promoter regions can transcriptionally suppress genes that are unfavorable for cancer growth (27). Treatment of various cancer cell lines with a DNA-methylation inhibitor, 5-azacitidine (5-Aza), resulted in the up-regulation of NLRC5 and HLA-B expression, suggesting that methylation of the NLRC5 promoter might play a role in the loss of MHC class I expression in cancer (Fig. 2A). Therefore, the level of DNA methylation at a CpG island in the NLRC5 promoter in various cancer types was quantified using a methylation-specific probe (Fig. 2B). Methylation of the NLRC5 promoter was observed at higher frequency in multiple cancers than in the corresponding normal tissues (excluding prostate, thyroid, and kidney, where high methylation was observed even in normal tissues) (Fig. 2C and Fig. S2A). Furthermore, analysis of biopsy samples from 6,523 solid cancer patients revealed that methylation of the NLRC5 promoter was negatively correlated with NLRC5 expression (rs = −0.585) (Fig. 2D). Suppression of NLRC5 expression by promoter methylation was observed in all 13 cancer types that we examined; an intermediate negative correlation (rs = −0.50 to −0.70) was found in five cancer types, and a low negative correlation (rs = −0.30 to −0.50) was found in eight cancer types (Fig. S2 B and C). Moreover, the methylation of the NLRC5 promoter was negatively correlated with the expression of HLA-B in all cancer types to various degrees (Fig. 2E and Fig. S2C). NLRC5 promoter methylation also was negatively correlated with the expression of HLA-A, HLA-C, B2M, LMP2, LMP7, and TAP1 in melanoma and other cancers (Fig. 2E and Fig. S2D). Reduced expression of MHC class I genes was specifically correlated with NLRC5 methylation because methylation of the promoter for CIITA, a master transcriptional activator of MHC class II genes, did not correlate with the expression of HLA-B or other class I-related genes in the entire cancer cohort or in melanoma (Fig. 2F and Fig. S2E). Strikingly, NLRC5 methylation was negatively correlated with CD8A, GZMA, and PRF1 but not with CD56 (Fig. 2 G and H and Fig. S2 F and G). These data suggest that methylation of NLRC5 in cancer cells results in the transcriptional suppression of NLRC5, leading to reduced expression of MHC class I genes and evasion of CD8+ cytotoxic T-cell–dependent antitumor activity. Because HLA gene methylation also has been reported in cancer cells (10), the methylation level of the NLRC5 promoter was compared with that of other MHC class I and related genes. Although various degrees of NLRC5 methylation were observed in all the different cancer types examined (Fig. S2H), the DNA methylation was most severe in NLRC5 among all class I-related genes tested in entire cancer cohort (Fig. 2I). Moreover, methylation of the NLRC5 promoter exhibited the most effective gene suppression among all class I-related genes, because the negative correlation between DNA methylation and gene expression was more prominent for NLRC5 than for other MHC class I-related genes (Fig. 2 D, J, and K and Fig. S2I). Taken together, these data suggest that the methylation of NLRC5, but not of other MHC class I genes, is used selectively in various cancers as an immune evasion strategy for efficient suppression of the MHC class I pathway.
Fig. 2.
Preferential DNA methylation in the NLRC5 promoter in cancer cells is associated with impaired MHC class I-dependent cytotoxic T-cell activity. (A) Indicated cancer cell lines were treated with 3 μM of 5-Aza for the indicated time periods, and NLRC5 and HLA-B expression was quantified by quantitative PCR. Data are representative of three independent experiments and are shown as means ± SD. Statistical significance was determined by the paired t test: **P < 0.01. (B) Schematic representation of the methylation-specific probe on the NLRC5 promoter region. The NLRC5 promoter has a CpG island of ∼578 bp starting at position −278. To examine the methylation status of the NLRC5 promoter, a methylation-specific probe (cg16411857, blue line) on the CpG island was used. The transcription start site is indicated as −1; the STAT1-binding site GAS is at −570. (C, Upper) The methylation rate of the NLRC5 promoter in 10 indicated cancer types and normal tissues. (Lower) The difference in the NLRC5 promoter methylation rate in tumor and normal tissues. A β value over 0.3 was considered as methylated. Statistical significance was determined by the χ2 test: *P < 0.05; **P < 0.01. (D) Scatter plots showing the expression of NLRC5 (y axis; log10 values in TPM) and the methylation level of the NLRC5 promoter (x axis; β values) in 15 tumor types (n = 6,523). (E) Scatter plots for the expression of various MHC class I-related genes and the methylation level of the NLRC5 promoter in melanoma (n = 468). (F) Scatter plots for HLA-B expression and methylation level of CIITA promoter in 15 tumor types (n = 5,667). (G) Scatter plots for the expression of GZMA or PRF1 and the methylation level of the NLRC5 promoter in 15 tumor types (n = 6,528). (H) Scatter plots for CD8A expression in 15 tumor types (n = 6,277) or CD56 expression and methylation level of the NLRC5 promoter in 14 tumor types (n = 5,685). (I) Dot plots for the methylation level of various MHC class I-related genes (x axis; β values) in all cancer types (16 tumor types, n = 6,557). The median values are indicated by vertical bars. Statistical significance was determined by the Mann–Whitney test: **P < 0.01. (J) Spearman rank correlation coefficient between the expression and methylation of indicated MHC class I-related genes in 15 tumor types (n = 6,419). (K) Scatter plots for the expression and methylation level of various MHC class I-related genes in 15 tumor types (n = 6,419). In D–H, J, and K pairwise correlations were calculated using the Spearman’s ranked correlation test. r, Spearman rho coefficient.
Fig. S2.
The methylation level of NLRC5 promoter and the expression of MHC class I genes are negatively correlated. (A) NLRC5 promoter methylation rates in normal tissues carrying high methylation rate. (B) Spearman rank correlation coefficients between NLRC5 expression and DNA methylation of the NLRC5 promoter in 13 tumor types that hold at least 100 samples. (C) Scatter plots for the expression of NLRC5 or HLA-B expression (y axis; log10 values in TPM) and the methylation level of the NLRC5 promoter (x axis; β values) in indicated tumor types showing negative correlation coefficient. (D) Scatter plots for the expression of various MHC class I-related genes and the methylation level of the NLRC5 promoter in thyroid cancer (n = 502) and bladder cancer (n = 408). (E) Scatter plots for the expression of various MHC class I-related genes and the methylation level of the CIITA promoter in melanoma (n = 465). (F) Scatter plots for the expression of GZMA or PRF1 and the methylation level of the NLRC5 promoter in melanoma (n = 468). (G) Scatter plots for the expression of CD8A or CD56 and methylation level of NLRC5 promoter in melanoma (n = 468). (H) Dot plots for the methylation level of the NLRC5 promoter (x axis; β values) in 13 tumor types that hold at least 100 samples. The median values are indicated by bars. (I) Scatter plots for the expression and methylation level of the indicated MHC class I-related genes in 15 tumor types (n = 6,419). In B–G and I pairwise correlations were calculated using the Spearman’s ranked correlation test. r, Spearman rho coefficient.
Copy Number Loss of NLRC5 Is Associated with Reduced MHC Class I Gene Expression.
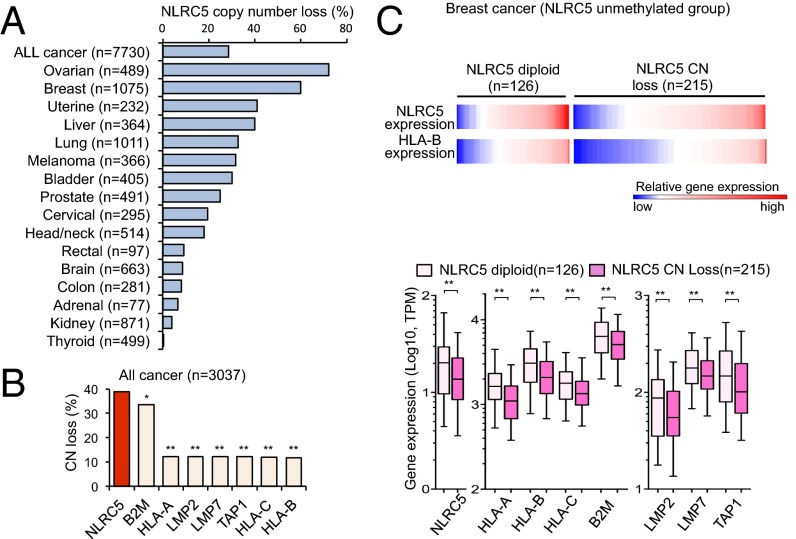
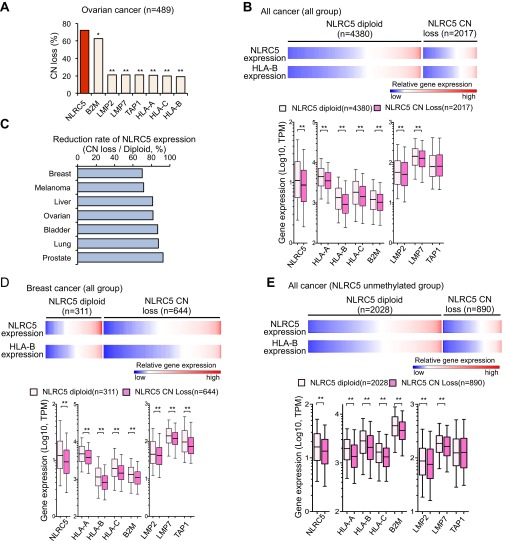
Changes in somatic gene copy number (CN) are frequently observed in cancer cells and are associated with altered gene-expression levels (28, 29). The analysis of CN in the cohort of 7,730 cancer patients showed that all cancer types carry alterations in CN of the NLRC5 gene. CN loss (CN = 0 or 1) was observed in 28.6% of all cancer patients, with the highest frequency (72.2%) in ovarian cancer patients (Fig. 3A). Remarkably, among MHC class I and related genes across the entire cancer cohort and in ovarian cancer, the frequency of CN loss was highest for NLRC5, followed by B2M (Fig. 3B and Fig. S3A), again indicating that NLRC5 is a preferential target for cancer immune evasion among genes involved in the MHC class I pathway. Gene-expression analysis demonstrated that patients with NLRC5 CN loss showed reduced expression levels of NLRC5 and of MHC class I and related genes, including HLA-A, HLA-B, HLA-C, B2M, LMP2, and LMP7 across the entire cancer cohort (Fig. S3B). The various degrees of reduction in NLRC5 and class I gene expression were observed in samples of numerous cancers that had CN loss, with the highest reduction rate found in breast cancer (Fig. S3 C and D). To distinguish the effect of CN loss from that of NLRC5 methylation, cancer groups in which the NLRC5 promoter is not methylated (β value <0.3) were analyzed for gene expression. Again, patients with NLRC5 CN loss exhibited decreased expression of NLRC5 and MHC class I-related genes across the entire cancer cohort and in breast cancer (Fig. 3C and Fig. S3E), indicating that CN loss of NLRC5 results in the reduced expression of the genes involved in the MHC class I pathway independently of the methylation level of the NLRC5 promoter. Collectively, these data indicate that cancer cells selectively lose NLRC5 at a high frequency, resulting in reduced expression of MHC class I and related genes.
Fig. 3.
CN loss in NLRC5 is associated with reduced expression of MHC class I genes. (A) Percentage of cancer patients who carry NLRC5 CN loss among 16 tumor types. Based on GISTIC values, samples were classified into the NLRC5 diploid group (GISTIC 0) and the CN-loss group (GISTIC −1 and −2). (B) Percentage of cancer patients who carry CN loss of various MHC class I-related genes for nine tumor types for which data are available (bladder, breast, colon, head/neck, lung, ovarian, prostate, rectal, and uterine cancer). Statistical significance was determined by the χ2 test: *P < 0.01; **P < 0.0001. (C) Heatmap showing gene expression of NLRC5 and HLA-B in the NLRC5 diploid group (n = 126) and in the CN-loss group (n = 215) for breast cancer patients in which the NLRC5 promoter is not methylated (β values <0.3). The box plots show NLRC5 and MHC class I-related gene expression in the NLRC5 diploid group or in the CN-loss group in breast cancer. The bar inside the box corresponds to the median, the box corresponds to the 25th–75th percentile, and the error bars indicate the confidence interval (fifth–95th percentile). Statistical significance was determined by the Mann–Whitney test: **P < 0.01.
Fig. S3.
CN loss in NLRC5 is associated with reduced MHC class I gene expression. (A) Percentage of cancer patients who carry CN loss of various MHC class I-related genes for ovarian cancer (n = 489). Statistical significance was determined by the χ2 test: *P < 0.01; **P < 0.0001. (B, Upper) Heatmap showing expression of NLRC5 and HLA-B in the NLRC5 diploid group (n = 4,380) or the CN-loss group (n = 2,017) for 16 tumor types. (Lower) Box plots showing NLRC5 and MHC class I-related gene expression in the NLRC5 diploid group or the CN-loss group. (C) Reduction rate of NLRC5 expression calculated by using the mean expression of NLRC5 in the CN-loss group divided by the mean of diploid group in seven tumor types that have at least 100 samples. (D, Upper) Heatmap showing the expression of NLRC5 and HLA-B in the NLRC5 diploid group (n = 311) or in the CN-loss group (n = 644) for breast cancer. (Lower) Box plots showing NLRC5 and MHC class I-related gene expression in the NLRC5 diploid group or in the CN-loss group in breast cancer. (E, Upper) Heatmap showing expression of NLRC5 and HLA-B in the NLRC5 diploid group (n = 2,028) or in the CN-loss group (n = 890) for 15 tumor types in which the NLRC5 promoter is not methylated (β values <0.3). (Lower) Box plots showing NLRC5 and MHC class I-related gene expression in the NLRC5 diploid group or in the CN-loss group. Samples were classified into the NLRC5 diploid group and the CN-loss group based on GISTIC values: GISTIC 0, diploid; −1 and −2, CN loss. In B, D, and E the bar inside the box corresponds to the median, the box corresponds to the 25th–75th percentile, and the error bars indicate the confidence interval (fifth–95th percentile). Statistical significance was determined by the Mann–Whitney test. **P < 0.01.
Somatic Mutations in NLRC5 Are Correlated with Reduced Expression of MHC Class I Genes.
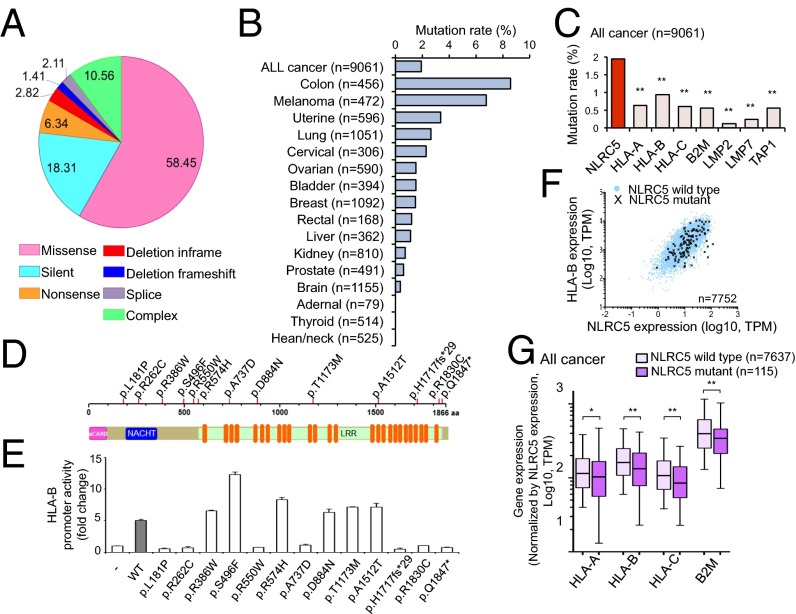
Because somatic mutations are another important molecular mechanism of carcinogenesis (30), biopsy samples from 16 solid cancer types were analyzed for somatic mutations in NLRC5. A total of 142 patients were found to have mutations, most of which (58.5%) were missense mutations (Fig. 4A). Colon cancer patients exhibited the highest NLRC5 mutation rate (8.6%), followed by melanoma (6.8%) (Fig. 4B). Similar to promoter methylation and CN loss, somatic mutations were most frequently observed in NLRC5 among all MHC class I and related genes (Fig. 4C). Mutations were distributed across the entire NLRC5 coding region with no obvious hot spots (Fig. S4). To determine whether those mutations affect NLRC5 function, mutations (n = 13) observed in more than one patient were analyzed for their ability to induce MHC class I gene expression via a reporter gene assay that employs the HLA-B promoter and various NLRC5 expression vectors generated by site-directed mutagenesis (Fig. 4D). As shown in Fig. 4E, 7 of the 13 NLRC5 mutants exhibited complete loss of induction for HLA-B promoter activity, although it is possible that NLRC5 mutants that appeared to be functional in this reporter assay may carry altered function at more physiological settings. The data demonstrate that the majority of NLRC5 mutations in cancer patients are true loss-of-function mutations. Indeed, correlation analysis of HLA-B and NLRC5 expression confirmed the tendency for reduced HLA-B expression levels in patients with NLRC5 mutations compared with patients with wild-type NLRC5 (Fig. 4F). To substantiate this observation further with statistical analysis, we plotted the ratio of MHC class I genes to NLRC5 to reflect gene induction by NLRC5. As expected, the ratio of MHC class I to NLRC5 expression was decreased in the NLRC5 mutant group (Fig. 4G). These data indicate that in multiple cancers somatic mutations occur preferentially in NLRC5 as compared with other MHC class I-related genes and are associated with the reduced expression of genes involved in MHC class I-mediated antigen presentation.
Fig. 4.
Somatic mutations in NLRC5 are correlated with reduced expression of MHC class I genes. (A) Pie chart representing the percentage distribution of different types of mutations in NLRC5 in various cancer patients (n = 7,752). (B) Mutation rate in NLRC5 for 16 tumor types (n = 9,061). (C) Mutation rate in the indicated genes for 16 tumor types. Statistical significance was determined by the χ2 test (n = 9,061): **P < 0.001. (D) Representation of NLRC5 indicating 13 mutations found in at least two different cancer patients. (E) HEK293T cells were cotransfected with either empty control vector or the respective NLRC5 mutant plasmid with HLA-B reporter plasmid, and HLA-B promoter activity was assessed by the dual-luciferase assay and normalized against Renilla firefly activity. Data are representative of two independent experiments performed in duplicate and are plotted as fold induction with respect to the control vector. The error bars indicate SD. (F) Scatter plots for the expression of NLRC5 and HLA-B for the NLRC5 wild-type group (blue circle) and the NLRC5 mutant group (black cross) in 16 tumor types (n = 7,752). (G) Box plots for the expression level of MHC class I-related genes normalized by the expression level of NLRC5 in 16 tumor types that are either NLRC5 wild type or NLRC5 mutant. The bar inside the box corresponds to the median; the box corresponds to the 25th–75th percentile, and the error bars indicate the confidence interval (fifth–95th percentile). Statistical significance was determined by the Mann–Whitney test: *P < 0.05; **P < 0.01.
Fig. S4.
Somatic mutation in NLRC5. Positional representation of 161 mutations in NLRC5. The black bars represent mutations found in one patient. The red bars represent mutations found in at least two different patients.
The Expression of NLRC5 Is Correlated with Survival of Cancer Patients.
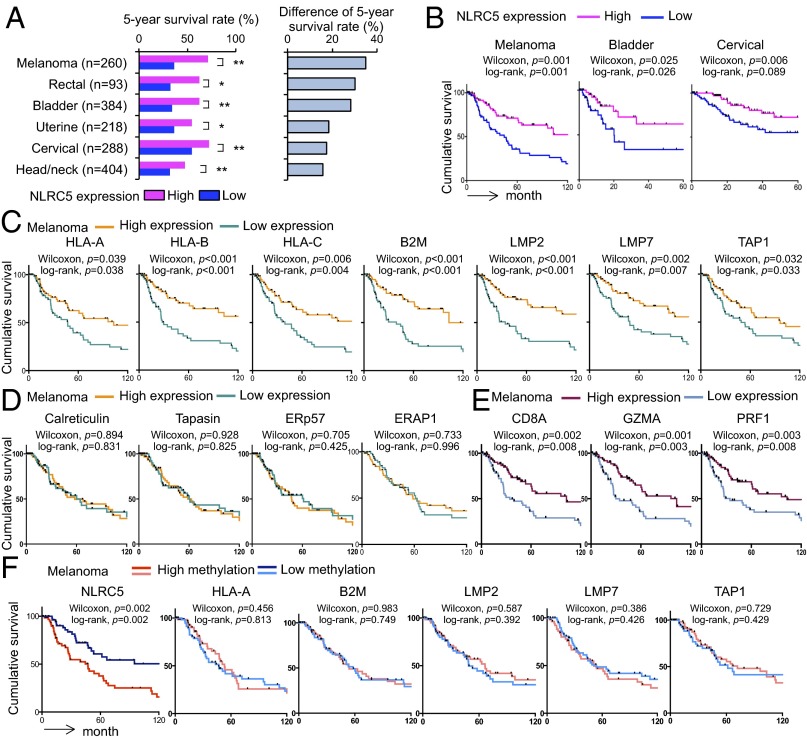
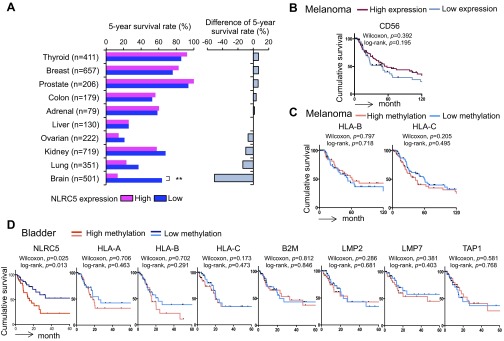
Because MHC class I expression and cytotoxic CD8+ T-cell infiltration in tumors are critical for immunological defense in cancer patients, we analyzed the effect of NLRC5 on overall survival. Cancer patients were stratified into quartiles based on NLRC5 expression. The analysis of 5-year survival of patients with 16 different cancer types revealed that the quartile with highest NLRC5 expression showed significantly better survival than the quartile with lowest NLRC5 expression in six cancer types (melanoma, rectal cancer, bladder cancer, uterine cancer, cervical cancer, and head/neck cancer) (Fig. 5A and Fig. S5A). Kaplan–Meier survival analysis also demonstrated that the high NLRC5 expression was associated with significantly improved cumulative survival in melanoma, bladder cancer, and cervical cancer (Fig. 5B). The most striking differences were seen in melanoma and bladder cancer, with 5-year survival rates of 36% and 34%, respectively, in the NLRC5-low group compared with 71% and 62%, respectively, in the NLRC5-high group. In addition to NLRC5, the expression of NLRC5-dependent (HLA-A, -B, -C, B2M, LMP2, LMP7, and TAP1) (Fig. 5C) but not NLRC5-independent (Calreticulin, Tapasin, ERp57, and ERAP1) (Fig. 5D) genes involved in MHC class I antigen presentation was positively associated with cumulative survival of melanoma patients. The expression of markers for cytotoxic CD8+ T-cell activity (CD8A, GZMA, and PRF1) (Fig. 5E) but not of NK cells (CD56) (Fig. S5B) also was correlated with better cancer patient survival, most likely through NLRC5-dependent MHC class I antigen presentation. Interestingly, high methylation of NLRC5 but not of other MHC class I and related genes (HLA-A, -B, -C, B2M, LMP2, LMP7, and TAP1) was associated with poor survival in melanoma and bladder cancer, indicating that aberrant epigenetic changes specifically in NLRC5 in cancer cells impacted clinical outcomes (Fig. 5F and Fig. S5 C and D). Intriguingly, brain cancer (glioma/glioblastoma) showed an opposite correlation, with a significantly lower 5-year survival rate in the cohort with high NLRC5 expression (Fig. S5A). Although the exact mechanism is uncertain, this effect might be caused by the unique anatomy of brain. Because brain mass is limited by the skull, unlike other cancers, one major life-threatening complications of brain tumors is the development of brain edema, which is associated with inflammatory events including impaired blood–brain barrier and destruction of normal brain tissues (31, 32). In fact, patients with brain tumors are commonly treated with anti-inflammatory drugs such as corticosteroids (32, 33). Taken together, these findings show that NLRC5 expression is correlated with higher survival in multiple cancer types, with the exception of brain cancer, in which it appears to be a negative prognostic factor. Strikingly, DNA methylation of NLRC5 alone, but not of other MHC class I-related genes, is linked to poor patient survival in melanoma and bladder cancer, further signifying the role of NLRC5 in tumor immunity.
Fig. 5.
The expression of NLRC5 is correlated with better survival in multiple cancer types. Patients were divided into four groups by the level of indicated gene expression or methylation, and the top (high) and the bottom (low) quartiles were analyzed. (A, Left) Five-year survival rate in high and low NLRC5 expression groups for indicated tumor types. (Right) Difference in the 5-year survival rate in groups with high and low NLRC5 expression. Statistical significance was determined by the χ2 test: *P < 0.05; **P < 0.01. (B) Kaplan–Meier survival curves for indicated tumor types in groups with low and high NLRC5 expression. (C) Kaplan–Meier survival curves for melanoma patients with low and high expression of the indicated NLRC5-dependent MHC class I-related genes. (D) Kaplan–Meier survival curves for melanoma patients with low and high expression of the indicated NLRC5-independent MHC class I-related genes. (E) Kaplan–Meier survival curves for melanoma patients with low and high expression of CD8A and the indicated markers for cytotoxic CD8+ T-cell activity. (F) Kaplan–Meier survival curves for melanoma patients with low and high methylation of the NLRC5 promoter and the indicated MHC class I-related genes. In B–F statistical significance was determined by the log-rank test and the Gehan–Breslow–Wilcoxon test.
Fig. S5.
Survival of cancer patients based on the expression and methylation level of MHC class I-related genes. Patients were divided into four groups by the level of indicated gene expression or methylation, and the top (high) and the bottom (low) quartiles were analyzed. (A, Left) Five-year survival rate for indicated tumor types in groups expressing high and low levels of NLRC5. (Right) The difference in the 5-year survival rate between groups expressing high and low levels of NLRC5. Statistical significance was determined by the χ2 test: **P < 0.01. (B) Kaplan–Meier survival curves of melanoma for groups with high and low expression of CD56. (C) Kaplan–Meier survival curves of melanoma for groups with high and low methylation of the indicated MHC class I genes. (D) Kaplan–Meier survival curves of bladder cancer for groups with high and low methylation of NLRC5 and the indicated MHC class I-related genes. In B–D statistical significance was determined by log-rank and Gehan–Breslow–Wilcoxon tests.
Discussion
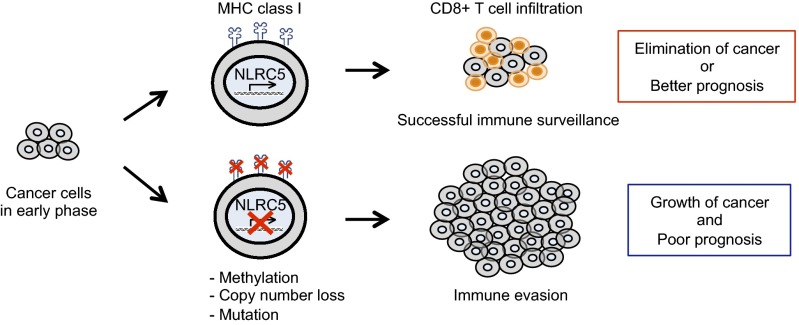
This study demonstrates that CITA/NLRC5 is a major target for facilitating immune evasion by cancer cells (Fig. 6). During oncogenic transformation and cancer evolution, tumor cells need to develop ways to escape from the host immune system to sustain development, growth, invasion, and metastasis. Reduction, alteration, or total loss of tumor antigen expression is critical to avoid killing via activation of cytotoxic CD8+ T cells and can be achieved by at least three mechanisms: (i) lack of expression of tumor antigen; (ii) loss of MHC class I molecules; (iii) impaired function or expression of genes in the class I antigen-presentation pathway such as in the immunoproteasome or class I peptide loading complex in the endoplasmic reticulum (1). Impaired function or expression of CITA/NLRC5, a master regulator of MHC class I genes, affects the latter two steps concurrently (11, 12), thus making NLRC5 an attractive target for cancer cells to evade CD8+ T-cell–dependent immune responses. Indeed, the expression of NLRC5 is correlated with markers for cytotoxic CD8+ T-cell activity and is associated with better prognosis with prolonged patient survival in multiple cancers (Figs. 1 E and F and 5 A and B). Furthermore, the expression of NLRC5-dependent genes (but not the expression of independent genes) involved in MHC class I antigen presentation is associated with cancer patient survival, further supporting the significance of the NLRC5-dependent MHC class I transactivation pathway in antitumor immunity (Fig. 5 C and D). Several lines of evidence demonstrated that cancer cells have evolved to target NLRC5 preferentially for immune evasion. First, the NLRC5 promoter is more highly methylated than any other gene in the MHC class I pathway (Fig. 2I). Second, the methylation-mediated suppression of gene expression is most effective for NLRC5 (Fig. 2 D, J, and K and Fig. S2I). Third, among all MHC class I-related genes, CN loss is most frequently observed in NLRC5 (Fig. 3B and Fig. S3A). Fourth, somatic mutations were observed more frequently in NLRC5 than in other MHC class I-related genes (Fig. 4C). Strikingly, the methylation status of NLRC5, but not of other MHC class I and related genes, was associated with changes in patient survival of melanoma and bladder cancer (Fig. 5F and Fig. S5 C and D). These data identify NLRC5 as a major target of immune evasion in cancers. Although NLRC5 is expressed in both cancer and infiltrating T cells, it is unlikely that aberrant promoter methylation, CN loss, and mutations in NLRC5 occur in normal infiltrating cells. Therefore, these data strongly indicate that genetic as well as epigenetic alterations within the cancer cells impact MHC class I-dependent immune responses through altered activity of NLRC5. Although this study focused on the transcriptional regulation of NLRC5, it is possible that NLRC5 may be regulated at the posttranscriptional level, including translational, protein stability, and cellular localization alterations in cancer cells; this possibility needs to be addressed in a future study. Alternative mechanisms by which NLRC5 affects cancer progression could be via regulation of cytokines such as type I IFNs, IL-6, or TNF-α because NLRC5 was reported to be a regulator of TLR response, type I IFN production, and inflammasome activation in early studies. However, it is unclear if these proposed innate immune functions of NLRC5 exist in cancer cells, because the data were not reproducible among different laboratories and by in vivo experiments using Nlrc5-deficient mice (12).
Fig. 6.
Model of cancer evolution targeting NLRC5 for immune evasion. NLRC5-dependent MHC class I expression is crucial for CD8+ T-cell–mediated antitumor responses and the elimination of cancer cells. Genetic and epigenetic changes, such as mutation, CN loss, or promoter methylation of NLRC5 occur during the evolution of cancer cells, leading to an impaired MHC class I system. These changes result in an impaired ability to elicit antitumor CD8+ T-cell responses and reduced infiltration in cancer tissues. Cancer cells successful in immune evasion cause efficient tumor development, leading to poor prognosis of cancer-bearing patients. Cancer cells (gray) and CD8+ T cells (orange) are shown.
Because high expression and low methylation of NLRC5 are correlated with better survival of cancer patients, these data suggest that NLRC5 expression and methylation status are useful biomarkers for patient prognosis and survival in multiple cancers. Furthermore, these data indicate that NLRC5 is an attractive therapeutic target in cancer patients. Checkpoint blockade immunotherapy such as anti-CTLA4 or anti–PD-1/PD-L1 therapy has emerged as a leading cancer treatment (34), although its efficacy is hampered when cancer cells successfully evade immune responses. Therapeutics augmenting NLRC5 activity could compensate for this deficit by breaking cancer immune evasion in a broad range of tumor types. Interestingly, it has been reported that currently used therapies, such as an EGF receptor inhibitor (cetuximab) or a B-Raf inhibitor (vemurafenib), enhance MHC class I expression via IFN-γ (35, 36). Therefore, these currently available therapies, originally designed to disrupt oncogenic signaling, may mediate their effects in part via the NLRC5-dependent MHC class I pathway.
Methods
For a more detailed discussion of the materials and methods, see SI Methods. Tumor types were selected based on the availability of gene-level RNA-sequencing (RNA-seq) expression data from TCGA. RNA-seq data in normal tissues were from the GTEx web portal. The TCGA abbreviations for the samples used in this study are given in Table S1. The numbers of samples of each tumor type are detailed in Table S2. The primers used for the construction of selected NLRC5 mutant expression vectors are listed in Table S3.
Table S1.
TCGA abbreviations of the samples used in this study
| TCGA ID | Tumor type | Abbreviation in this study |
| ACC | Adrenocortical carcinoma | Adrenal |
| BLCA | Bladder urothelial carcinoma | Bladder |
| BRCA | Breast invasive carcinoma | Breast |
| CESC | Cervical squamous cell carcinoma and endocervical adenocarcinoma | Cervical |
| COAD | Colon adenocarcinoma | Colon |
| GBM | Glioblastoma multiforme | Brain |
| LGG | Brain lower grade glioma | Brain |
| HNSC | Head and neck squamous cell carcinoma | Head/neck |
| KICH | Kidney chromophobe | Kidney |
| KIRC | Kidney renal clear cell carcinoma | Kidney |
| KIRP | Kidney renal papillary cell carcinoma | Kidney |
| LIHC | Liver hepatocellular carcinoma | Liver |
| LUAD | Lung adenocarcinoma | Lung |
| LUSC | Lung squamous cell carcinoma | Lung |
| OV | Ovarian serous cystadenocarcinoma | Ovarian |
| PRAD | Prostate adenocarcinoma | Prostate |
| READ | Rectum adenocarcinoma | Rectal |
| SKCM | Skin cutaneous melanoma | Melanoma |
| THCA | Thyroid carcinoma | Thyroid |
| UCEC | Uterine corpus endometrial carcinoma | Uterine |
| UCS | Uterine carcinosarcoma | Uterine |
Table S2.
Number of samples used in this study
| Tumor type | Correlation analysis | Methylation analysis | CN analysis | Mutation analysis | Kaplan–Meier analysis | ||
| Diploid | CN loss | Wild type | Mutant | ||||
| Adrenal | 79 | 79 | 26 | 5 | 79 | 0 | 79 |
| Bladder | 409 | 408 | 211 | 122 | 394 | 6 | 384 |
| Breast | 1,100 | 775 | 311 | 644 | 1,092 | 16 | 657 |
| Cervical | 308 | 306 | 201 | 58 | 306 | 7 | 288 |
| Colon | 283 | 274 | 198 | 23 | 456 | 39 | 179 |
| Brain | 696 | 588 | 578 | 57 | 1,155 | 4 | 501 |
| Head/neck | 522 | 522 | 308 | 92 | 525 | 0 | 404 |
| Kidney | 883 | 660 | 573 | 34 | 810 | 6 | 719 |
| Liver | 372 | 371 | 199 | 146 | 362 | 4 | 130 |
| Lung | 1,019 | 820 | 481 | 332 | 1,051 | 28 | 351 |
| Ovarian | 265 | 10 | 103 | 353 | 590 | 9 | 222 |
| Prostate | 498 | 498 | 361 | 122 | 491 | 3 | 206 |
| Rectal | 99 | 93 | 63 | 9 | 168 | 2 | 93 |
| Melanoma | 471 | 468 | 210 | 116 | 472 | 32 | 260 |
| Thyroid | 509 | 502 | 484 | 2 | 514 | 0 | 411 |
| Uterine | 234 | 230 | 116 | 95 | 596 | 20 | 218 |
Table S3.
Primers used for construction of selected NLRC5 mutant expression vectors related to experimental procedures
| Position, in aa | Mutation, CDS | Forward primer, 5′–3′ | Reverse primer, 5′–3′ |
| 181 | c.542T > C | TCCAATCCCGCGCCGGGCCA | CTGTGGCCCGGCGCGGGATTGGA |
| 262 | c.784C > T | GTTCCTTTTTGAATTCTGCCAGCTCAACTTG | GTTGAGCTGGCAGAATTCAAAAAGGAACAGGGC |
| 386 | c.1156C > T | GCCATCGTGGGAGGGGGCC | CCCCTCCCACGATGGCTGGG |
| 550 | c.1648C > T | GCTGGGTACAGTGGACCAAAGCTAGA | GCTTTGGTCCACTGTACCCAGCGGG |
| 496 | c.1487C > T | GCCTGCTGACTTTCTTCTGCGTCTGCAC | CAGACGCAGAAGAAAGTCAGCAGGCTGT |
| 574 | c.1721G > A | GCACCTGCCACCCCTTCCTTAGC | GGAAGGGGTGGCAGGTGCAGGA |
| 737 | c.2210C > A | CACCTGGTGAAAGATTTGCCTCTCTGTCC | CAGAGAGGCAAATCTTTCACCAGGTGGC |
| 884 | c.2650G > A | GAACCAGCTGGAAAATGAAGGCTGTCGG | GACAGCCTTCATTTTCCAGCTGGTTCCC |
| 1,005 | c.3013G > A | GCTGCCACCTCAGTCACCTCCACCTC | GTGGAGGTGACTGAGGTGGCAGCTTC |
| 1,173 | c.3518C > T | GCAGCTGAGCCAGATGGGACTGTC | GTCCCATCTGGCTCAGCTGCAGC |
| 1,512 | c.4534G > A | GAGGGCCTCACCCACCTGGCA | CCAGGTGGGTGAGGCCCTCGG |
| 1,717 | c.5144delC | CCCAGGCCCTGGATGGATCCCCCAT | CAA ATGGGGGATCCATCCAGGGCCT |
| 1,830 | c.5488C > T | GCATCCAAGTCATCTGCCTCTGGAATAACCCC | GGTTATTCCAGAGGCAGATGACTTGGATGCTAG |
| 1,847 | c.5539C > T | CCTGAAGAGCTAGGAGCCCAGGCT | CTGGGCTCCTAGCTCTTCAGGTGC |
CDS, coding DNA sequence.
SI Methods
Datasets.
Tumor types were selected based on availability of gene-level RNA-seq expression data from TCGA. The analyzed TCGA tumor types were 21 solid tumors including adrenocortical carcinoma (ACC), bladder urothelial carcinoma (BLCA), breast invasive carcinoma (BRCA), cervical squamous cell carcinoma and endocervical adenocarcinoma (CESC), colon adenocarcinoma (COAD), glioblastoma multiforme (GBM), head and neck squamous cell carcinoma (HNSC), kidney chromophobe (KICH), kidney renal clear cell carcinoma (KIRC), kidney renal papillary cell carcinoma (KIRP), brain lower grade glioma (LGG), liver hepatocellular carcinoma (LIHC), lung adenocarcinoma (LUAD), lung squamous cell carcinoma (LUSC), ovarian serous cystadenocarcinoma (OV), prostate adenocarcinoma (PRAD), skin cutaneous melanoma (SKCM), rectum adenocarcinoma (READ), thyroid carcinoma (THCA), uterine corpus endometrial carcinoma (UCEC), and uterine carcinosarcoma (UCS). GBM/LGG, LUAD/LUSC, KICH/KIRC/KIRP and UCEC/UCS were analyzed as single cancer types (brain, lung, kidney, and uterine, respectively) in the study. The abbreviations and the number of samples in each analysis are shown in Tables S1 and S2, respectively.
Gene-Expression Analysis.
TCGA gene-expression data (Illumina HiSEq. 2000 RNA Sequencing version 2 analysis) were accessed through GDAC Firehose (gdac.broadinstitute.org) for tumors. Normal tissue samples were accessed from the GTEx web portal (www.gtexportal.org/home). The expression of NLRC5 and MHC class I-related genes [HLA-A, HLA-B, HLA-C, B2M, PSMB9 (LMP2), PSMB8 (LMP7), TAP1, TAP2, ERp57 (PDIA3), Calnexin (CANX), Calreticulin (CALR), ERAP1, ERAP2 and Tapasin (TAPBP)], GZMA, PRF1, CD8A, NCAM1 (CD56), and CD45 (PTPRC)] were rescaled to TPM calculation of ‘scaled_ estimate’ which shows the tau value multiplied by 106 (37). The Spearman rank correlation test was used to assess the correlation between the expression of NLRC5 and MHC class I-related genes in biopsy samples of 16 cancer types from 7,747 cancer patients as well as cytolytic activity in 7,749 cancer patients. Cytolytic activity was shown via analysis of two key genes of cytolytic T cells: GZMA and PRF1 (23). To assess the correlation between the expression of NLRC5 and CD8A in 16 cancer types from 6,277 patients or NCAM1 (CD56) expression in 15 cancer types, excluding glioma/glioblastoma, from 5,685 patients, the Spearman rank correlation test was performed.
Methylation Analysis.
DNA methylation data (Illumina Infinium Human DNA Methylation 450) for 16 tumor types were accessed through GDAC Firehose for normal and tumor samples. DNA methylation levels were measured by the probe specific to the CpG island in the promoter of NLRC5 (cg16411857) (Fig. 2B) and are shown by β values ranging from 0 to 1, with 0 corresponding to the minimal level of DNA methylation and 1 to the maximal level of DNA methylation. A methylation level with a β value less than 0.3 was defined as unmethylated (38). The Spearman rank correlation test was used to assess the correlation between DNA methylation levels in the NLRC5 promoter and the expression level of NLRC5 or MHC class I-related genes in 6,523 TCGA tumor samples and of GZMA and PRF1 in 6,528 cancer patients. Also, the Spearman rank correlation test was performed to assess the correlation between DNA methylation levels in the NLRC5 promoter and CD8A expression in 15 cancer types from 6,277 patients or NCAM1 (CD56) expression in 14 cancer types, excluding glioma/glioblastoma, from 5,685 patients. DNA methylation levels of CIITA were measured by the probe specific to the promoter of CIITA (cg08985333) and are shown by β values. The Spearman rank correlation test was used to assess the correlation between DNA methylation levels in the CIITA promoter and the expression level of HLA-B in 5,667 TCGA tumor samples. To evaluate the correlation between DNA methylation levels and the expression levels for MHC class I genes, the Spearman rank correlation test was performed in 6,419 samples of 15 cancer types. DNA methylation levels of MHC class I genes were measured by the probe specific to HLA-A (cg23489273), HLA-B (cg00241218), HLA-C (cg16097079), B2M (cg08350173), LMP2 (cg03778035), LMP7 (cg05545172), TAP1 (cg14530528), TAP2 (cg00857968), ERp57/PDIA3 (cg02953927), Calnexin/CANX (cg05190557), Calreticulin/CALR (cg07876903), ERAP1 (cg09882587), ERAP2 (cg09750775), and Tapasin/TAPBP (cg23768510) and are shown by β values.
CN Analysis.
TCGA CN data (Affymetrix Genome-Wide Human SNP Array 6.0) generated by the GISTIC2 algorithm (39) were accessed through cBioPortal (40). Values were shown as −2 = homozygous deletion; −1 = hemizygous deletion; 0 = neutral/no change; 1 = gain; 2 = high-level amplification. We defined the CN-loss group as −2 and −1 and the diploid group as 0. From 7,730 samples comprising 16 tumor types, the percentage of cancer patients who carry NLRC5 CN loss was determined, and the expression levels of NLRC5 and MHC class I-related genes were compared in the diploid and CN-loss groups. Statistical P values were determined by the Mann–Whitney test. NLRC5 and HLA-B expression levels were visualized by heatmaps generated by GENE-E (www.broadinstitute.org/cancer/software/GENE-E/).
Mutation Analysis.
To represent mutation sites in the structure of NLRC5, somatic mutation data were accessed through the cBioPortal and the Catalogue of Somatic Mutations in Cancer (COSMIC, cancer.sanger.ac.uk/cosmic) (41). The percentages of mutation types were estimated over the total number of mutations in 7,752 samples from 16 tumor types using the previously mentioned datasets. The mutation types include missense, silent, nonsense, insertion frameshift, deletion inframe, deletion frameshift, and splice mutations. Samples carrying multiple mutations were shown as complex. Additionally, the correlation between the expression levels of MHC class I-related genes and NLRC5 mutation status was assessed. To evaluate the ability of wild-type and mutant NLRC5 to induce the expression of MHC class I-related genes in each patient, MHC class I gene levels were normalized by NLRC5 expression levels. Every mutation type, excluding silent mutations, was treated equally, and patients who had multiple mutations were treated as one event. The patients who had a silent mutation were treated as a wild-type group.
Mutation rates of NLRC5, HLA-A, -B, and -C, B2M, LMP2, LMP7, and TAP1 for all tumor types (9,061 samples comprising 16 cancer types) and for each tumor type were estimated by COSMIC dataset.
Survival Analysis.
Clinical data were accessed through GDAC Firehose. Sixteen tumor types in 5,102 patients were stratified by the expression levels of NLRC5/MHC class I-related genes/cytotoxic CD8+ T-cell activity markers (CD8A, GZMA, RPF1, and CD56) and DNA methylation levels in the NLRC5 promoter/MHC class I-related genes. The top and bottom quartiles of the expression of NLRC5/MHC class I-related genes/cytotoxic CD8+ T-cell activity markers or highest and lowest methylation levels of NLRC5/MHC class I-related genes, respectively, were used for analysis. Overall survival time was measured from the date of diagnosis to the date of death or the last follow-up. Five-year survival rates were compared between the groups, and the statistical significance was determined by χ2 test. Survival outcomes were estimated according to the Kaplan–Meier method and were compared between groups by the log-rank test and the Gehan–Breslow–Wilcoxon test. The log-rank statistic assesses group differences equally across the full observation time, whereas the Wilcoxon statistic weights the early events.
Expression Vectors.
The expression vector for human GFP-NLRC5 in pcDNA3.1 was described previously (14). The reporter gene construct used for MHC class I promoter activity, HLA-B250, was described previously (42). Selected NLRC5 mutants were constructed using pcDNA3.1-GFP-NLRC5 by site-directed mutagenesis using the primers listed in Table S3 (43). All plasmids were confirmed by sequencing (Gene Technologies Laboratory).
5-Aza Treatment for DNA Demethylation.
Cell lines were cultured in Iscove's modified Dulbecco's medium. All media were supplemented with 10% (vol/vol) heat-inactivated FBS, 50 U/mL penicillin, 50 U/mL streptomycin, 4 mM l-glutamine, and 10 mM Hepes. Cell lines were treated with 5-Aza (3 μM) for DNA demethylation. RNA isolation and quantitative PCR were performed as previously described (14).
Cell Culture and Luciferase Assay.
HEK293T cells were cultured in DMEM supplemented with 10% (vol/vol) FBS and penicillin/streptomycin (Life Technologies) at 37 °C with 5% (vol/vol) CO2. Cells were transiently transfected using polyethylenimine at a DNA/polyethylenimine ratio of 1:6 in serum-free medium. For the luciferase assay, HEK293T cells were split at a density of 5 × 10⁴ cells per well into 24-well plates 1 d before transfection. Cells were cotransfected using 100 ng of GFP-NLRC5 or 100 ng of the specified NLRC5-mutant plasmids along with 100 ng of HLA-B250 luciferase reporter construct. Twenty nanograms of promoterless Renilla luciferase vector (pRL-null; Promega) were included for normalization of transfection efficiency. Cells were harvested 48 h post transfection, and cell lysates were analyzed using the Dual-Luciferase Reporter Assay System (Promega) according to the manufacturer's instructions.
Statistical Analysis.
Statistical analysis was performed using Graph Pad Prism software. All tests were two-sided, and a P value of less than 0.05 was considered statistically significant.
Acknowledgments
This work was supported by NIH Grant R01DK074738, Broad Foundation Grant IBD-0328, and National Multiple Sclerosis Society Grant PP1779 (to K.S.K.), by the Texas A&M Clinical Science and Translational Research Institute, Texas A&M Genomics Grant Program, and the Center for Translational Environmental and Health Research (K.S.K.). S.Y. is the recipient of a fellowship from the Sumitomo Life Welfare and Culture Foundation.
Footnotes
The authors declare no conflict of interest.
This article is a PNAS Direct Submission. J.B. is a guest editor invited by the Editorial Board.
This article contains supporting information online at www.pnas.org/lookup/suppl/doi:10.1073/pnas.1602069113/-/DCSupplemental.
References
- 1.Schreiber RD, Old LJ, Smyth MJ. Cancer immunoediting: Integrating immunity’s roles in cancer suppression and promotion. Science. 2011;331(6024):1565–1570. doi: 10.1126/science.1203486. [DOI] [PubMed] [Google Scholar]
- 2.Mittal D, Gubin MM, Schreiber RD, Smyth MJ. New insights into cancer immunoediting and its three component phases—elimination, equilibrium and escape. Curr Opin Immunol. 2014;27:16–25. doi: 10.1016/j.coi.2014.01.004. [DOI] [PMC free article] [PubMed] [Google Scholar]
- 3.Campoli M, Ferrone S. HLA antigen changes in malignant cells: Epigenetic mechanisms and biologic significance. Oncogene. 2008;27(45):5869–5885. doi: 10.1038/onc.2008.273. [DOI] [PMC free article] [PubMed] [Google Scholar]
- 4.Lampen MH, van Hall T. Strategies to counteract MHC-I defects in tumors. Curr Opin Immunol. 2011;23(2):293–298. doi: 10.1016/j.coi.2010.12.005. [DOI] [PubMed] [Google Scholar]
- 5.Vermeulen CF, et al. Frequent HLA class I loss is an early event in cervical carcinogenesis. Hum Immunol. 2005;66(11):1167–1173. doi: 10.1016/j.humimm.2005.10.011. [DOI] [PubMed] [Google Scholar]
- 6.Djajadiningrat RS, et al. Classic and nonclassic HLA class I expression in penile cancer and relation to HPV status and clinical outcome. J Urol. 2015;193(4):1245–1251. doi: 10.1016/j.juro.2014.11.057. [DOI] [PubMed] [Google Scholar]
- 7.Inoue M, et al. Expression of MHC Class I on breast cancer cells correlates inversely with HER2 expression. OncoImmunology. 2012;1(7):1104–1110. doi: 10.4161/onci.21056. [DOI] [PMC free article] [PubMed] [Google Scholar]
- 8.Hanagiri T, et al. Clinical significance of expression of cancer/testis antigen and down-regulation of HLA class-I in patients with stage I non-small cell lung cancer. Anticancer Res. 2013;33(5):2123–2128. [PubMed] [Google Scholar]
- 9.Qifeng S, Bo C, Xingtao J, Chuanliang P, Xiaogang Z. Methylation of the promoter of human leukocyte antigen class I in human esophageal squamous cell carcinoma and its histopathological characteristics. J Thorac Cardiovasc Surg. 2011;141(3):808–814. doi: 10.1016/j.jtcvs.2010.04.031. [DOI] [PubMed] [Google Scholar]
- 10.Garrido F, Cabrera T, Aptsiauri N. “Hard” and “soft” lesions underlying the HLA class I alterations in cancer cells: Implications for immunotherapy. Int J Cancer. 2010;127(2):249–256. doi: 10.1002/ijc.25270. [DOI] [PubMed] [Google Scholar]
- 11.Meissner TB, Li A, Kobayashi KS. NLRC5: A newly discovered MHC class I transactivator (CITA) Microbes Infect. 2012;14(6):477–484. doi: 10.1016/j.micinf.2011.12.007. [DOI] [PMC free article] [PubMed] [Google Scholar]
- 12.Kobayashi KS, van den Elsen PJ. NLRC5: A key regulator of MHC class I-dependent immune responses. Nat Rev Immunol. 2012;12(12):813–820. doi: 10.1038/nri3339. [DOI] [PubMed] [Google Scholar]
- 13.Kuenzel S, et al. The nucleotide-binding oligomerization domain-like receptor NLRC5 is involved in IFN-dependent antiviral immune responses. J Immunol. 2010;184(4):1990–2000. doi: 10.4049/jimmunol.0900557. [DOI] [PubMed] [Google Scholar]
- 14.Meissner TB, et al. NLR family member NLRC5 is a transcriptional regulator of MHC class I genes. Proc Natl Acad Sci USA. 2010;107(31):13794–13799. doi: 10.1073/pnas.1008684107. [DOI] [PMC free article] [PubMed] [Google Scholar]
- 15.Meissner TB, Li A, Liu YJ, Gagnon E, Kobayashi KS. The nucleotide-binding domain of NLRC5 is critical for nuclear import and transactivation activity. Biochem Biophys Res Commun. 2012;418(4):786–791. doi: 10.1016/j.bbrc.2012.01.104. [DOI] [PMC free article] [PubMed] [Google Scholar]
- 16.Meissner TB, et al. NLRC5 cooperates with the RFX transcription factor complex to induce MHC class I gene expression. J Immunol. 2012;188(10):4951–4958. doi: 10.4049/jimmunol.1103160. [DOI] [PMC free article] [PubMed] [Google Scholar]
- 17.Ludigs K, et al. NLRC5 exclusively transactivates MHC class I and related genes through a distinctive SXY module. PLoS Genet. 2015;11(3):e1005088. doi: 10.1371/journal.pgen.1005088. [DOI] [PMC free article] [PubMed] [Google Scholar]
- 18.Staehli F, et al. NLRC5 deficiency selectively impairs MHC class I-dependent lymphocyte killing by cytotoxic T cells. J Immunol. 2012;188(8):3820–3828. doi: 10.4049/jimmunol.1102671. [DOI] [PubMed] [Google Scholar]
- 19.Biswas A, Meissner TB, Kawai T, Kobayashi KS. Cutting edge: Impaired MHC class I expression in mice deficient for Nlrc5/class I transactivator. J Immunol. 2012;189(2):516–520. doi: 10.4049/jimmunol.1200064. [DOI] [PMC free article] [PubMed] [Google Scholar]
- 20.Tong Y, et al. Enhanced TLR-induced NF-κB signaling and type I interferon responses in NLRC5 deficient mice. Cell Res. 2012;22(5):822–835. doi: 10.1038/cr.2012.53. [DOI] [PMC free article] [PubMed] [Google Scholar]
- 21.Yao Y, et al. NLRC5 regulates MHC class I antigen presentation in host defense against intracellular pathogens. Cell Res. 2012;22(5):836–847. doi: 10.1038/cr.2012.56. [DOI] [PMC free article] [PubMed] [Google Scholar]
- 22.Robbins GR, et al. Regulation of class I major histocompatibility complex (MHC) by nucleotide-binding domain, leucine-rich repeat-containing (NLR) proteins. J Biol Chem. 2012;287(29):24294–24303. doi: 10.1074/jbc.M112.364604. [DOI] [PMC free article] [PubMed] [Google Scholar]
- 23.Rooney MS, Shukla SA, Wu CJ, Getz G, Hacohen N. Molecular and genetic properties of tumors associated with local immune cytolytic activity. Cell. 2015;160(1-2):48–61. doi: 10.1016/j.cell.2014.12.033. [DOI] [PMC free article] [PubMed] [Google Scholar]
- 24.Terzić J, Grivennikov S, Karin E, Karin M. Inflammation and colon cancer. Gastroenterology. 2010;138(6):2101–2114.e5. doi: 10.1053/j.gastro.2010.01.058. [DOI] [PubMed] [Google Scholar]
- 25.El-Serag HB, Rudolph KL. Hepatocellular carcinoma: Epidemiology and molecular carcinogenesis. Gastroenterology. 2007;132(7):2557–2576. doi: 10.1053/j.gastro.2007.04.061. [DOI] [PubMed] [Google Scholar]
- 26.Esteller M. Epigenetics provides a new generation of oncogenes and tumour-suppressor genes. Br J Cancer. 2006;94(2):179–183. doi: 10.1038/sj.bjc.6602918. [DOI] [PMC free article] [PubMed] [Google Scholar]
- 27.Jones PA, Baylin SB. The fundamental role of epigenetic events in cancer. Nat Rev Genet. 2002;3(6):415–428. doi: 10.1038/nrg816. [DOI] [PubMed] [Google Scholar]
- 28.Albertson DG, Collins C, McCormick F, Gray JW. Chromosome aberrations in solid tumors. Nat Genet. 2003;34(4):369–376. doi: 10.1038/ng1215. [DOI] [PubMed] [Google Scholar]
- 29.Stranger BE, et al. Relative impact of nucleotide and copy number variation on gene expression phenotypes. Science. 2007;315(5813):848–853. doi: 10.1126/science.1136678. [DOI] [PMC free article] [PubMed] [Google Scholar]
- 30.Stratton MR. Exploring the genomes of cancer cells: Progress and promise. Science. 2011;331(6024):1553–1558. doi: 10.1126/science.1204040. [DOI] [PubMed] [Google Scholar]
- 31.Fan Z, et al. Dexamethasone alleviates tumor-associated brain damage and angiogenesis. PLoS One. 2014;9(4):e93264. doi: 10.1371/journal.pone.0093264. [DOI] [PMC free article] [PubMed] [Google Scholar]
- 32.Dubois LG, et al. Gliomas and the vascular fragility of the blood brain barrier. Front Cell Neurosci. 2014;8:418. doi: 10.3389/fncel.2014.00418. [DOI] [PMC free article] [PubMed] [Google Scholar]
- 33.Dietrich J, Rao K, Pastorino S, Kesari S. Corticosteroids in brain cancer patients: Benefits and pitfalls. Expert Rev Clin Pharmacol. 2011;4(2):233–242. doi: 10.1586/ecp.11.1. [DOI] [PMC free article] [PubMed] [Google Scholar]
- 34.Sharma P, Allison JP. The future of immune checkpoint therapy. Science. 2015;348(6230):56–61. doi: 10.1126/science.aaa8172. [DOI] [PubMed] [Google Scholar]
- 35.Pollack BP, Sapkota B, Cartee TV. Epidermal growth factor receptor inhibition augments the expression of MHC class I and II genes. Clin Cancer Res. 2011;17(13):4400–4413. doi: 10.1158/1078-0432.CCR-10-3283. [DOI] [PubMed] [Google Scholar]
- 36.Sapkota B, Hill CE, Pollack BP. Vemurafenib enhances MHC induction in BRAF(V600E) homozygous melanoma cells. OncoImmunology. 2013;2(1):e22890. doi: 10.4161/onci.22890. [DOI] [PMC free article] [PubMed] [Google Scholar]
- 37.Li B, Ruotti V, Stewart RM, Thomson JA, Dewey CN. RNA-Seq gene expression estimation with read mapping uncertainty. Bioinformatics. 2010;26(4):493–500. doi: 10.1093/bioinformatics/btp692. [DOI] [PMC free article] [PubMed] [Google Scholar]
- 38.Sproul D, et al. Transcriptionally repressed genes become aberrantly methylated and distinguish tumors of different lineages in breast cancer. Proc Natl Acad Sci USA. 2011;108(11):4364–4369. doi: 10.1073/pnas.1013224108. [DOI] [PMC free article] [PubMed] [Google Scholar]
- 39.Mermel CH, et al. GISTIC2.0 facilitates sensitive and confident localization of the targets of focal somatic copy-number alteration in human cancers. Genome Biol. 2011;12(4):R41. doi: 10.1186/gb-2011-12-4-r41. [DOI] [PMC free article] [PubMed] [Google Scholar]
- 40.Cerami E, et al. The cBio cancer genomics portal: An open platform for exploring multidimensional cancer genomics data. Cancer Discov. 2012;2(5):401–404. doi: 10.1158/2159-8290.CD-12-0095. [DOI] [PMC free article] [PubMed] [Google Scholar]
- 41.Forbes SA, et al. COSMIC: Exploring the world’s knowledge of somatic mutations in human cancer. Nucleic Acids Res. 2015;43(Database issue):D805–D811. doi: 10.1093/nar/gku1075. [DOI] [PMC free article] [PubMed] [Google Scholar]
- 42.Gobin SJ, Peijnenburg A, Keijsers V, van den Elsen PJ. Site alpha is crucial for two routes of IFN gamma-induced MHC class I transactivation: The ISRE-mediated route and a novel pathway involving CIITA. Immunity. 1997;6(5):601–611. doi: 10.1016/s1074-7613(00)80348-9. [DOI] [PubMed] [Google Scholar]
- 43.Liu H, Naismith JH. An efficient one-step site-directed deletion, insertion, single and multiple-site plasmid mutagenesis protocol. BMC Biotechnol. 2008;8:91. doi: 10.1186/1472-6750-8-91. [DOI] [PMC free article] [PubMed] [Google Scholar]


