

Abstract
Background
Influenza vaccines are now widely used to reduce the burden of annual epidemics of influenza virus infections. Influenza vaccine effectiveness (VE) is monitored annually to determine VE against each season’s circulating influenza strains in different groups such as children, adults and the elderly. Few prospective surveillance programs are available to evaluate influenza VE against medically-attended illness for patients of all ages in the United States.
Methods
We conducted surveillance of patients with acute respiratory illnesses in 101 clinics across the US during three consecutive influenza seasons. We analyzed laboratory testing results for influenza virus, self-reported vaccine history, and patient characteristics, defining cases as patients who tested positive for influenza virus and controls as patients who tested negative for influenza virus. Comparison of influenza vaccination coverage among cases versus controls, adjusted for potential confounders, was used to estimate VE as one minus the adjusted odds ratio multiplied by 100%.
Results
We included 10650 patients during three influenza seasons from August 2010 through December 2013, and estimated influenza VE in children 6m–5y of age (58%; 95% CI: 49%–66%), children 6–17y (45%; 95% CI: 34%–53%), adults 18–49y (36%; 95% CI: 24%, 46%), and adults ≥50y (34%, 95% CI: 13%, 51%). VE was higher against influenza A(H1N1) compared to A(H3N2) and B.
Conclusions
Our estimates of moderate influenza VE confirm the important role of vaccination in protecting against medically attended influenza virus infection.
Keywords: influenza vaccine, vaccine efficacy, respiratory infection, influenza-like illness
INTRODUCTION
Influenza vaccines are now widely used to reduce the burden of annual epidemics of influenza virus infections. In the United States, universal vaccination recommendations were established for all persons aged ≥6 months in 2010 [1]. Influenza vaccine effectiveness (VE) is monitored annually to determine VE against each season’s circulating influenza strains in different groups such as children, adults and the elderly. One approach for monitoring VE is a variant of the case-control study known as the test-negative design [2, 3]. In this design, patients with acute respiratory illness are identified in a clinical setting and tested for influenza virus. Test-positive patients are defined as cases, while test-negative patients are defined as controls. The VE is then estimated by comparing the vaccination coverage of cases and controls, adjusting for potential confounders. The test-negative design is growing in popularity because of the ease of data collection in clinics, and because the design explicitly accounts for health-care seeking behavior which can bias estimates of VE in more traditional case control studies with community controls. Simulation studies have demonstrated that the test-negative design can produce accurate estimates of VE in various circumstances [4]. The earliest test-negative studies were nested within existing routine surveillance systems in Canada [5], while some more recent studies in the US have been established for research purposes [6–8], and the study design is now being used in many countries [9–12].
As research studies in the US can be very costly, we evaluated the feasibility of calculating influenza VE using data collected through public health surveillance. In 2009 the US Centers for Disease Control and Prevention (CDC) established the Influenza Incidence Surveillance Project (IISP) as a sentinel surveillance network to determine the community burden of consultations for acute respiratory infections and influenza virus infections [13–15]. By collecting data on influenza vaccination status, this study also permits estimation of VE using the test-negative approach. The objectives of the present study were to assess VE overall, by circulating influenza strains, and by age, for the influenza seasons in 2010–11, 2011–12 and 2012–13.
METHODS
Subjects
This study involved patients attended by health care providers participating in surveillance to monitor acute respiratory infections (ARI) with laboratory confirmation of influenza infection [13–15]. Surveillance was conducted in 101 clinics under the supervision of 13 public health jurisdictions for the following seasons: Florida, Iowa, Minnesota, North Dakota, Oregon, Wisconsin, New York City; New Jersey, Virginia, Los Angeles county, and Philadelphia from August 2010 to July 2013; Utah from October 2010 to July 2011; Texas from August 2011 through July 2013. Each site recruited clinics that, in combination, represented patients of all ages. The IISP uses routinely collected specimens and public health surveillance data.
Patients were evaluated by clinical staff to identify ARI with an onset ≤7 days prior to consultation; ARI was defined as reporting at least 2 of the following symptoms: fever, cough, sore throat, rhinorrhea, and congestion. From the first 10 ARI patients presenting each week, a nasopharyngeal, oropharyngeal or nasal swab was collected and placed in viral transport media for influenza testing. Selection of patients for testing was not based on any provider decision. Demographic and clinical data were collected during the visit. Specimens were tested by the state or local public health laboratory for influenza virus types A and B with subtyping of influenza A (H1N1)pdm09 and A(H3N2) using the CDC Human Influenza Virus RT-PCR Diagnostic Panel.
Influenza vaccination status in IISP was considered to be self-reported, although each provider’s data collection methods varied, representing a combination of self-report only (53 clinics), self-report with medical chart and registry verification (17 clinics), electronic medical record extraction only (29 clinics), and vaccine registry only (2 clinics). A patient was considered vaccinated if receipt occurred >14 days prior to illness onset. The vaccine strains for 2010–11, 2011–12 and 2012–13 are shown in Appendix Table 1 [16–18].
Ethical approval
The IISP uses routinely collected specimens and public health surveillance data, and was therefore determined by CDC not to be subject to institutional review board approval for human research protections.
Statistical analysis
Children aged <6 months were excluded from the present analysis since they are not recommended to receive influenza vaccine in the US. Patients without influenza laboratory testing results were also excluded from analysis. We used multiple imputation with 20 imputed data sets to allow for missing data on age, sex and vaccination history [19]. Imputations were based on an additive regression model which included age group, sex, state, calendar week, vaccination history, and the laboratory result for influenza virus.
Influenza seasons were defined as the period of consecutive weeks with at least 10 influenza-positive patients, and we restricted all of our analyses to influenza seasons. We used conditional logistic regression models to estimate VE, conditioning by week of clinic visit, to account for changes in vaccine coverage over calendar time. Regression models included age group, and sex to control for their independent effects on the probability of influenza infection in addition to their association with receipt of vaccination that would otherwise confound the association between vaccination and influenza. Influenza VE was calculated as one minus the conditional adjusted odds ratio of vaccination in test-positive versus test-negative patients. Additional analyses were performed for specific influenza types/subtypes (excluding specimens positive for influenza of other types/subtypes), and stratified by age and season. In a sensitivity analysis we estimated VE on the subset of the data with complete information on all covariates. To minimize misclassification bias, we also estimated VE restricting analysis to patients who had onset 0–4 days prior to consultation.
RESULTS
From August 2010 through December 2013, 17652 patients were recruited, of whom 572 (3.2%) patients were not tested for influenza virus. In addition, 397 (2.2%) patients were aged <6 months, and excluded. Of the remaining 16683 patients, 3893 (23.3%) tested positive for influenza A or B virus. The influenza season in 2010–11 was a mixed season with circulation of A(H1N1), A(H3N2) and B, while the season in 2011–12 was dominated by A(H3N2) and the season in 2012–13 was dominated by A(H3N2) and B (Figure 1). Vaccine strains (shown in Appendix Table 1) were generally well matched to the prevalent strains each season [16–18].
Figure 1.
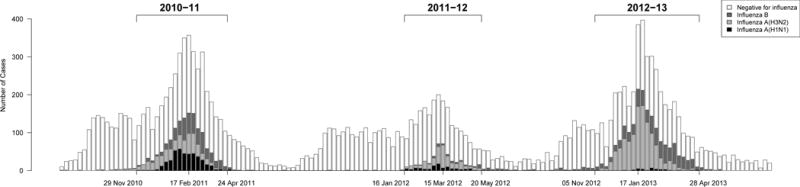
Surveillance of patients through three influenza seasons, and laboratory results for influenza virus. A small number (4/16683; 0.02%) of patients with co-infections with influenza A(H1N1) and A(H3N2) or B are plotted as A(H1N1), while 11/16683 (0.07%) patients with co-infections with influenza A(H3N2) and B are plotted as A(H3N2).
At least 10 test-positive patients per week were identified for 20, 17 and 23 consecutive weeks in 2010–11, 2011–12 and 2012–13 respectively (Figure 1). The 10650 patients included during the three influenza seasons ranged in age from 6 months to 99 years, with the majority made up of school-age children 6–17 years of age and adults aged 18–49 years, while slightly less than half were male (Table 1). All statistical analyses reported below were based on these 10650 patients. Influenza vaccination was reported for 30.4% of influenza test-negative patients, compared to 18.6% of test-positive patients. Patient characteristics stratified by influenza type/subtype are shown in Appendix Table 2. Of the 10650 patients, 80.8% reported a febrile illness.
Table 1.
Comparison of the characteristics of patients testing positive for any influenza virus versus the patients testing negative for influenza virus, for the 10,650 patients included during the three influenza seasons in our study period.
| Characteristic | Test-positive (n=3743) N (%) |
Test-negative (n=6907) N (%) |
|---|---|---|
| Age groupa | ||
| 6m–5y | 685 (18.3%) | 2039 (29.5%) |
| 6–17y | 1345 (35.9%) | 1779 (25.8%) |
| 18–49y | 1372 (36.7%) | 2427 (35.1%) |
| ≥50y | 338 (9.0%) | 658 (9.5%) |
| Unknown | 3 (0.1%) | 4 (0.1%) |
| Sexa | ||
| Male | 1797 (48.0%) | 3048 (44.1%) |
| Female | 1914 (51.1%) | 3800 (55.0%) |
| Unknown | 32 (0.9%) | 59 (0.9%) |
| Influenza vaccination historya | ||
| Yes for that season (>2 weeks prior to illness onset) | 696 (18.6%) | 2097 (30.4%) |
| No reported vaccination for that season (>2 weeks prior to illness onset) | 2204 (58.9%) | 3367 (48.7%) |
| Reported as unknown | 843 (22.5%) | 1443 (20.9%) |
| Influenza season | ||
| 2010–11 | 1424 (38.0%) | 2784 (40.3%) |
| 2011–12 | 472 (12.6%) | 1692 (24.5%) |
| 2012–13 | 1847 (49.3%) | 2431 (35.2%) |
Estimated VE for all influenza was 47% (95% confidence interval, CI: 42%, 52%), ranging by season from 40% to 51%. We found that VE was comparatively higher against influenza A(H1N1) compared to influenza A(H3N2) and B. For any influenza virus, VE tended to decline as age increased, with point estimates ranging by age from 34% to 58% where confidence intervals do not include zero (Table 2). While the sample size was insufficient to condition by state and week of enrolment, very similar results were obtained when conditioning by state and month of enrolment (data not shown). Age and season-specific VE estimates by influenza type/subtype are shown in Figure 2. Point estimates of VE against all influenza fell in the range 32% to 63% each year, although robust estimation for adults aged ≥50 years was not possible in 2010–11 due to low recruitment in this age group. It was not possible to estimate age-specific VE against influenza B in 2011–12 or against A(H1N1) in 2012–13 due to low circulation during these years. Point estimates for VE in the complete case analysis were very consistent with the estimates in the main analysis that used multiple imputation to account for missing data (Table 2).
Table 2.
Estimates of influenza vaccine effectiveness overall, and by age group and influenza type/subtype, 2010–13, based on the 10,650 patients included during the three influenza seasons in our study period.
| Analysis | Influenza A(H1N1) | Influenza A(H3N2) | Influenza B | Overall (Influenza A or B) | |
|---|---|---|---|---|---|
| VE (95% CI) | VE (95% CI) | VE (95% CI) | VE (95% CI) | ||
| Imputed dataseta | Age group | ||||
| 6m–5y | 70% (48%, 83%) | 60% (47%, 69%) | 51% (35%, 64%) | 58% (49%, 66%) | |
| 6–17y | 56% (31%, 72%) | 33% (16%, 47%) | 52% (40%, 62%) | 45% (34%, 53%) | |
| 18–49y | 57% (39%, 70%) | 26% (8%, 41%) | 33% (9%, 50%) | 36% (24%, 46%) | |
| ≥50y | −1% (−179%, 63%) | 34% (9%, 52%) | 37% (−10%, 65%) | 34% (13%, 51%) | |
| All ages | 63% (53%, 71%) | 39% (31%, 46%) | 50% (43%, 57%) | 47% (42%, 52%) | |
| Influenza season | |||||
| 2010–2011 | 55% (41%, 66%) | 29% (12%, 44%) | 40% (25%, 52%) | 40% (30%, 48%) | |
| 2011–2012 | 79% (62%, 89%) | 36% (16%, 52%) | 47% (2%, 71%) | 50% (37%, 61%) | |
| 2012–2013 | 70% (26%, 88%) | 45% (35%, 53%) | 58% (48%, 66%) | 51% (43%, 57%) | |
| Restricted analysisb | Age group | ||||
| 6m–5y | 67% (41%, 81%) | 61% (48%, 71%) | 51% (32%, 64%) | 58% (49%, 66%) | |
| 6–17y | 57% (32%, 73%) | 32% (14%, 46%) | 53% (40%, 63%) | 44% (33%, 53%) | |
| 18–49y | 59% (39%, 72%) | 24% (4%, 40%) | 31% (5%, 50%) | 36% (23%, 47%) | |
| ≥50y | −11% (−242%, 64%) | 32% (3%, 53%) | 36% (−19%, 66%) | 34% (9%, 52%) | |
| All ages | 63% (52%, 71%) | 39% (31%, 47%) | 50% (42%, 57%) | 47% (42%, 52%) | |
| Influenza season | |||||
| 2010–2011 | 55% (41%, 66%) | 27% (7%, 42%) | 38% (22%, 51%) | 39% (28%, 48%) | |
| 2011–2012 | 78% (58%, 88%) | 41% (20%, 56%) | 46% (−1%, 71%) | 52% (39%, 63%) | |
| 2012–2013 | 76% (31%, 91%) | 45% (34%, 54%) | 59% (49%, 67%) | 51% (44%, 58%) | |
| Complete datasetc | Age group | ||||
| 6m–5y | 78% (55%, 90%) | 61% (48%, 72%) | 51% (30%, 66%) | 60% (50%, 68%) | |
| 6–17y | 58% (29%, 75%) | 35% (17%, 50%) | 54% (40%, 65%) | 46% (35%, 56%) | |
| 18–49y | 75% (57%, 86%) | 27% (7%, 43%) | 32% (4%, 52%) | 39% (26%, 50%) | |
| ≥50y | −21% (−305%, 64%) | 30% (1%, 51%) | 34% (−21%, 64%) | 33% (8%, 51%) | |
| All ages | 72% (61%, 79%) | 40% (31%, 48%) | 51% (42%, 59%) | 49% (43%, 54%) | |
| Influenza season | |||||
| 2010–2011 | 65% (50%, 76%) | 28% (6%, 44%) | 34% (13%, 51%) | 40% (27%, 50%) | |
| 2011–2012 | 82% (65%, 90%) | 40% (18%, 56%) | 44% (−8%, 71%) | 54% (40%, 64%) | |
| 2012–2013 | 72% (18%, 90%) | 45% (34%, 54%) | 59% (48%, 67%) | 51% (43%, 58%) |
Missing data on age (n=7), sex (n=91) and vaccination history (n=2286) were imputed. 73/10650 (0.7%) patients with unsubtypeable influenza A virus infections were excluded from the estimation of VE for A(H1N1) and A(H3N2) but included in the overall estimates.
1297/10650 (12.2%) patients were excluded who with intervals between symptom onset to present more than 4 days, or with unknown onset date.
Including patients included during the three influenza seasons with complete data on age, sex and vaccination history (n=8313). 57/8313(0.7%) patients with unsubtypeable influenza A virus infections were excluded from the estimation of VE for A(H1N1) and A(H3N2) but included in the overall estimates.
We adjusted in each regression model for age and sex, and conditioned by calendar week.
Figure 2.
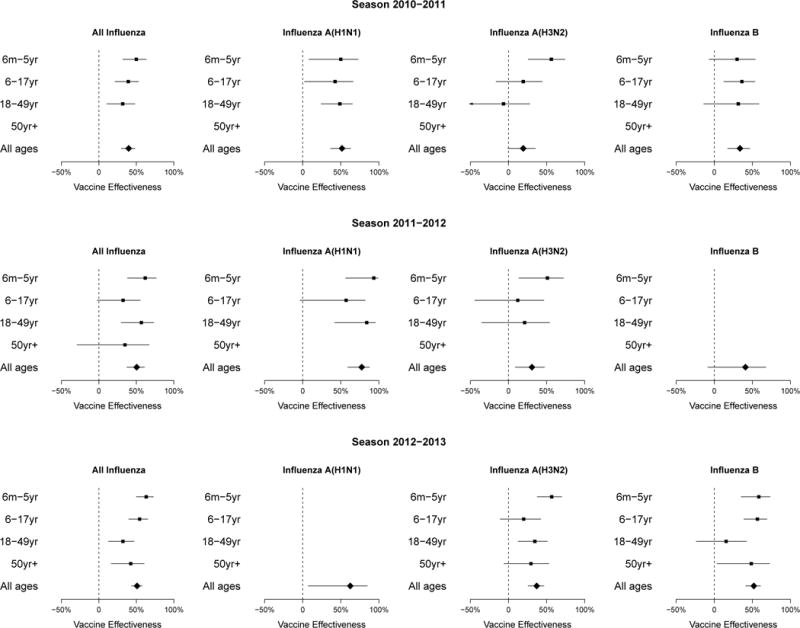
Estimates of influenza vaccine effectiveness by type/subtype, age group and year. 95% confidence intervals wider than 100 percentage points are not shown. Robust estimation for adults aged >50 years was not possible in 2010–11 or for influenza A subtypes in 2011–12, and it was not possible to estimate age-specific VE against influenza B in 2011–12 or against A(H1N1) in 2012–13 due to small numbers of patients and low circulation of the specific subtypes in these seasons
DISCUSSION
Across three winters, we estimated similar VE against medically-attended laboratory-confirmed influenza in children and adults with point estimates ranging from 34% to 58% (Table 2). We found that VE was higher against influenza A(H1N1) compared to influenza A(H3N2) and B (Table 2), and tended to be higher in children than in adults. These estimates are in line with annual VE estimates from other countries around the world in those years, where VE was generally moderate [9–11]. In particular, these estimates of VE are consistent with previous estimates from the US over the same time period [6–8] with a few exceptions of age and season-specific estimates. For example, in 2010–11, we estimated a low to moderate VE against influenza A(H3N2) in children aged 6 months to 5 years of age, while Treanor et al. estimated a moderate VE of 66% (95% CI: 48%–78%) in children aged 6 months–8 years [6]. Then, in 2011–12, we estimated low VE against influenza for all ages which is consistent with the estimates by Ohmit et al. of a low to moderate VE of 39% (95% CI: 23%–52%) against influenza A(H3N2) [7]. However, the estimated VE using comparable age groups in 2010–11 was still lower in the IISP cohort than in Treanor et al. [6], but confidence intervals overlapped, and VE in 2011–12 was very similar to that reported by Ohmit et al [7]. A direct head-to-head comparison of VE estimates from the IISP and the other studies is underway.
Annual influenza coverage for the United States was estimated to be 42–43% in the general population during the years covered by our study, and higher among children and the elderly [20]. Both the national estimates and IISP rely on self-reported vaccination, but vaccination coverage among IISP participants was lower. Among children aged 6 months to 17 years vaccine coverage ranged each season from 29% to 39%, and was substantially lower among adults aged 18 to 49 years (18% to 24%), but higher among patients ≥50 years (37% to 48%). Because participation in this project was conditional on seeking medical care for ARI, potential reasons for the lower vaccination coverage in IISP include the overrepresentation of influenza test positive individuals, the large proportion of participants between the ages of 18–49 years, and an unclear representation of insured persons.
The IISP has been shown to provide a successful alternate approach to conducting population-based surveillance that is enhanced by systematic molecular testing for respiratory viruses. This simple platform has been useful for estimating the burden of disease for influenza and other respiratory viruses [13–15], and has demonstrated further utility for the estimation of VE. One of the strengths of the present study is the large sample size, which permitted precise estimation of VE in most age groups for the predominant strains each season. Since this study was based in a sentinel surveillance system, it provides an efficient approach to routine annual estimation of VE. There are a few limitations worthy of mention. First, vaccination history was largely self-reported and not validated, and this could have led to misclassification bias, with consequent underestimation of VE if the bias was non-differential. We were unable to determine whether vaccinated children <9y of age were fully vaccinated, i.e. if children with no prior experience of influenza vaccine had received two doses of vaccination at least 21 days apart. Second, medical chart reviews were not conducted to ascertain underlying medical conditions due to resource intensiveness, which could be a confounder, also leading to the potential for bias in estimation of VE. Third, there were several secondary analyses that were not possible. Data were not collected on the type of vaccine received, prohibiting analyses of VE for specific types of vaccines, such as inactivated or live attenuated vaccines, and possible corresponding age differential VE. Finally, data were not collected on prior vaccination history and we were not able to examine the potential consequences of repeat vaccination on VE [12, 21–24].
In conclusion, we have shown that estimation of VE using the test-negative design and a routine surveillance network data is feasible. The data demonstrated that in each of the three seasons studied, influenza vaccination afforded protection against medically-attended laboratory-confirmed influenza virus infection for the predominant circulating influenza strains. Given the national influenza vaccination coverage was 42%–43% in the study years and the incidence of medical visits associated with laboratory-confirmed influenza was 7.0, 1.9 and 10.7 per 1000 persons in the three study seasons respectively [15], the moderate VE estimated here suggests that influenza vaccination had a substantial public health impact. Moderate VE emphasizes the importance of developing more immunogenic vaccines to provide higher protection in all ages, and the declining VE in older adults supports the particular importance of more immunogenic vaccines in this group. Influenza vaccination provides the best protection against influenza virus infection. The moderate effectiveness of influenza vaccination across the three seasons in our study indicates the need for complementary public health measures to further reduce the burden of influenza.
Acknowledgments
The authors would like to thank the many IISP Working Group members for their leadership in coordinating the clinical surveillance and laboratory testing that make IISP a successful program. The authors thank Simon Cauchemez for helpful comments.
FUNDING:
This work was supported by the Council of State and Territorial Epidemiologists (cooperative agreement 5U38HM000414- 04 from the Centers for Disease Control and Prevention). BJC is supported by the Harvard Center for Communicable Disease Dynamics from the National Institute of General Medical Sciences (grant no. U54 GM088558), a grant from the Research Grants Council of the Hong Kong Special Administrative Region, China (Project No. T11-705/14N), and a commissioned grant from the Health and Medical Research Fund, Food and Health Bureau, Government of the Hong Kong Special Administrative Region. The funding bodies had no role in study design, data collection and analysis, preparation of the manuscript, or the decision to publish.
Appendix
Appendix Table 1.
Vaccine strain components in 2010–11, 2011–12 and 2012–13
| Virus | 2010–11 | 2011–12 | 2012–13 |
|---|---|---|---|
| A(H1N1) | A/California/7/2009-like (H1N1) | A/California/7/2009-like (H1N1) | A/California/7/2009-like (H1N1) |
| A(H3N2) | A/Perth/16/2009-like (H3N2) | A/Perth/16/2009-like (H3N2) | A/Victoria/361/2011-like (H3N2) |
| B | B/Brisbane/60/2008-like (B/Victoria lineage) | B/Brisbane/60/2008-like (B/Victoria lineage) | B/Wisconsin/1/2010-like (B/Yamagata lineage) |
Appendix Table 2.
Comparison of patients testing positive for influenza A(H1N1), A(H3N2) and B viruses compared to patients testing negative for all influenza viruses, for the 10,650 patients included during the three influenza seasons in our study period.a
| Characteristic | A(H1N1) (n=550) N (%) |
A(H3N2) (n=1890) N (%) |
B (n=1245) N (%) |
Negative (n=6907) N (%) |
|---|---|---|---|---|
| Age group | ||||
| 6m–5yr | 81 (14.7%) | 349 (18.5%) | 246 (19.8%) | 2039 (29.5%) |
| 6–17yr | 132 (24.0%) | 578 (30.6%) | 624 (50.1%) | 1779 (25.8%) |
| 18–49yr | 318 (57.8%) | 711 (37.6%) | 314 (25.2%) | 2427 (35.1%) |
| ≥50yr | 19 (3.5%) | 250 (13.2%) | 60 (4.8%) | 658 (9.5%) |
| Unknown | 0 (0) | 2 (0.1%) | 1 (0.1%) | 4 (0.1%) |
| Sex | ||||
| Male | 261 (47.5%) | 877 (46.4%) | 626 (50.3%) | 3048 (44.1%) |
| Female | 287 (52.2%) | 993 (52.5%) | 609 (48.9%) | 3800 (55.0%) |
| Unknown | 2 (0.4%) | 20 (1.1%) | 10 (0.8%) | 59 (0.9%) |
| Seasonal influenza vaccination history | ||||
| Yes for that season (>2 weeks prior to onset) | 52 (9.5%) | 416 (22.0%) | 215 (17.3%) | 2097 (30.4%) |
| No reported vaccination for that season (>2 weeks prior to onset) | 318 (57.8%) | 1155 (61.1%) | 696 (55.9%) | 3367 (48.7%) |
| Reported as unknown | 180 (32.7%) | 319 (16.9%) | 334 (26.8%) | 1443 (20.9%) |
| Influenza season | ||||
| 2010–11 | 415 (75.5%) | 478 (25.3%) | 511 (41.0%) | 2784 (40.3%) |
| 2011–12 | 100 (18.2%) | 293 (15.5%) | 57 (4.6%) | 1692 (24.5%) |
| 2012–13 | 35 (6.4%) | 1119 (59.2%) | 677 (54.4%) | 2431 (35.2%) |
Of the patients positive for A(H1N1), 2 were also positive for A(H3N2) and 2 were also positive for B, while 11 patients were positive for A(H3N2) and B. 73/10650 (0.7%) patients with unsubtypeable influenza A virus infections were excluded from this table.
Footnotes
POTENTIAL CONFLICTS OF INTEREST
BJC has received research funding from MedImmune Inc. and Sanofi Pasteur, and consults for Crucell NV. The authors report no other potential conflicts of interest.
DISCLAIMER
The findings and conclusions in this report are those of the authors and do not necessarily represent the official position of the Centers for Disease Control and Prevention (CDC). The use of trade names is for identification only and does not imply endorsement by the Department of Health and Human Services or the CDC.
References
- 1.Fiore AE, Uyeki TM, Broder K, Finelli L, Euler GL, Singleton JA, et al. Prevention and control of influenza with vaccines: recommendations of the Advisory Committee on Immunization Practices (ACIP), 2010. MMWR Recommendations and reports: Morbidity and mortality weekly report Recommendations and reports/Centers for Disease Control. 2010;59:1–62. [PubMed] [Google Scholar]
- 2.Jackson ML, Nelson JC. The test-negative design for estimating influenza vaccine effectiveness. Vaccine. 2013;31:2165–8. doi: 10.1016/j.vaccine.2013.02.053. [DOI] [PubMed] [Google Scholar]
- 3.Sullivan SG, Feng S, Cowling BJ. Potential of the test-negative design for measuring influenza vaccine effectiveness: a systematic review. Expert Review of Vaccines. 2014;13:1571–91. doi: 10.1586/14760584.2014.966695. [DOI] [PMC free article] [PubMed] [Google Scholar]
- 4.Foppa IM, Haber M, Ferdinands JM, Shay DK. The case test-negative design for studies of the effectiveness of influenza vaccine. Vaccine. 2013;31:3104–9. doi: 10.1016/j.vaccine.2013.04.026. [DOI] [PubMed] [Google Scholar]
- 5.Skowronski DM, Gilbert M, Tweed SA, Petric M, Li Y, Mak A, et al. Effectiveness of vaccine against medical consultation due to laboratory-confirmed influenza: results from a sentinel physician pilot project in British Columbia, 2004–2005. Can Commun Dis Rep. 2005;31:181–91. [PubMed] [Google Scholar]
- 6.Treanor JJ, Talbot HK, Ohmit SE, Coleman LA, Thompson MG, Cheng PY, et al. Effectiveness of seasonal influenza vaccines in the United States during a season with circulation of all three vaccine strains. Clinical infectious diseases: an official publication of the Infectious Diseases Society of America. 2012;55:951–9. doi: 10.1093/cid/cis574. [DOI] [PMC free article] [PubMed] [Google Scholar]
- 7.Ohmit SE, Thompson MG, Petrie JG, Thaker SN, Jackson ML, Belongia EA, et al. Influenza vaccine effectiveness in the 2011–2012 season: protection against each circulating virus and the effect of prior vaccination on estimates. Clinical infectious diseases: an official publication of the Infectious Diseases Society of America. 2014;58:319–27. doi: 10.1093/cid/cit736. [DOI] [PMC free article] [PubMed] [Google Scholar]
- 8.McLean HQ, Thompson MG, Sundaram ME, Kieke BA, Gaglani M, Murthy K, et al. Influenza Vaccine Effectiveness in the United States During 2012–2013: Variable Protection by Age and Virus Type. The Journal of infectious diseases. 2014 doi: 10.1093/infdis/jiu647. [DOI] [PMC free article] [PubMed] [Google Scholar]
- 9.Kissling E, Valenciano M, Cohen JM, Oroszi B, Barret A-S, Rizzo C, et al. I-MOVE multi-centre case control study 2010–11: overall and stratified estimates of influenza vaccine effectiveness in Europe. PloS one. 2011;6 doi: 10.1371/journal.pone.0027622. [DOI] [PMC free article] [PubMed] [Google Scholar]
- 10.Kissling E, Valenciano M, Buchholz U, Larrauri A, Cohen J, Nunes B, et al. Influenza vaccine effectiveness estimates in Europe in a season with three influenza type/subtypes circulating: the I-MOVE multicentre case-control study, influenza season 2012/13. 2014 doi: 10.2807/1560-7917.es2014.19.6.20701. [DOI] [PubMed] [Google Scholar]
- 11.Levy A, Sullivan SG, Tempone SS, Wong KL, Regan AK, Dowse GK, et al. Influenza vaccine effectiveness estimates for Western Australia during a period of vaccine and virus strain stability, 2010 to 2012. Vaccine. 2014;32:6312–8. doi: 10.1016/j.vaccine.2014.08.066. [DOI] [PubMed] [Google Scholar]
- 12.Ohmit SE, Thompson MG, Petrie JG, Thaker SN, Jackson ML, Belongia EA, et al. Influenza vaccine effectiveness in the 2011–2012 season: protection against each circulating virus and the effect of prior vaccination on estimates. Clinical Infectious Diseases. 2014;58:319–27. doi: 10.1093/cid/cit736. [DOI] [PMC free article] [PubMed] [Google Scholar]
- 13.Fowlkes A, Giorgi A, Erdman D, Temte J, Goodin K, Di Lonardo S, et al. Viruses associated with acute respiratory infections and influenza-like illness among outpatients from the Influenza Incidence Surveillance Project, 2010–2011. Journal of Infectious Diseases. 2014;209:1715–25. doi: 10.1093/infdis/jit806. [DOI] [PMC free article] [PubMed] [Google Scholar]
- 14.Fowlkes A, Dasgupta S, Chao E, Lemmings J, Goodin K, Harris M, et al. Estimating influenza incidence and rates of influenza-like illness in the outpatient setting. Influenza and Other Respiratory Viruses. 2013;7:694–700. doi: 10.1111/irv.12014. [DOI] [PMC free article] [PubMed] [Google Scholar]
- 15.Fowlkes A, Steffens A, Temte J, Di Lonardo S, McHugh L, Martin K, et al. Incidence of medically attended influenza during pandemic and post-pandemic seasons through the Influenza Incidence Surveillance Project, 2009–13. Lancet Respir Med. 2015 doi: 10.1016/S2213-2600(15)00278-7. [DOI] [PMC free article] [PubMed] [Google Scholar]
- 16.Centers for Disease Control and Prevention. Update: influenza activity–United States, 2010–11 season, and composition of the 2011–12 influenza vaccine. MMWR Morbidity and mortality weekly report. 2011;60:705–12. [PubMed] [Google Scholar]
- 17.Centers for Disease Control and Prevention. Update: influenza activity - United States, 2011–12 season and composition of the 2012–13 influenza vaccine. MMWR Morbidity and mortality weekly report. 2012;61:414–20. [PubMed] [Google Scholar]
- 18.Centers for Disease Control and Prevention. Influenza activity–United States, 2012–13 season and composition of the 2013–14 influenza vaccine. MMWR Morbidity and mortality weekly report. 2013;62:473–9. [PMC free article] [PubMed] [Google Scholar]
- 19.Schafer JL. Multiple imputation: a primer. Statistical Methods in Medical Research. 1999;8:3–15. doi: 10.1177/096228029900800102. [DOI] [PubMed] [Google Scholar]
- 20.Centers for Disease Control and Prevention. FluVaxView Influenza Vaccination Coverage [Google Scholar]
- 21.Sullivan SG, Kelly H. Stratified estimates of influenza vaccine effectiveness by prior vaccination: caution required. Clinical Infectious Diseases. 2013;57:474–6. doi: 10.1093/cid/cit255. [DOI] [PubMed] [Google Scholar]
- 22.Skowronski DM, Chambers C, Sabaiduc S, De Serres G, Winter A-L, Dickinson JA, et al. Integrated sentinel surveillance linking genetic, antigenic and epidemiologic monitoring of influenza vaccine-virus relatedness and effectiveness, 2013–14 season. Journal of Infectious Diseases. 2015:jiv177. doi: 10.1093/infdis/jiv177. [DOI] [PubMed] [Google Scholar]
- 23.McLean HQ, Thompson MG, Sundaram ME, Kieke BA, Gaglani M, Murthy K, et al. Influenza vaccine effectiveness in the United States during 2012–2013: variable protection by age and virus type. Journal of Infectious Diseases. 2014:jiu647. doi: 10.1093/infdis/jiu647. [DOI] [PMC free article] [PubMed] [Google Scholar]
- 24.McLean HQ, Thompson MG, Sundaram ME, Meece JK, McClure DL, Friedrich TC, et al. Impact of repeated vaccination on vaccine effectiveness against influenza A (H3N2) and B during 8 seasons. Clinical Infectious Diseases. 2014;59:1375–85. doi: 10.1093/cid/ciu680. [DOI] [PMC free article] [PubMed] [Google Scholar]