

Abstract
Diet has a significant impact on colorectal cancer and both dietary fiber and plant-derived compounds have been independently shown to be inversely related to colon cancer risk. Butyrate (NaB), one of the principal products of dietary fiber fermentation, induces differentiation of colon cancer cell lines by inhibiting histone deacetylases (HDACs). On the other hand, (−)-epicatechin (EC) and (−)-epigallocatechin gallate (EGCG), two abundant phenolic compounds of green tea, have been shown to exhibit antitumoral properties. In this study we used colon cancer cell lines to study the cellular and molecular events that take place during co-treatment with NaB, EC and EGCG. We found that (i) polyphenols EC and EGCG fail to induce differentiation of colon adenocarcinoma cell lines; (ii) polyphenols EC and EGCG reduce NaB-induced differentiation; (iii) the effect of the polyphenols is specific for NaB, since differentiation induced by other agents, such as trichostatin A (TSA), was unaltered upon EC and EGCG treatment, and (iv) is independent of the HDAC inhibitory activity of NaB. Also, (v) polyphenols partially reduce cellular NaB; and (vi) on a molecular level, reduction of cellular NaB uptake by polyphenols is achieved by impairing the capacity of NaB to relocalize its own transporter (monocarboxylate transporter 1, MCT1) in the plasma membrane. Our findings suggest that beneficial effects of NaB on colorectal cancer may be reduced by green tea phenolic supplementation. This valuable information should be of assistance in choosing a rational design for more effective diet-driven therapeutic interventions in the prevention or treatment of colorectal cancer.
Keywords: Epicatechin, Epigallocatechin gallate, Butyrate, Differentiation, Colon cancer
1. Introduction
Colorectal cancer constitutes one of the most frequent malignancies worldwide and is one of the prevalent causes of cancer-related mortality in the western world [1]. Therefore, further development of therapeutic and preventive approaches to control this disease is clearly needed. A diet rich in fiber and plant-derived compounds present in tea, fruits and vegetables has been inversely associated with the risk of colorectal cancer [2,3]. Furthermore, the protective effect of the bioactive compounds present in these dietary constituents has been shown to be related to the activity of human intestinal microbiota. In this regard, consumption of natural phenolics has been shown to increase microbial fermentation products such as butyrate (NaB — sodium butyrate) from dietary fiber [4–6], thereby providing a beneficial effect to the host. However, the mechanism by which NaB and phenolics interact at the cellular level has not been satisfactorily addressed.
NaB has been described as a potent antitumoral agent against colon cancer, and has been used in clinical trials for treating cancers [7]. NaB is a four-carbon fatty acid that represents a major oxidative fuel for colonic epithelial cells [8]. Previous studies have demonstrated that deficiency in the availability or utilization of NaB causes colitis and may be involved in ulcerative colitis and colon carcinogenesis [9,10]. Moreover, NaB induces apoptosis and cell cycle arrest in the G1/G0 phase, accompanied by terminal cell differentiation in several colon cancer cell lines [11–13]. The mechanism by which NaB induces differentiation primarily involves epigenetic regulation of gene expression through the inhibition of histone deacetylases (HDACs) [14], which remove acetyl groups from lysine residues of histones and decrease the affinity of protein transcription complexes for DNA.
Numerous studies have evaluated the antitumor activities of green tea phenolics in different experimental systems. The general consensus is that these tea components promote cancer cell growth inhibition and apoptosis, and reduce invasion, angiogenesis and metastasis [15]. A plethora of molecular mechanisms of tea phenolics has been suggested, including anti-oxidant and pro-oxidant effects, inhibition of mitogen-activated protein kinases, or modulation of growth factor receptor tyrosine kinases and the activity of transporters through alteration of lipid rafts by tea catechins (reviewed in Ref. [16]).
The effect of green tea catechins on differentiation has been addressed in several cell lines [17–19], including colon cancer cells [20], in which their effects appear to be cell line-specific. Moreover, a recent study has investigated the impact of green tea phenolics on NaB-induced colon cancer cells differentiation and concluded that changes in NaB uptake in Caco2 cells induced by phenolics do not correlate with changes upon cell differentiation [21]. In the present study we evaluated the effect of the major green tea phenolics (−)-epigallocatechin gallate (EGCG) and (−)-epicatechin (EC) on NaB-induced differentiation in human colon adenocarcinoma HT29 cells. We demonstrate that phenolics interfere with NaB induced differentiation, and we propose a mechanism for this inhibition based on the altered localization of a monocarboxylate transporter in plasma membrane lipid rafts.
2. Materials and methods
2.1. Chemicals and cell culture conditions
All chemicals were purchased from Sigma-Aldrich Co. (St. Louis, MO), unless otherwise specified. HT29 human colon adenocarcinoma cells (obtained from the American Type Culture Collection) were grown in Dulbecco's modified Eagle medium 25 mM d-glucose supplemented with 10% heat-inactivated fetal calf serum (PAA Laboratories, Pasching, Austria) and 0.1% antibiotics (100 U/mL penicillin and 100 μg/mL streptomycin) (Invitrogen, Paisley, UK). Caco2 cells were maintained in Dulbecco's modified Eagle medium 25 mM d-glucose, 20% fetal calf serum, 2 mM glutamine, and 1% antibiotics (100 U/mL penicillin and 100 μg/mL streptomycin). NCM460 (INCELL Corporation, San Antonio, Texas, USA) is an epithelial cell line derived from the healthy colon mucosa of a 68-year-old Hispanic male [22]. These cells were grown as a monolayer culture in M3Base medium (which contains growth supplements and antibiotics) supplemented with 10% heat-inactivated FCS and 2.5 mM of d-glucose. Cells were cultured at 37 °C in a humidified atmosphere with 5% CO2.
2.2. Determination of cell viability
Assays were performed using a variation of the MTT assay described by Mosmann [23]. HT29 cells were seeded at 3 × 10³ cells/well in 96-well flat-bottom plates. After 24 h of incubation at 37 °C, fresh media containing (−)-epicatechin (EC) and (−)-epigallocatechin gallate (EGCG) at different concentrations were added. After 72 h, the media was removed, and 50 μL of MTT (1 mg/mL in phosphate buffered saline) with 50 μL of fresh medium was added to each well and incubated for 1 h. The MTT reduced to blue formazan and the precipitate was dissolved in 100 μL of dimethyl sulfoxide. Absorbance values were measured on an ELISA plate reader (550 nm) (Tecan Sunrise MR20-301, Tecan, Salzburg, Austria).
2.3. Alkaline phosphatase (AP) activity assay
AP activity was measured using p-nitrophenyl phosphate as a substrate according to the published procedures [24]. HT29 cell cultures were started with 6 × 10⁵ in 60-cm2 petri dishes and incubated for 24 h at 37 °C. New medium containing phenolics, butyrate (NaB) and NaB + phenolics was added and incubated for 24, 48 and/or 72 h at 37 °C. The medium was changed every 24 h. After incubation, the cells were washed with phosphate buffered saline (PBS), detached from the flasks using 0.025% trypsin-EDTA (Invitrogen) and then resuspended in lysis buffer (1 mM dithiothreitol, 1 mM EDTA, 0.02% Triton X-100, 0.02% sodium deoxycholate, 0.2 mM phenylmethylsulfonyl fluoride, 1% sodium azide and 20 mM Tris-HCl, pH 7.5). Cells were homogenized using a laboratory sonicator (1/2 Liter Branson 200 Ultrasonic bath, 5 min, 40 kHz, 4 °C) and immediately ultracentrifuged at 105,000 ×g for 1 h at 4 °C. The supernatant was separated and used for the determination of AP activity using a Cobas Mira Plus chemistry analyzer (HORIBA ABX, Montpellier, France). The enzyme activity was estimated by measuring the absorbance at 405 nm due to formation of p-nitrophenol and was expressed as mU/mg of protein. Protein determination was performed in the same lysates using the BCA protein assay (Pierce Biotechnology, Rockford, IL).
2.4. Histone deacetylase (HDAC) assay
HT29 cells were incubated in 60-cm2 petri dishes for 48–72 h at 37 °C (65–85% confluence). Next, cells were washed in PBS pH 7.4 followed by incubation in hypotonic buffer (20 mM HEPES pH 7.6, 20% glycerol, 10 mM NaCl, 1.5 mM MgCl2, 0.2 mM EDTA, 0.1% Triton X-100) for 5 min. Then, cells were collected and nuclei pelleted at 1000 rpm in the microfuge for 10 min. Purified nuclei were resuspended in hypertonic buffer (20 mM HEPES pH 7.6, 20% glycerol, 450 mM NaCl, 1.5 mM MgCl2, 0.2 mM EDTA, 0.1% Triton X-100) and gently shaken for 1 h at 4 °C. After centrifuging at 13,000 rpm in the microfuge for 5 min at 4 °C, the supernatant obtained was the nuclear extract. Then, nuclear extracts of non-treated HT29 cells were quantified using a standard BCA Protein Assay (Pierce Biotechnology, Rockford, IL) and an equivalent quantity of protein was subjected to treatment with NaB and NaB/phenolics for 30 min at 37 °C. HDAC activity was measured employing a Fluorometric Assay Kit (Biovision), following manufacturer's instructions. The procedure involves the use of the HDAC substrate, which consists of an acetylated lysine side chain, and incubation with a sample containing nuclear extract. Deacetylation sensitizes the substrate, and treatment with the lysine developer produces a fluorophore, which can be analyzed with a fluorometer (Ex/Em = 350 — 380/440 — 460 nm). A HeLa cell nuclear extract was used as a positive control. Percent inhibition of treated cells was compared with HT29untreated controls.
2.5. [14C]-NaB uptake
HT29 cells were seeded at 2 × 10⁴ cells/well in 24-well plates. After 24 h of incubation at 37 °C, fresh media containing NaB and NaB + phenolics was added and incubated for 48 hat 37 °C. The medium was changed after 24 h of incubation and left 24 h more. Next, cells were incubated at room temperature for 20 min in tracer-free buffer containing (in mM): 110 NaCl, 1 CaCl2, 4 KCl, 0.44 K2HPO4, 1 MgSO4, 5 glucose, 50 mannitol and 5 HEPES, pH 7.4. Cells were then washed and incubated with buffer containing (in mM): 259 mannitol, 20 HEPES, pH 6.5, 2 [14C]-NaB (1 μCi/mL) for 5 min. The uptake was stopped by washing the cells twice with ice-cold PBS. Finally, cells were solubilized with 0.5 N NaOH for at least 4 h. The protein concentration was measured by the method of BCA. Incorporated radioactivity was counted by a Tri-CARB 1600-TR liquid scintillation counter (Packard Instruments, Downers Grove, IL). The values were expressed as nmol/mg protein/5 min.
2.6. Cell lysates and Western blotting
6 × 10⁵ HT29 cells were plated on 60-cm2 petri dishes and incubated for 24 h. Then, fresh medium with NaB and NaB + phenolics was added and incubated for 48 h. After incubation, the cells were washed with ice-cold PBS and lysed in 20 mM Tris·HCl, pH 7.5, 150 mM NaCl, 1% Triton X-100, 1 mM EDTA, 1 mM EGTA, and 1× complete protease inhibitor cocktail. The lysate was sonicated and centrifuged at 5,000 ×g for 5 min at 4 °C, and protein concentration was determined by Bradford. The samples obtained above were subjected to 10% SDS–PAGE and transferred to nitrocellulose membranes. MCT1 expression was detected utilizing human anti MCT1 antibody (Santa Cruz Biotechnology, sc-50324). Flotillin expression was analyzed using human anti flotillin antibody (BD Transduction Laboratories, 610820). β-Actin was used as a loading control (MP Biomedicals, Eschwege, Germany, 69100).
2.7. Rafts isolation and biochemical characterization
Lipid rafts were isolated by floatation on OptiPrep density gradient as previously described [25]. HT29 human colon adenocarcinoma cells were started in 60-cm2 petri dishes with the same number of cells (6 × 10⁵) and incubated for 24 h at 37 °C. Then, cells were exposed to or not exposed to NaB or NaB + phenolics for 48 h. After incubation, cells were resuspended and incubated for 30 min at 4 °C in TNE buffer containing (in mM) 25 Tris (pH 7.4), 150 NaCl, 5 EDTA, and 1% Triton X-100 supplemented with 1× complete protease inhibitor cocktail. The membranes were then adjusted to 40% final concentration of OptiPrep and layered at the bottom of density gradient with steps of final concentrations of 35, 30, 25, and 20% of OptiPrep in TNE buffer. TNE buffer was laid on the top of the gradient, which was then centrifuged at 48,000 rpm for 4 h at 4 °C. Fractions of 1 mL were collected from the top to the bottom of the gradient and then analyzed by Western blotting (see above). MCT1 and the described marker for lipid rafts, flotillin, were analyzed in each fraction [26].
2.8. Data presentation and statistical analysis
Data are given as the means ± S.D. (standard deviation). For each assay, the parametric unpaired two-tailed independent sample t-test was used and differences were considered to be significant when p < 0.05 or p < 0.001.
3. Results
3.1. Viability of HT29 cells treated with (−)-epicatechin (EC) and (−)-epigallocatechin gallate (EGCG)
To determine a non-toxic but still active concentration of EC and EGCG, HT29 cell viability was determined in the presence of different phenolic concentrations (Fig. 1). From the obtained dose-viability curve we estimated the inhibitory concentration 20 (IC20), defined as the concentration of product that causes 20% inhibition of cell viability with respect to viability of control (non-treated) cells after 72 h. Although increasing concentrations of both EC and EGCG produced a dose-dependent decrease in cell viability, EGCG was much more efficient at doing so. The 72 h IC20 values obtained were 100 μM for EC and 20 μM for EGCG, which were the concentrations used throughout the study.
Fig. 1.
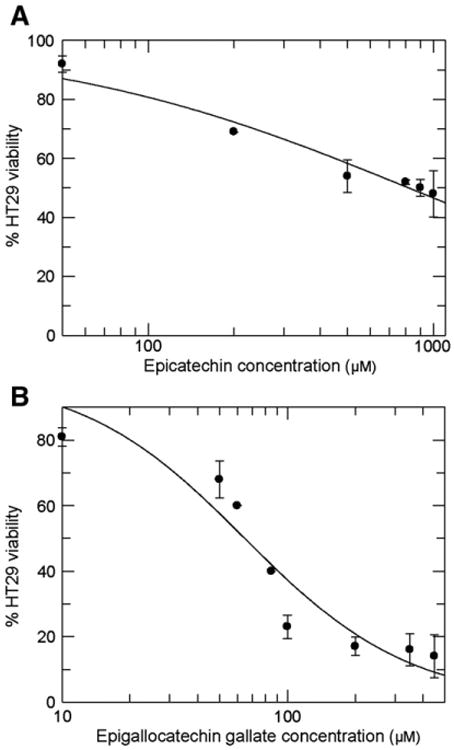
Dose–effect curves of (−)-epicatechin and (−)-epigallocatechin gallate on cell viability. HT29 cell cultures were treated with increasing doses of (−)-epicatechin (EC) (A) or (−)-epigallocatechin gallate (EGCG) (B) as indicated on the x axis for 72 h. Cell viability was expressed as a percentage with respect to untreated control. IC20 (EC) = 100 μM and IC20 (EGCG) = 20 μM.
3.2. Phenolics reduce butyrate (NaB)-induced differentiation in colorectal adenocarcinoma cell lines
Firstly, we studied whether EC and EGCG affected NaB-induced differentiation. Cells were exposed to 2 mM NaB for 24, 48 and 72 h, alone or in the presence of 100 μM EC or 20 μM EGCG. NaB-induced differentiation measured as an increase in alkaline phosphatase (AP) activity, was reduced by both phenolics at 48 and 72 h of combined treatment (Fig. 2A). EC also reduced NaB-induced AP activity at 24 h (Fig. 2A). It should be noted that treatments with phenolics alone had no impact on differentiation (Fig. 2B). To rule out a direct effect of the phenolics on AP activity, we repeated the experiments measuring the activity of another differentiation marker (aminopeptidase N) at 48 h. Consistently, phenolics reduced NaB-induced differentiation (Supplemental Fig. 1A) and did not show an increase in differentiation when used alone (Supplemental Fig. 1B). This effect of phenolics was also extended to another epithelial colorectal adenocarcinoma cell line, Caco2, which showed the same differentiation profile with respect to NaB and phenolics treatment (Supplemental Fig. 2A and B).
Fig. 2.
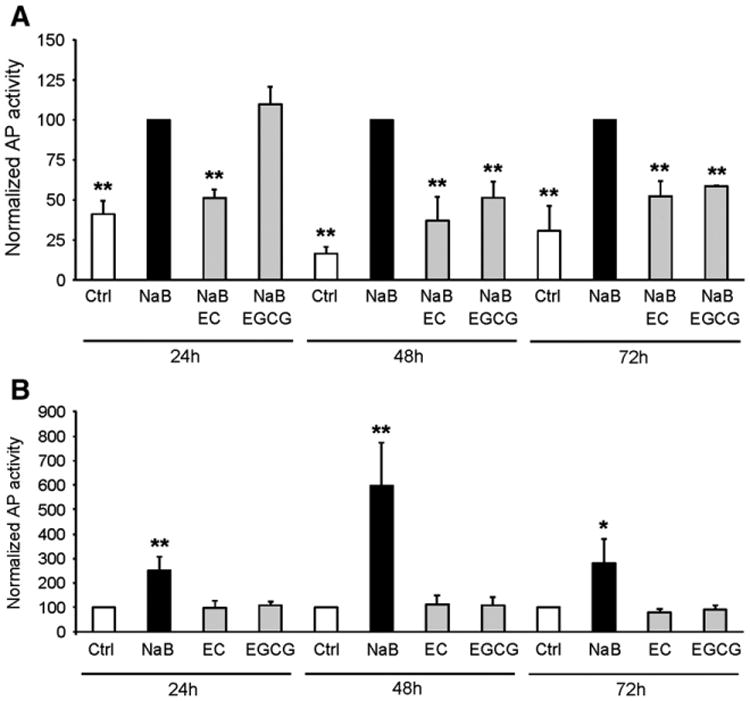
Phenolics reduce butyrate-induced differentiation. (A) HT29 cells were treated with butyrate (NaB) 2 mM or with NaB and phenolics (EC 100 μM and EGCG 20 μM) for 24, 48 and 72 h and alkaline phosphatase (AP) activity was measured and normalized by protein level. The data are normalized and statistically tested with respect to NaB-treated cells. Mean ± SD; n ≥ 3;**Different from NaB, p < 0.01. (B) HT29 cells were treated with NaB 2 mM or with phenolics alone (EC 100 μM and EGCG 20 μM) for 24, 48 and 72 h and AP activity was measured. The data are normalized and statistically tested with respect to Ctrl cells. Values are mean ± SD; n ≥ 3; */**Different from Ctrl, p < 0.05/p < 0.01.
To verify whether our observations were cancer cell line-specific, we determined NCM460 cell differentiation, measured as AP activity, after incubation with 2 mM NaB, alone or in the presence of 100 μM EC or 20 μM EGCG, for 24, 48 and 72 h. Supplemental Fig. 3 shows that cell differentiation was not significantly altered when NCM460 cells were treated with NaB and phenolics.
3.3. The effect of tea phenolics on differentiation is not related to histone deacetylase (HDAC) activity modulation
Given that the NaB-induced differentiation is related to its inhibition of HDAC activity [27], we decided to study the effects of EC and EGCG in HDAC-related differentiation. Firstly, we studied whether phenolics modified differentiation induced by trichostatin A (TSA), another well-described HDAC inhibitor. HT29 cells were exposed to 180 nM TSA for 48 h, alone or in presence of 100 μM EC and 20 μM EGCG. The addition of phenolics to TSA had no impact on TSA-induced differentiation, measured as AP activity (Fig. 3A).
Fig. 3.
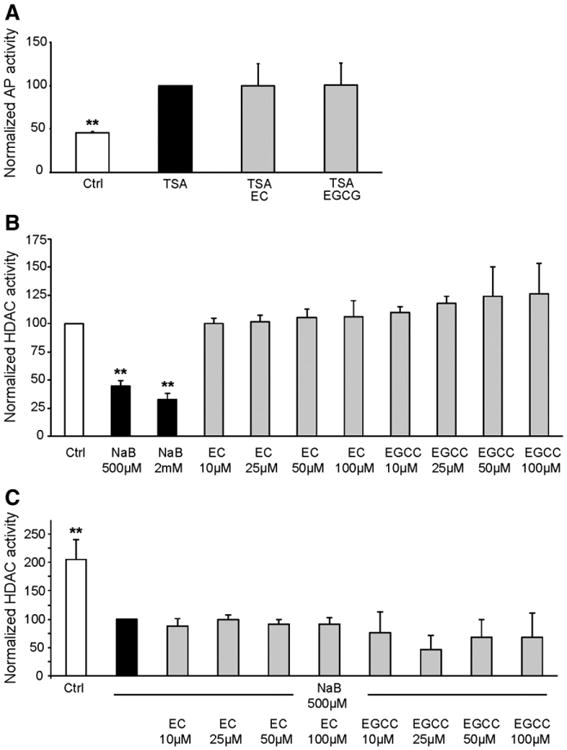
Phenolics effect on differentiation is not histone deacetylase-related. (A) HT29 cells were treated with TSA at 180 nM or with TSA in the presence of phenolics (EC 100 μM and EGCG 20 μM) for 48 h and AP activity was measured. Data are normalized and statistically tested with respect to TSA-treated cells. Mean ± SD; n = 3; **Different from TSA, p < 0.01. (B) Histone deacetylase (HDAC) activity determined in nuclear extracts from HT29 cells after treatment with NaB or NaB with phenolics for 30 min. The data are normalized and statistically tested with respect to Ctrl cells. Values are mean ± SD; n ≥ 2; **Different from Ctrl, p < 0.01. (C) HDAC activity determined in nuclear extracts from HT29 cells after treatment with NaB or phenolics for 30 min. The data are normalized and statistically tested with respect to NaB cells. Mean ± SD; n ≥ 2; **Different from NaB, p < 0.01.
To confirm these results, we wondered whether phenolic compounds could directly alter the HDAC activity of HT29. We determined the HDAC activity of nuclear extracts after incubation with NaB and phenolics alone or in combination. As expected, NaB was found to be a potent HDAC inhibitor, significantly decreasing HDAC activity by 55% and 67% at 500 μM and 2 mM of NaB, respectively (Fig. 3B). Phenolics had no effect with respect to HDAC activity, both when incubated alone (Fig. 3B) and incubated simultaneously with NaB (Fig. 3C). These results led us to conclude that phenolics do not affect NaB differentiation by directly modulating HDAC activity.
3.4. Phenolics impair NaB entry to the cell
To study the mechanism of interference between NaB and phenolics we studied the cellular entry of NaB into HT29 cells. HT29 cells were incubated with 2 mM NaB alone or in the presence of 100 μM EC and 20 μM EGCG for 48 h and acute [14C]-NaB incorporation was measured. We observed that NaB treatment enhanced its own transport (Fig. 4). Moreover, we detected a significant decrease in [14C]-NaB cellular entry after NaB and phenolics incubation relative to NaB-treated cells (Fig. 4).
Fig. 4.
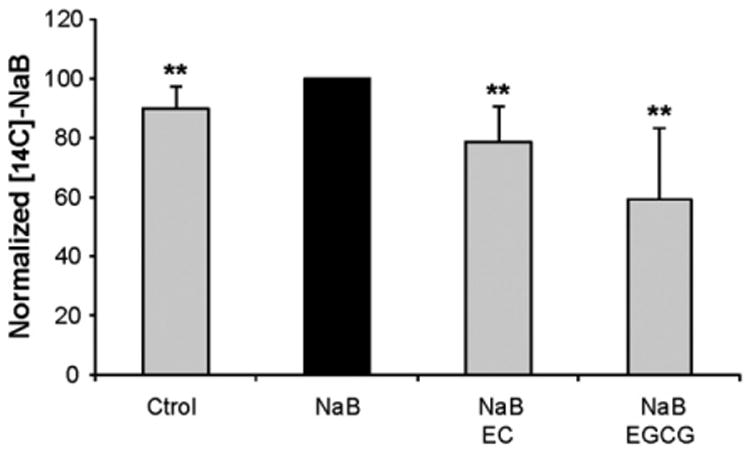
Phenolics impair NaB influx into the cells. HT29 cells were treated with NaB 2 mM or with NaB and phenolics (EC 100 μM or EGCG 20 μM) for 48 h. Acute [14C]-NaB uptake was subsequently measured as described in Materials and methods. Results are normalized and statistically tested with respect to NaB cells. Values are mean ± SD; n ≥ 2; **Different from NaB, p < 0.01.
3.5. The effect of tea phenolics on NaB-induced differentiation is not related to monocarboxylate transporter 1 (MCT1) expression, but with its membrane localization
Next, we evaluated the role of the intestinal transporter MCT1, which is known to be involved in NaB transport [28]. We examined MCT1 protein expression in response to NaB and phenolics. Western blot analysis of MCT1 showed no differences at protein level in any of the treatments (Fig. 5A).
Fig. 5.
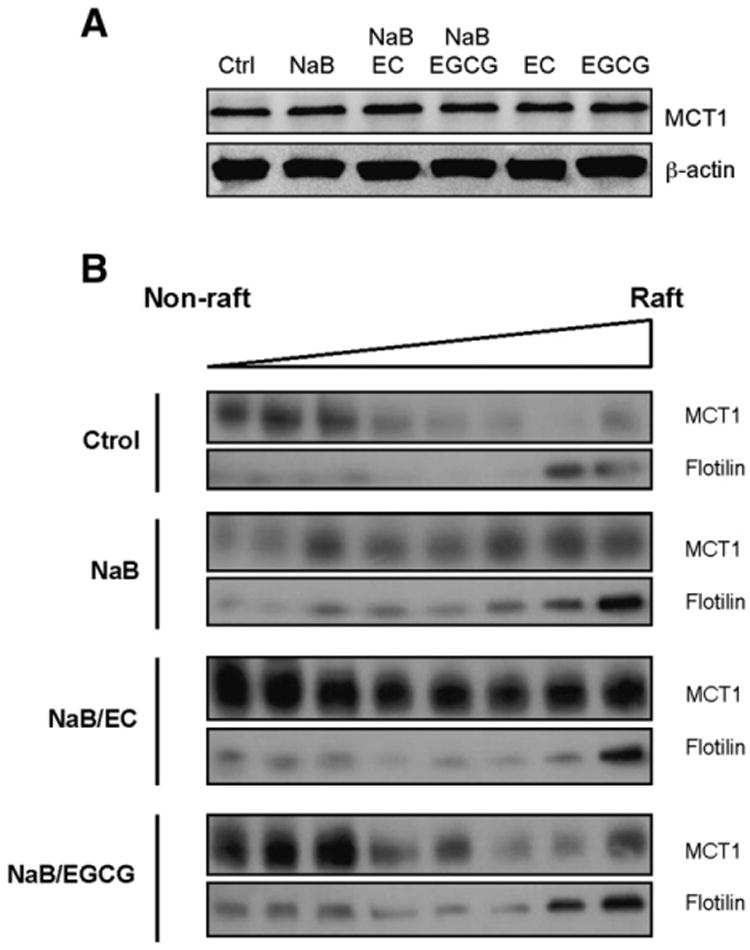
Effect of NaB and phenolics on monocarboxylate transporter 1 (MCT1). (A) After 48 h of incubation with NaB, phenolics or both, HT29 lysates were probed against MCT1 in a Western blot, using β-actin as a loading control. A representative blot is shown. (B) EC and EGCG antagonize plasma membrane redistribution of MCT1 caused by NaB. HT29 cells were incubated with NaB or NaB/phenolics for 48 h and then lysed and laid at the bottom of an OptiPrep density gradient. After ultracentrifugation, fractions were collected from the top (lipid rafts low-density fractions) to the bottom of the gradient (high-density non-raft fractions). Proteins in the fractions were separated on 10% SDS–PAGE and blots were probed with anti-MCT1 or anti-flotillin antibodies.
Since phenolics have been shown to be lipid raft regulators [29], we next investigated whether EC and EGCG caused any alterations in the association of MCT1 with lipid rafts. Lipid raft microdomains were isolated by OptiPrep gradient ultracentrifugation and proteins in the gradient fractions were analyzed by SDS–PAGE and Western blot. Flotillin rich fractions account for the lipid rafts. As shown in Fig. 5B, MCT1 was predominantly expressed in these high-density non-raft fractions of control HT29 cells, even though some MCT1 expression was found in lipid rafts-corresponding fractions. NaB treatment for 48 h enhanced the presence of MCT1 in low-density fractions representing lipid rafts. When phenolics were added to NaB, MCT1 was redistributed in all fractions, counteracting NaB-mediated enhanced localization of the transporter in the lipid rafts (Fig. 5B).
4. Discussion
In this study we analyzed the effect of phenolics (−)-epicatechin (EC) and (−)-epigallocatechin gallate (EGCG) on butyrate (NaB)-induced differentiation. We decided to use the IC20 concentrations at 72 h (EC: 100 μM, EGCG: 20 μM) to avoid massive cell damage by phenolics. We used a NaB concentration of 2 mM, which has been demonstrated to induce differentiation in HT29 colon cancer cells [9]. Although treatment with EC and EGCG alone did not change cell differentiation, NaB-induced differentiation was reduced by both phenolics in colon cancer cells (Fig. 2, Supplemental Fig. 1, Supplemental Fig. 2). In contrast, previous studies using colon cancer Caco2 cells showed that ECGC was not able to revert the differentiation induced by NaB [21]. This discrepancy could be explained because a larger concentration of NaB (5 mM) and lower concentrations of EGCG (0.1–10 μM) were used. Worthy of note, since NaB effects were not exerted on the non-tumoral NCM460 cells (Supplemental Fig. 3), the observed effects are cancer cell specific.
The mechanism of action of NaB in colon cancer mainly includes effects on differentiation via its inhibition of histone deacetylases (HDACs). EGCG has also been identified as an inhibitor of HDAC activity in prostate, skin and breast cancer cells [30]. However, studies in HT29 cells have found no significant change in the HDAC activity of cytoplasmic or nuclear fractions after sulforaphane and EGCG treatment [31]. Similarly, we also failed to detect any significant inhibition of HDAC activity in vitro by EC and EGCG (Fig. 3B), and differentiation was not impaired in response to treatment with trichostatin A (TSA) (Fig. 3A), another well-known HDAC inhibitor also proposed as anti-tumor agent [32].
The effect of phenolics on NaB-induced differentiation could be due to an interaction between NaB and phenolics that prevents the entry and cellular action of NaB. Determination of [14C]-NaB uptake showed that although NaB treatment stimulated its own transport, phenolic treatment impaired NaB uptake (Fig. 4). It has been previously reported that phenolics differentially affect NaB uptake depending on the studied compound, the time of incubation and the NaB concentration used. Nevertheless, on the contrary to our observations, the differences in NaB uptake induced by phenolics did not correlate with changes in the anticarcinogenic activity including effects on cell differentiation [21].
The impairment of NaB uptake by phenolics led us to study NaB intestinal transporters. NaB enters into colonocytes by two major carrier-mediated mechanisms, the Na+-coupled monocarboxylate transporter 1 (SMCT1) and the aforementioned H+-coupled monocarboxylate transporter 1 (MCT1). Since their substrate, NaB, prevents and inhibits colon carcinogenesis, both transporters have been proposed to function as tumor suppressors [33]. Accordingly, MCT1 expression has been shown to be down-regulated during transition from normalcy to malignancy in colonic tissues. Regarding SMCT1 expression, it has been found to be silenced in colorectal carcinoma and colon cancer cell lines such as HT29 and Caco2 [34]. Moreover, given that some phenolics have been described to interplay with MCT1 [35–38], the next step was the evaluation of MCT1 expression. A substrate-induced MCT1 activity by NaB at higher concentrations has been previously demonstrated in AA/C1 human colonic epithelial cells [39] and colon cancer Caco2 cells [40]. However, no change in MCT1 protein levels was induced by NaB, phenolics, or both (Fig. 5A).
Since we did not detect an enhanced MCT1 protein, we investigated the possibility of another mechanism to explain the effects of phenolics on NaB-induced differentiation. This mechanism may imply alterations in transduction pathways or cellular membrane characteristics that affect the intrinsic activity of the transporter [21]. Recent reports have indicated that optimal function of many transporters is dependent on their association with lipid rafts [41]. Lipid rafts are defined as microdomains within the lipid bilayer of cellular membranes that assemble subsets of transmembrane or glycosylphosphatidylinisotol-anchored proteins and lipids (cholesterol and sphingolipids) and experimentally resist extraction in cold detergent. Interestingly, lipid rafts have been related to some of the biological effects induced by tea phenolics [42]. EGCG has been shown to prevent activation of c-Met receptor [43] and epidermal growth factor receptor (EGFR) [44] via perturbations of the membrane lipid rafts. Similarly, our analysis of lipid raft-dependent MCT1 function in HT29 cells suggests that NaB activates MCT1 functions at least in part by enhancing its distribution in lipid rafts, and that tea phenolics produce a redistribution of MCT1 in the non-lipid raft fractions (Fig. 5B). These observations led us to hypothesize that EGCG and EC might inhibit MCT1-mediated NaB transport by altering lipid raft organization. At the same time, this provides an explanation for the observed increase in NaB uptake after NaB treatment (Fig. 4), which could not be explained by changes in the quantity of MCT1 (Fig. 5A), but due to the modulation of lipid rafts by 2 mM NaB (Fig. 5B).
It has been shown that the chemical structure of phenolics is related to their biological activity [45]. In green tea catechins, the most bioactive catechin has been described to be EGCG, which contains a trihydroxyl structure in the D ring (gallate) as well as a pyrogallol B-ring, followed closely by ECG with a gallate group, and then to a lesser extent EGC and EC that possess a basic structure [46]. We have observed that although the global trend of EC and EGCG treatments is similar, small changes regarding the efficiency of both compounds can be distinguished. Apart from differences in the chemical structure, differences in the modulation of signal transduction pathways that affect the activity of the transporter or the process of differentiation may also account for the differences observed throughout the study.
As previously mentioned, several studies (4–6) have described an increase in cecal concentration of short chain fatty acids in response to phenolics. However, the mechanism by which phenolics induce this increase is not known. First of all, we hypothesize that modulation of intestinal microbiota by phenolics to increase production of fermentation products, such as NaB, might compensate the inhibition of cellular NaB uptake described in this study. On the other hand, we propose that the increase in intestinal NaB concentration found in previous studies may be, at least in part, a consequence of the inhibitory action of phenolics on NaB intestinal uptake.
5. Conclusions
The present study provides novel evidence that the tea phenolics EC and EGCG impair NaB uptake and the subsequent NaB-induced differentiation in HT29 cells. These novel findings suggest that although both NaB and green tea catechins have been reported to have a wide range of beneficial effects for human health, when used in tandem the functions of the two compounds interfere at a cellular level. This suggests that NaB and green tea catechins should be used separately. Further studies may be required to investigate the physiological significance of our findings, which provides a better understanding about the interactions of prebiotics and may aid in preparing a rational design for preventive and therapeutic interventions.
Supplementary Material
Acknowledgments
The authors thank Ursula Valls Benavides, Marta Camps Camprubí, Mireia Pérez Verdaguer and Anna Oliveras Martínez for technical support in the experiments and all Pradeep K. Dudeja lab members, especially Arivarasu N. Anbazhagan, for help and support during the stay in their city and laboratory. Funding was provided by Spanish government (grants SAF2011-25726, AGL200912374-C03-03/ALI and personal financial support-FPU program); Spanish Networks RTICC RD06/0020/0046; AGAUR—Generalitat de Catalunya (grants 2009SGR1308 and Icrea Academia award 2010 to M.C.); NIDDK grants DK54016, DK81858 and DK92441; and European Commission (FP7) (ETHERPATHS KBBE-grant agreement 222639 and COSMOS KBBE-grant agreement 312941).
Abbreviations
- AP
alkaline phosphatase
- NaB
butyrate
- EC
(−)-epicatechin
- EGCG
(−)-epigallocatechin gallate
- HDAC
histone deacetylase
- MCT1
monocarboxylate transporter 1
- MTT
3-(4,5-dimethylthiazol-2-yl)-2,5-diphenyltetrazolium bromide
- TSA
trichostatin A
Footnotes
Supplementary data to this article can be found online at http://dx.doi.org/10.1016/j.bbadis.2013.08.009.
Conflict of interest: The authors declare that they have no conflict of interest.
Contributor Information
S. Sánchez-Tena, Email: ssanchezt@ub.edu.
P. Vizán, Email: Pedro.Vizan@crg.eu.
P.K. Dudeja, Email: pkdudeja@uic.edu.
J.J. Centelles, Email: josepcentelles@ub.edu.
M. Cascante, Email: martacascante@ub.edu.
References
- 1.Jemal A, Center MM, DeSantis C, Ward EM. Global patterns of cancer incidence and mortality rates and trends. Cancer Epidemiol Biomarkers Prev. 2010;19:1893–1907. doi: 10.1158/1055-9965.EPI-10-0437. [DOI] [PubMed] [Google Scholar]
- 2.Watson AJ, Collins PD. Colon cancer: a civilization disorder. Digest Dis (Basel, Switzerland) 2011;29:222–228. doi: 10.1159/000323926. [DOI] [PubMed] [Google Scholar]
- 3.Ferguson LR, Chavan RR, Harris PJ. Changing concepts of dietary fiber: implications for carcinogenesis. Nutr Cancer. 2001;39:155–169. doi: 10.1207/S15327914nc392_1. [DOI] [PubMed] [Google Scholar]
- 4.Juskiewicz J, Milala J, Jurgonski A, Krol B, Zdunczyk Z. Nutrition. Vol. 27. Burbank Los Angeles County; Calif: 2011. Consumption of polyphenol concentrate with dietary fructo-oligosaccharides enhances cecal metabolism of quercetin glycosides in rats; pp. 351–357. [DOI] [PubMed] [Google Scholar]
- 5.Kosmala M, Kolodziejczyk K, Zdunczyk Z, Juskiewicz J, Boros D. Chemical composition of natural and polyphenol-free apple pomace and the effect of this dietary ingredient on intestinal fermentation and serum lipid parameters in rats. J Agric Food Chem. 2011;59:9177–9185. doi: 10.1021/jf201950y. [DOI] [PubMed] [Google Scholar]
- 6.Juskiewicz J, Zary-Sikorska E, Zdunczyk Z, Krol B, Jaroslawska J, Jurgonski A. Effect of dietary supplementation with unprocessed and ethanol-extracted apple pomaces on caecal fermentation, antioxidant and blood biomarkers in rats. Br J Nutr. 2012;107:1138–1146. doi: 10.1017/S0007114511004144. [DOI] [PubMed] [Google Scholar]
- 7.Berni Canani R, Di Costanzo M, Leone L. The epigenetic effects of butyrate: potential therapeutic implications for clinical practice. Clin Epigenetics. 2012;4:4. doi: 10.1186/1868-7083-4-4. [DOI] [PMC free article] [PubMed] [Google Scholar]
- 8.Corfe BM, Williams EA, Bury JP, Riley SA, Croucher LJ, Lai DY, Evans CA. A study protocol to investigate the relationship between dietary fibre intake and fermentation, colon cell turnover, global protein acetylation and early carcinogenesis: the FACT study. BMC Cancer. 2009;9:332. doi: 10.1186/1471-2407-9-332. [DOI] [PMC free article] [PubMed] [Google Scholar]
- 9.Alcarraz-Vizan G, Boren J, Lee WN, Cascante M. Histone deacetylase inhibition results in a common metabolic profile associated with HT29 differentiation. Metabolomics. 2010;6:229–237. doi: 10.1007/s11306-009-0192-0. [DOI] [PMC free article] [PubMed] [Google Scholar]
- 10.Boren J, Lee WN, Bassilian S, Centelles JJ, Lim S, Ahmed S, Boros LG, Cascante M. The stable isotope-based dynamic metabolic profile of butyrate-induced HT29 cell differentiation. J Biol Chem. 2003;278:28395–28402. doi: 10.1074/jbc.M302932200. [DOI] [PubMed] [Google Scholar]
- 11.Andriamihaja M, Chaumontet C, Tome D, Blachier F. Butyrate metabolism in human colon carcinoma cells: implications concerning its growth-inhibitory effect. J Cell Physiol. 2009;218:58–65. doi: 10.1002/jcp.21556. [DOI] [PubMed] [Google Scholar]
- 12.Shen WJ, Dai DQ, Teng Y, Liu J. Effects of sodium butyrate on proliferation of human gastric cancer cells and expression of p16 gene. Zhonghua yi xue za zhi. 2008;88:1192–1196. [PubMed] [Google Scholar]
- 13.Humphreys KJ, Cobiac L, Le Leu RK, Van der Hoek MB, Michael MZ. Histone deacetylase inhibition in colorectal cancer cells reveals competing roles for members of the oncogenic miR-17-92 cluster. Mol Carcinog. 2013;52:459–474. doi: 10.1002/mc.21879. [DOI] [PubMed] [Google Scholar]
- 14.Carafa V, Nebbioso A, Altucci L. Histone deacetylase inhibitors: recent insights from basic to clinical knowledge & patenting of anti-cancer actions. Recent Pat Anticancer Drug Discov. 2011;6:131–145. doi: 10.2174/157489211793980088. [DOI] [PubMed] [Google Scholar]
- 15.Kanwar J, Taskeen M, Mohammad I, Huo C, Chan TH, Dou QP. Recent advances on tea polyphenols. Front Biosci (Elite Ed) 2012;4:111–131. doi: 10.2741/363. [DOI] [PMC free article] [PubMed] [Google Scholar]
- 16.Yang CS, Wang X. Green tea and cancer prevention. Nutr Cancer. 2010;62:931–937. doi: 10.1080/01635581.2010.509536. [DOI] [PubMed] [Google Scholar]
- 17.Balasubramanian S, Ecker RL. Keratinocyte proliferation, differentiation, and apoptosis—differential mechanisms of regulation by curcumin, EGCG and apigenin. Toxicol Appl Pharmacol. 2007;224:214–219. doi: 10.1016/j.taap.2007.03.020. [DOI] [PMC free article] [PubMed] [Google Scholar]
- 18.Lamy S, Gingras D, Beliveau R. Green tea catechins inhibit vascular endothelial growth factor receptor phosphorylation. Cancer Res. 2002;62:381–385. [PubMed] [Google Scholar]
- 19.Oka Y, Iwai S, Amano H, Irie Y, Yatomi K, Ryu K, Yamada S, Inagaki K, Oguchi K. Tea polyphenols inhibit rat osteoclast formation and differentiation. J Pharmacol Sci. 2012;118:55–64. doi: 10.1254/jphs.11082fp. [DOI] [PubMed] [Google Scholar]
- 20.Lea MA, Ibeh C, Han L, Desbordes C. Inhibition of growth and induction of differentiation markers by polyphenolic molecules and histone deacetylase inhibitors in colon cancer cells. Anticancer Res. 2010;30:311–318. [PubMed] [Google Scholar]
- 21.Gonçalves P, Araujo JR, Pinho MJ, Martel F. In vitro studies on the inhibition of colon cancer by butyrate and polyphenolic compounds. Nutr Cancer. 2011;63:282–294. doi: 10.1080/01635581.2011.523166. [DOI] [PubMed] [Google Scholar]
- 22.Moyer MP, Manzano LA, Merriman RL, Stauffer JS, Tanzer LR. NCM460, a normal human colon mucosal epithelial cell line. In Vitro Cell Dev Biol. 1996;32:315–317. doi: 10.1007/BF02722955. [DOI] [PubMed] [Google Scholar]
- 23.Sanchez-Tena S, Fernandez-Cachon ML, Carreras A, Mateos-Martin ML, Costoya N, Moyer MP, Nunez MJ, Torres JL, Cascante M. Hamamelitannin from witch hazel (Hamamelis virginiana) displays specific cytotoxic activity against colon cancer cells. J Nat Prod. 2012;75:26–33. doi: 10.1021/np200426k. [DOI] [PubMed] [Google Scholar]
- 24.Bergmeyer HU. Standardization of enzyme assays. Clin Chem. 1972;18:1305–1311. [PubMed] [Google Scholar]
- 25.Qiu Y, Wang Y, Law PY, Chen HZ, Loh HH. Cholesterol regulates micro-opioid receptor-induced beta-arrestin 2 translocation to membrane lipid rafts. Mol Pharmacol. 2011;80:210–218. doi: 10.1124/mol.110.070870. [DOI] [PMC free article] [PubMed] [Google Scholar]
- 26.Zhao F, Zhang J, Liu YS, Li L, He YL. Research advances on flotillins. Virol J. 2011;8:479. doi: 10.1186/1743-422X-8-479. [DOI] [PMC free article] [PubMed] [Google Scholar]
- 27.Waldecker M, Kautenburger T, Daumann H, Veeriah S, Will F, Dietrich H, Pool-Zobel BL, Schrenk D. Nutrition. Vol. 24. Burbank Los Angeles County; Calif: 2008. Histone-deacetylase inhibition and butyrate formation: fecal slurry incubations with apple pectin and apple juice extracts; pp. 366–374. [DOI] [PubMed] [Google Scholar]
- 28.Saksena S, Theegala S, Bansal N, Gill RK, Tyagi S, Alrefai WA, Ramaswamy K, Dudeja PK. Mechanisms underlying modulation of monocarboxylate transporter 1 (MCT1) by somatostatin in human intestinal epithelial cells. Am J Physiol. 2009;297:G878–G885. doi: 10.1152/ajpgi.00283.2009. [DOI] [PMC free article] [PubMed] [Google Scholar]
- 29.Colin D, Limagne E, Jeanningros S, Jacquel A, Lizard G, Athias A, Gambert P, Hichami A, Latruffe N, Solary E, Delmas D. Endocytosis of resveratrol via lipid rafts and activation of downstream signaling pathways in cancer cells. Cancer Prev Res (Phila) 2011;4:1095–1106. doi: 10.1158/1940-6207.CAPR-10-0274. [DOI] [PubMed] [Google Scholar]
- 30.Waldecker M, Kautenburger T, Daumann H, Busch C, Schrenk D. Inhibition of histone-deacetylase activity by short-chain fatty acids and some polyphenol metabolites formed in the colon. J Nutr Biochem. 2008;19:587–593. doi: 10.1016/j.jnutbio.2007.08.002. [DOI] [PubMed] [Google Scholar]
- 31.Nair S, Hebbar V, Shen G, Gopalakrishnan A, Khor TO, Yu S, Xu C, Kong AN. Synergistic effects of a combination of dietary factors sulforaphane and (−) epigallocatechin-3-gallate in HT-29 AP-1 human colon carcinoma cells. Pharm Res. 2008;25:387–399. doi: 10.1007/s11095-007-9364-7. [DOI] [PubMed] [Google Scholar]
- 32.Amoedo ND, Rodrigues MF, Pezzuto P, Galina A, da Costa RM, de Almeida FC, El-Bacha T, Rumjanek FD. Energy metabolism in H460 lung cancer cells: effects of histone deacetylase inhibitors. PLoS One. 2011;6:e22264. doi: 10.1371/journal.pone.0022264. [DOI] [PMC free article] [PubMed] [Google Scholar]
- 33.Gonçalves P, Araujo JR, Martel F. Characterization of butyrate uptake by nontransformed intestinal epithelial cell lines. J Membr Biol. 2011;240:35–46. doi: 10.1007/s00232-011-9340-3. [DOI] [PubMed] [Google Scholar]
- 34.Borthakur A, Anbazhagan AN, Kumar A, Raheja G, Singh V, Ramaswamy K, Dudeja PK. The probiotic Lactobacillus plantarum counteracts TNF-{alpha}-induced downregulation of SMCT1 expression and function. Am J Physiol. 2010;299:G928–G934. doi: 10.1152/ajpgi.00279.2010. [DOI] [PMC free article] [PubMed] [Google Scholar]
- 35.Konishi Y, Kobayashi S, Shimizu M. Tea polyphenols inhibit the transport of dietary phenolic acids mediated by the monocarboxylic acid transporter (MCT) in intestinal Caco-2 cell monolayers. J Agric Food Chem. 2003;51:7296–7302. doi: 10.1021/jf034894t. [DOI] [PubMed] [Google Scholar]
- 36.Shim CK, Cheon EP, Kang KW, Seo KS, Han HK. Inhibition effect of flavonoids on monocarboxylate transporter 1 (MCT1) in Caco-2 cells. J Pharm Pharmacol. 2007;59:1515–1519. doi: 10.1211/jpp.59.11.0008. [DOI] [PubMed] [Google Scholar]
- 37.Vaidyanathan JB, Walle T. Cellular uptake and efflux of the tea flavonoid (−) epicatechin-3-gallate in the human intestinal cell line Caco-2. J Pharmacol Exp Ther. 2003;307:745–752. doi: 10.1124/jpet.103.054296. [DOI] [PubMed] [Google Scholar]
- 38.Wang Q, Morris ME. Flavonoids modulate monocarboxylate transporter-1-mediated transport of gamma-hydroxybutyrate in vitro and in vivo. Drug Metab Dispos. 2007;35:201–208. doi: 10.1124/dmd.106.012369. [DOI] [PubMed] [Google Scholar]
- 39.Cuff MA, Lambert DW, Shirazi-Beechey SP. Substrate-induced regulation of the human colonic monocarboxylate transporter, MCT1. J Physiol. 2002;539:361–371. doi: 10.1113/jphysiol.2001.014241. [DOI] [PMC free article] [PubMed] [Google Scholar]
- 40.Borthakur A, Saksena S, Gill RK, Alrefai WA, Ramaswamy K, Dudeja PK. Regulation of monocarboxylate transporter 1 (MCT1) promoter by butyrate in human intestinal epithelial cells: involvement of NF-kappaB pathway. J Cell Biochem. 2008;103:1452–1463. doi: 10.1002/jcb.21532. [DOI] [PMC free article] [PubMed] [Google Scholar]
- 41.Chen G, Howe AG, Xu G, Frohlich O, Klein JD, Sands JM. Mature N-linked glycans facilitate UT-A1 urea transporter lipid raft compartmentalization. FASEB J. 2011;25:4531–4539. doi: 10.1096/fj.11-185991. [DOI] [PMC free article] [PubMed] [Google Scholar]
- 42.Patra SK, Rizzi F, Silva A, Rugina DO, Bettuzzi S. Molecular targets of (−)-epigallocatechin-3-gallate (EGCG): specificity and interaction with membrane lipid rafts. J Physiol Pharmacol. 2008;59(Suppl 9):217–235. [PubMed] [Google Scholar]
- 43.Duhon D, Bigelow RL, Coleman DT, Steffan JJ, Yu C, Langston W, Kevil CG, Cardelli JA. The polyphenol epigallocatechin-3-gallate affects lipid rafts to block activation of the c-Met receptor in prostate cancer cells. Mol Carcinog. 2010;49:739–749. doi: 10.1002/mc.20649. [DOI] [PubMed] [Google Scholar]
- 44.Adachi S, Nagao T, Ingolfsson HI, Maxfield FR, Andersen OS, Kopelovich L, Weinstein IB. The inhibitory effect of (−)-epigallocatechin gallate on activation of the epidermal growth factor receptor is associated with altered lipid order in HT29 colon cancer cells. Cancer Res. 2007;67:6493–6501. doi: 10.1158/0008-5472.CAN-07-0411. [DOI] [PubMed] [Google Scholar]
- 45.Yang CS, Lambert JD, Sang S. Antioxidative and anti-carcinogenic activities of tea polyphenols. Arch Toxicol. 2009;83:11–21. doi: 10.1007/s00204-008-0372-0. [DOI] [PMC free article] [PubMed] [Google Scholar]
- 46.Ingolfsson HI, Koeppe RE, II, Andersen OS. Effects of green tea catechins on gramicidin channel function and inferred changes in bilayer properties. FEBS Lett. 2011;585:3101–3105. doi: 10.1016/j.febslet.2011.08.040. [DOI] [PMC free article] [PubMed] [Google Scholar]
Associated Data
This section collects any data citations, data availability statements, or supplementary materials included in this article.