

Graphical Abstract
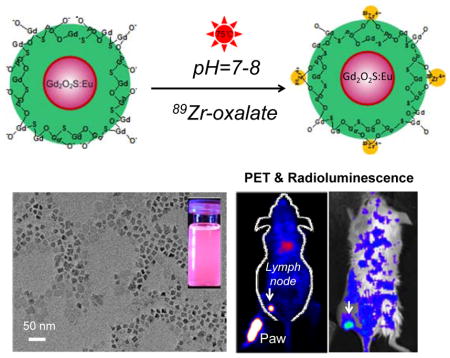
Here we report the engineering of a novel dual-modality imaging probe by intrinsically labeling zirconium-89 (89Zr, a positron emission radioisotope with a half-life of 78.4 h) to PEGylated Gd2O2S:Eu nanophorphors, forming [89Zr]Gd2O2S:Eu@PEG for in vivo PET/Radioluminescence lymph node mapping
Keywords: Radioluminescence Imaging, Intrinsic Radiolabeling, Gd2O2S:Eu Nanoparticles, Positron Emission Tomography
Radioluminescence imaging is an emerging innovative optical imaging modality that utilizes ionizing radiation of high energy rays (such as X-rays, gamma rays or beta particles) to excite nanophorphors to visualize biological features with an improved signal-to-noise ratio and a deeper tissue penetration depth (when compared with conventional optical imaging approaches).[1–6] Radioluminescence nanophosphors have recently shown great promise for biomedical imaging due to their unique optical properties, including exceptional photochemical stability, tunable emission spectrum with large Stokes shifts, negligible photobleaching, and bright radioluminescence.[4, 7–9] Positron Emission Tomography (PET) is an attractive quantitative imaging modality which possesses remarkable detection sensitivity but with a limited spatial resolution (~mm). Photoluminescence imaging is capable of providing the highest spatial resolution, however, lacks the capability to obtain anatomical and physiological detail in vivo owing to the limited penetration depth of light in tissues. The combination of these two imaging modalities into one nanosystem could potentially hold balance in sensitivity, resolution, and penetration depth, enabling excellent visualizing (cancer) cells from the cellular scale to whole-body non-invasive imaging. Here we reported the engineering of a novel dual-modality imaging probe by intrinsically labeling zirconium-89 (89Zr, a positron emission radioisotope with a half-life of 78.4 h) to PEGylated Gd2O2S:Eu nanophorphors, forming [89Zr]Gd2O2S:Eu@PEG for in vivo PET/Radioluminescence lymph node mapping (Figure 1a).
Figure 1. Synthesis and characterizations of [89Zr]Gd2O2S:Eu@PEG.

(a) A schematic illustration showing the chelator-free synthesis of [89Zr]Gd2O2S:Eu@PEG nanoparticles. TEM images of Gd2O2S:Eu before (b) and after PEGylation (c). Insets in (b) and (c) show the digital photos of Gd2O2S:Eu nanoparticles under the excitation of UV light.
A co-thermal decomposition of precursors method was used for the synthesis of Gd2O2S:Eu nanoparticles. Oleic acid (OA) and oleylamine (OL) were used as the combined surfactants for controlling the growth of nanoparticles. As shown in Figure 1b, cube-shaped Gd2O2S:Eu with an average size of 25 nm was obtained. The successful synthesis of Gd2O2S:Eu nanoparticles was confirmed by the X-ray diffraction (XRD) study (with the patterns match well with the standard Gd2O2S reflection, JCPDS No. 026-1422; Figure S1), and the strong red emission (from the doped Eu3+ ions) under UV light excitation (Figure 1b, inset). A well-established phospholipids surface modification strategy was introduced to transfer hydrophobic OA/OL-capped Gd2O2S:Eu nanoparticles from the organic solvent to the water phase.[10] Commercially available phospholipids (i.e. DSPE-PEG5k-Mal) with a molecular weight of 5 kDa were used. As-synthesized nanoparticles became water-dispersible via the hydrophobic van der Waals interactions between the hydrophobic tail of the phospholipids and the primary oleate ligands on the particles surface. Neither obvious morphology change nor severe particle aggregation was observed after the surface modification, as shown in Figure 1c and Figure S2. As expected, we saw a slight optical quenching effect and reduced fluorescent intensity in the water soluble Gd2O2S:Eu@PEG nanoparticles (Figure 1c, inset), possibly due to the optical quenching in aqueous solution. To characterize the optical properties of the Gd2O2S:Eu, excitation, and emission spectra were collected (Figure S3). The excitation spectrum is composed of an excitation bands ranging from 200 to 400 nm, which can be ascribed to the charge transfer band (CTB) between the anions and the Eu3+ ions.[11] The peak around 330 nm is attributed to the transition from the S2− to Eu3+.[12] Upon excitation at 330 nm, the significant emission peaks at 615 and 625 nm were observed due to the forced electric-dipole 5D0→7F2 transitions of the Eu3+ ions.[13] Emission at 703 nm (resulting from 5D0→7F4 transitions within the so-called “biological window”) was also observed.[14]
Zirconium-89 is an attractive radioisotope which decays by positron emission (23%) and electron capture (77%) to the stable isotope yttrium-89 (89Y). To demonstrate the existing of Gd2O2S:Eu radioluminescence by using the gamma energy derived from the 89Zr radioactive decay, a pilot study was first performed. Eppendorf tubes that contained free 89Zr (~40 μCi), Gd2O2S:Eu (1 mg/mL), Gd2O2S:Eu@PEG (1 mg/mL) and PBS control were placed close to each other, and imaged in IVIS Spectrum optical imaging system (with exitation filters all closed, and emission filter open at 620 nm). As shown in Figure 2a, both Gd2O2S:Eu (in cyclohexane) and Gd2O2S:Eu@PEG (in water) showed clear luminescence at around 620 nm (where free 89Zr only shows very low Cerenkov luminescence background). While no obvious luminescence can be detected from neither the free 89Zr nor the PBS control, clearly indicating the gamma energy-induced radioluminescence.
Figure 2. Intrinsic 89Zr labeling and ex vivo radioluminescence imaging.

(a) Radioluminescence imaging of Gd2O2S:Eu and Gd2O2S:Eu@PEG excited by gamma energy derived from the free 89Zr radioactive decay. A PBS control was also used. (b) Time-dependent 89Zr labeling yields of [89Zr]Gd2O2S:Eu@PEG with varied pH and temperature. (c) Radioluminescence imaging of [89Zr]Gd2O2S:Eu@PEG with the same Gd2O2S:Eu@PEG concentration (1 mg/mL) but varied radiation dose (ranging from 10 to 70 μCi) (Ex: Closed, Em: 620 nm). (d) Radioluminescence imaging of [89Zr]Gd2O2S:Eu@PEG with the same radiation dose (40 μCi) but varied Gd2O2S:Eu@PEG concentration (ranging from 0.25 to 1 mg/mL) (Ex: Closed, Em: 620 nm).
Inspired by our previous work on the intrinsic radiolabeling of 89Zr to mesoporous silica nanoparticles (with over 2 million -Si-O− groups in each particle),[15] we hypothesize that the presence of oxygen donors at the surface of water-soluble Gd2O2S:Eu@PEG can also be used for chelator-free radiolabeling of 89Zr. The labeling was performed by mixing 89Zr-oxalate with Gd2O2S:Eu@PEG in HEPES buffer (0.1 M, pH 7–8) and kept shaking at 75 °C. Radiolabeling yield of [89Zr]Gd2O2S:Eu@PEG was found to be over 75% within the first 30 min of incubation, and kept nearly consistent during the 180 min incubation time (Figure 2b, black line, Figure S4a). Successful 89Zr-labeling can also be achieved under lower labeling temperature with a lower labeling yield (~50%) after 3 h incubation (Figure 2b, red line, Figure S4b). A pH-dependent labeling yield was also observed with a significantly reduced labeling yield (<15% at 75 °C for 3 h) when labeling at pH 2–3, mostly likely due to the protonation of surface oxygen donors (Figure 2b, blue and green lines, Figure S4c,d).[15] Radioluminescence of [89Zr]Gd2O2S:Eu@PEG was found to be dependent on both the radioactivity of 89Zr in [89Zr]Gd2O2S:Eu@PEG and the concentration of Gd2O2S:Eu@PEG nanoparticles, as clearly shown in Figure 2c and 2d.
Before in vivo PET/Radioluminescence dual-modality imaging, the short-term biocompatibility of Gd2O2S:Eu@PEG was studied both in vitro and in vivo. No obvious cytotoxicity of Gd2O2S:Eu@PEG to normal cells (HEK-293) and tumor cells (HUN-7) was observed at a studied concentration (from 0.2 to 1 mg/mL) up to 24 h and 48 h (Figure S5). Serum biochemistry assays were then conducted to assess the potential toxicity after the injection of Gd2O2S:Eu@PEG (dose: 450 mg/kg). The primary liver function markers including aminotransferase (ALT), aspartate aminotransferase (AST), alkaline phosphatase (ALP), total bilirubin (TBIL) as well as kidney function markers including serum urea (UREA) and serum creatinine (CREA) were all measured. Mice injected with PBS were served as a control group (n=3). Our results show no obvious hepatic or kidney disorder of mice on both Day 7 and Day 14 post-injection. On Day 14, major organs (i.e. heart, liver, spleen, lungs, kidneys) were sliced and stained by H&E for histology analysis. The results in Figure 3b further revealed that there was no noticeable tissue damage in all major organs of mice. More systematic long-term in vivo toxicity study is needed to better understand the potential toxicity of Gd2O2S:Eu@PEG nanoparticles.
Figure 3. Biocompatibility study of Gd2O2S:Eu@PEG in healthy mice.

(a) Serum biochemistry of liver and kidney. Healthy BALB/c mice were intravenously injected with Gd2O2S:Eu@PEG (dose: 450 mg/kg), and sacrificed on Day 7 and Day 14 post-injection (n=3). (b) H&E study of major organs (including heart, liver, spleen, lung and kidney) from mice after injecting Gd2O2S:Eu@PEG (dose: 450 mg/kg) for 14 days. Healthy mice treated with PBS were used as the control.
We then study the radiostability and PET/Radioluminescence dual-modality imaging of [89Zr]Gd2O2S:Eu@PEG in vivo. As shown in Figure S6, over 98% of 89Zr remained intact in both cases after incubating at 37 °C for 48 h. As synthesized [89Zr]Gd2O2S:Eu@PEG was then intravenous (i.v.) injected in healthy BABL/C mice (n=3) and imaged using microPET. Due to the relatively large hydrodynamic size (>60 nm, Figure S2), dominant liver (35.3 ± 7.9 %ID/g) and spleen (39.3 ± 8.7 %ID/g) uptake of [89Zr]Gd2O2S:Eu@PEG was observed based on in vivo PET/Radioluminescence dual-modality imaging (Figure 4a,b), and confirmed in ex vivo quantitative biodistribution studies (Figure S7). Considering that detached free 89Zr is an osteophilic cation and will be accumulated in mouse bones quickly,[16] high bone uptake of 89Zr-labeled nanoparticles usually suggests their low radiostability in vivo. In our study, only less than 1%ID/g bone uptake of 89Zr was observed in bones (Figure 4a and Figure S7) at 48 h post-injection, clearly indicating a high radiostability of [89Zr]Gd2O2S:Eu@PEG in vivo.
Figure 4. In vivo PET/Radioluminescence imaging of [89Zr]Gd2O2S:Eu@PEG.

(a) Serial in vivo PET imaging of [89Zr]Gd2O2S:Eu@PEG in mice at different post-injection time points. (b) In vivo radioluminescence imaging of [89Zr]Gd2O2S:Eu@PEG in mice at different post-injection time points (Ex: Closed, Em: 620 nm). (c) Serial in vivo PET-based lymph node mapping of [89Zr]Gd2O2S:Eu@PEG in mice at different post-injection time points. (d) In vivo radioluminescence-based lymph node mapping of [89Zr]Gd2O2S:Eu@PEG in mice at different post-injection time points (Ex: Closed, Em: 620 nm). Lymph nodes were marked with white arrows.
Sentinel lymph nodes (SLNs) is a common route for tumor metastasis, and successful identification of SLNs has been considered as an important way for the prediction of cancer metastasis as well as assessing tumor prognosis in clinical treatment.[7] Upon subcutaneous injection of [89Zr]Gd2O2S:Eu@PEG nanoparticles (~50 μCi) into the left footpad of normal BALB/C mice, serial PET scans were performed. Accumulation of [89Zr]Gd2O2S:Eu@PEG in the popliteal lymph node could clearly be seen at 0.5, 2 and 6 h post-injection (Figure 4c), with the uptake estimated to be 8.6 ± 4.1, 13.4 ± 3.3 and 4.4 ± 1.7 %ID/g, respectively (n=3). Such accumulation could also be visualized by radioluminescence imaging (Figure 4d), and confirmed with ex vivo PET/Radioluminescence imaging (Figure S8) and histology studies (Figure S9). Ex vivo biodistribution of [89Zr]Gd2O2S:Eu@PEG was also investigated at 6 h post-injection where showed a dominant uptake of nanoparticles in the lymph node (Figure S10).
In conclusion, we have developed a facile synthesis and efficient chelator-free radiolabeling process to produce water-soluble [89Zr]Gd2O2S@PEG. To the best of our knowledge, this is the first example of the successful utilization of [89Zr]Gd2O2S@PEG for PET and gamma-ray-induced radioluminescence. This study might provide a new paradigm for combined PET/Radioluminescence imaging in preclinical and clinical applications.
Supplementary Material
Acknowledgments
This work is supported, in part, by the University of Wisconsin-Madison, the National Institutes of Health (NIBIB/NCI 1R01CA169365 and P30CA014520), and the American Cancer Society (125246-RSG-13-099-01-CCE). The National Basic Research and Development Program of China (973) under Grant No. 2011CB707702 and 2013CB733803 and the National Natural Science Foundation of China under Grant No. 81101100 and 81571725.
Contributor Information
Dr. Yonghua Zhan, Engineering Research Center of Molecular and Neuro Imaging of the Ministry of Education, School of Life Science and Technology, Xidian University, Xi’an, Shaanxi, China. Department of Radiology, University of Wisconsin–Madison, WI, USA
Dr. Fanrong Ai, School of Mechanical & Electrical Engineering, Nanchang University, Jiangxi, China. Department of Radiology, University of Wisconsin–Madison, WI, USA
Dr. Feng Chen, Department of Radiology, University of Wisconsin–Madison, WI, USA
Hector F. Valdovinos, Department of Medical Physics, University of Wisconsin-Madison, WI, USA
Dr. Hakan Orbay, Department of Surgery, University of California-Davis, Sacramento, CA 95817, USA
Dr. Haiyan Sui, Department of Radiology, University of Wisconsin–Madison, WI, USA
Dr. Jimin Liang, Engineering Research Center of Molecular and Neuro Imaging of the Ministry of Education, School of Life Science and Technology, Xidian University, Xi’an, Shaanxi, China
Dr. Todd E. Barnhart, Department of Medical Physics, University of Wisconsin-Madison, WI, USA
Prof Jie Tian, Email: tian@ieee.org, Institute of Automation, Chinese Academy of Sciences, Beijing, China, Engineering Research Center of Molecular and Neuro Imaging of the Ministry of Education, School of Life Science and Technology, Xidian University, Xi’an, Shaanxi, China.
Prof Weibo Cai, Email: wcai@uwhealth.org, Department of Radiology and Medical Physics, University of Wisconsin–Madison, WI, USA, University of Wisconsin-Madison Carbone Cancer Center, Madison, WI, USA.
References
- 1.Sun C, Pratx G, Carpenter CM, Liu H, Cheng Z, Gambhir SS, Xing L. Adv Mater. 2011;23:H195. doi: 10.1002/adma.201100919. [DOI] [PMC free article] [PubMed] [Google Scholar]
- 2.Sudheendra L, Das GK, Li C, Stark D, Cena J, Cherry S, Kennedy IM. Chem Mater. 2014;26:1881. doi: 10.1021/cm404044n. [DOI] [PMC free article] [PubMed] [Google Scholar]
- 3.Liu X, Liao Q, Wang H. IEEE Trans Biomed Eng. 2014;61:1621. doi: 10.1109/TBME.2013.2294633. [DOI] [PubMed] [Google Scholar]
- 4.Chen H, Longfield DE, Varahagiri VS, Nguyen KT, Patrick AL, Qian H, VanDerveer DG, Anker JN. Analyst. 2011;136:3438. doi: 10.1039/c0an00931h. [DOI] [PubMed] [Google Scholar]
- 5.Cao X, Chen X, Kang F, Zhan Y, Cao X, Wang J, Liang J, Tian J. ACS Appl Mater Interfaces. 2015;7:11775. doi: 10.1021/acsami.5b00432. [DOI] [PubMed] [Google Scholar]
- 6.Hu Z, Qu Y, Wang K, Zhang X, Zha J, Song T, Bao C, Liu H, Wang Z, Wang J, Liu Z, Liu H, Tian J. Nat Commun. 2015;6:7560. doi: 10.1038/ncomms8560. [DOI] [PMC free article] [PubMed] [Google Scholar]
- 7.Naczynski DJ, Sun C, Türkcan S, Jenkins C, Koh AL, Ikeda D, Pratx G, Xing L. Nano Lett. 2014;15:96. doi: 10.1021/nl504123r. [DOI] [PMC free article] [PubMed] [Google Scholar]
- 8.Chen H, Moore T, Qi B, Colvin DC, Jelen EK, Hitchcock DA, He J, Mefford OT, Gore JC, Alexis F, Anker JN. ACS Nano. 2013;7:1178. doi: 10.1021/nn304369m. [DOI] [PMC free article] [PubMed] [Google Scholar]
- 9.Chen H, He S. Mol Pharm. 2015;12:1885. doi: 10.1021/mp500512z. [DOI] [PubMed] [Google Scholar]
- 10.Li LL, Zhang R, Yin L, Zheng K, Qin W, Selvin PR, Lu Y. Angew Chem Int Ed Engl. 2012;51:6121. doi: 10.1002/anie.201109156. [DOI] [PMC free article] [PubMed] [Google Scholar]
- 11.Thirumalai J, Chandramohan R, Vijayan T. J Mater Sci Mater Electron. 2011;22:936. [Google Scholar]
- 12.Song Y, You H, Huang Y, Yang M, Zheng Y, Zhang L, Guo N. Inorg Chem. 2010;49:11499. doi: 10.1021/ic101608b. [DOI] [PubMed] [Google Scholar]
- 13.Osseni SA, Lechevallier S, Verelst M, Perriat P, Dexpert-Ghys J, Neumeyer D, Garcia R, Mayer F, Djanashvili K, Peters JA. Nanoscale. 2014;6:555. doi: 10.1039/c3nr03982j. [DOI] [PubMed] [Google Scholar]
- 14.Weissleder R. Nat Biotechnol. 2001;19:316. doi: 10.1038/86684. [DOI] [PubMed] [Google Scholar]
- 15.Chen F, Goel S, Valdovinos HF, Luo H, Hernandez R, Barnhart TE, Cai W. ACS Nano. 2015;9:7950. doi: 10.1021/acsnano.5b00526. [DOI] [PMC free article] [PubMed] [Google Scholar]
- 16.Abou DS, Ku T, Smith-Jones PM. Nucl Med Biol. 2011;38:675. doi: 10.1016/j.nucmedbio.2010.12.011. [DOI] [PMC free article] [PubMed] [Google Scholar]
Associated Data
This section collects any data citations, data availability statements, or supplementary materials included in this article.