Abstract
The cellular fate of nanoparticles in the liver is not fully understood. Because the effectiveness and safety of nanoparticles in liver therapy depends on targeting nanoparticles to the right cell populations, this study aimed to determine a relative distribution of PLGA-nanoparticles (sizes 271±1.4 nm) among liver cells in vivo. We found that Kupffer cells were the major cells that took up nanoparticles, followed by liver sinusoidal endothelial cells and hepatic stellate cells. Nanoparticles were found in only 7% of hepatocytes. Depletion of Kupffer cells by clodronate liposomes increased nanoparticle retention in liver sinusoidal endothelial cells and hepatic stellate cells, but not in hepatocytes. It is importantly suggested that studies of drug-loaded nanoparticle delivery to the liver have to demonstrate not only uptake of nanoparticles by the target cell type but also non-uptake by other cell types to assess their effect as well as ensure their safety.
Keywords: nanomedicine, Kupffer cells, liver sinusoidal endothelial cells, hepatic stellate cells, hepatocytes
Graphical abstract
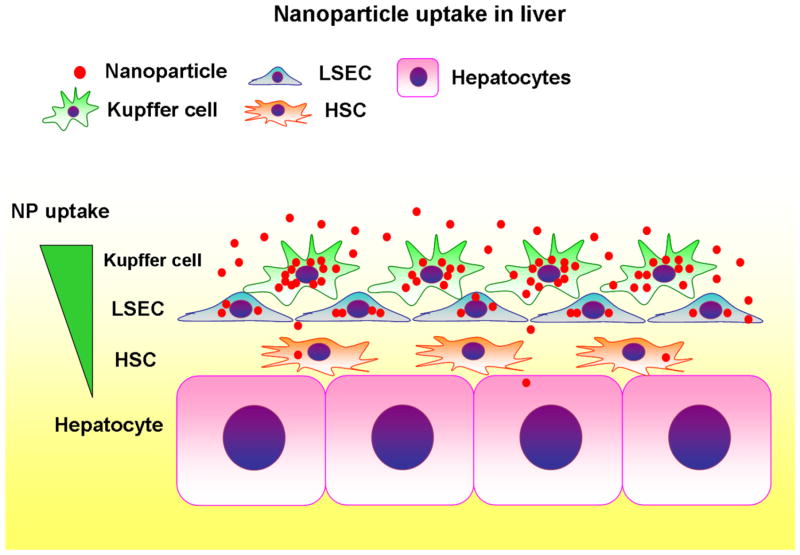
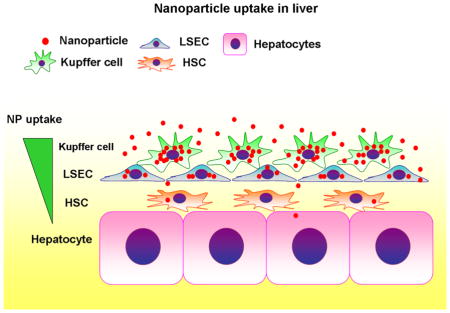
Summary of nanoparticle uptake in the liver. A hierarchy of nanoparticle (NP) uptake is seen among liver cells, which is characterized by dominance of Kupffer cells, followed by liver sinusoidal endothelial cells (LSECs), hepatic stellate cells (HSCs), and limited access to hepatocytes.
Introduction
Nanomedicine, the medical application of nanomaterials such as nanoparticles (NPs), is rapidly developing and being applied for the treatment of a wide range of diseases 1–3. NPs are small objects with their sizes of 1–500 nm, made of various materials, providing a wide range of potential applications for drug delivery, diagnostics and gene targeting 4. NP-based drug delivery has emerged as a new and alternative therapeutic strategy that is particularly suited for treatment of liver disease 5. To date, several clinical 6–8 as well as experimental studies have used NP delivery systems to treat liver fibrosis 9–15, hepatocellular carcinoma 5 and viral hepatitis 16. The high focus on treatment of liver disease is due primarily to the empirical finding that administered NPs accumulate at higher levels in the liver than other tissues. However, little is known about the cellular fate of NPs in the liver. Because the effectiveness and safety of NPs in liver therapy depends on targeting NPs to the right cell populations, information on the relative NP uptake by each liver cell type will be essential.
The liver consists of parenchymal cells (hepatocytes and cholangiocytes) and non-parenchymal cells that include Kupffer cells (liver resident macrophages), liver sinusoidal endothelial cells (LSECs) and hepatic stellate cells (HSCs) 17, 18. The sinusoids are lined by LSECs on which Kupffer cells spread, making Kupffer cells the first defense and LSECs the second defense against substances coming to the liver. Some studies report that Kupffer cells take up a substantial portion of NPs that arrive in the liver 19, 20, but the relative distribution of NPs in Kupffer cells versus other liver cells has never been determined. The phagocytic property of Kupffer cells may provide an attractive opportunity for efficient NP delivery to Kupffer cells 19–21, but may block NP delivery to other liver cells. Further, LSECs overlay the space of Disse, which is filled with extracellular matrix proteins and HSCs and under which hepatocytes reside. These multiple layers of liver cells may make cell-specific drug delivery challenging, particularly if hepatocytes are the target cells.
This study aimed to determine a relative distribution of NPs among liver cells in vivo. Since Kupffer cells were thought to retain a large portion of NPs, we also tested a hypothesis that removing Kupffer cells can change the relative accumulation of NPs in other liver cells. We generated fluorescently-labeled NPs by encapsulating DiD dye within polymer NPs, and injected these NPs into mice to allow tracking of NPs in each liver cell type.
Methods
Fabrication of nanoparticles
Poly (D,L-lactide-co-glycolide) with terminal ester groups (PLGA, 50:50 monomer ratio, 0.55–0.75 dL/g inherent viscosity) was purchased from Durect Corporation (Pelham, AL). 1,1′-Dioctadecyl-3,3,3′,3′-Tetramethylindodicarbocyanine,4 Chlorobenzenesulfonate Salt (DiD) dye was purchased from Invitrogen (Carlsbad, CA).
DiD-loaded PLGA nanoparticles were fabricated using a single emulsion solvent evaporation method. Briefly, 0.2mg DiD and 100mg PLGA were dissolved in 2mL dichloromethane (DCM). This polymer solution was added dropwise to 4mL of 5% polyvinyl alcohol (PVA) and sonicated to form the emulsion. This emulsion was poured into a beaker containing aqueous 0.3% PVA and stirred for 3 hours to allow the DCM to evaporate and the particles to harden. After their formation in 5% PVA, the NPs still contain small amounts of solvent (DCM), which are “soft” and easy to aggregate. When the newly formed NPs in 5% PVA are added into a large quantity of water, the 5% PVA will be diluted to very low concentration at the beginning, which is not high enough to stabilize the emulsion of “soft” NPs. The additional 0.3% PVA stabilizes the NPs during the hardening process. NPs were collected by centrifugation, washed, frozen and lyophilized for 3 days.
Animals
Male C57BL/6 mice about 2 months of age and 25g of weight were used. All animal experiments were performed in accordance with the National Institutes of Health Guide for the Care and Use of Laboratory Animals, and approved by the Institutional Animal Care and Use Committees of Yale University and the Veterans Affairs Connecticut Healthcare System.
Nanoparticle administration and Kupffer cell depletion
Mice were anesthetized with ketamine (100mg/kg) and xylazine (10mg/kg), followed by abdominal incision. To assure the comparable amount of NPs to be delivered to the liver, NPs were gently injected into the spleen at a dose of 3mg/20g body weight in 0.2ml saline. Given its vicinity to the liver, injection into the spleen was thought to minimize the differences in the amount of NPs to be delivered to the liver. Mice were sacrificed for collection of liver tissues at indicated time points (40 minutes, 1 day, 1 and 2 weeks). To determine if the pattern of NP distribution differs, depending on the routes of their administration, tail vein injection of NPs were also performed at a dose of 1mg/20g body weight in 0.15ml saline. To determine if depletion of Kupffer cells influences NP distribution in the liver, clodronate liposomes (ClodronateLiposomes.org, Netherlands) were injected intraperitoneally at a dose of 0.1ml/10g body weight 2 days before NP injection.
Immunofluorescence observation of NP distribution in liver tissues
Liver tissues were isolated from mice at different time points after NP injection. Isolated liver tissues were fixed in 4% paraformaldehyde at 4°C for 2 days and then incubated in 30% sucrose overnight. Finally, tissues were embedded in OCT compound (Sakura FineTek, Torrance, CA), frozen on dry ice and sectioned with 5μm of thickness. Sections were immunostained with primary antibodies of rat anti-CD68 (Serotec, Kidlington, UK), mouse anti-Ve-cadherin (Santa Cruz Biotechnology, Santa Cruz, CA) and rabbit anti-desmin (Cell Signaling Technology, Danvers, MA) at 4°C for overnight. Sections were then incubated with the following secondary antibodies: Alexa Fluor® 488 goat anti-rat IgG, Alexa Fluor® 488 goat anti-rabbit IgG, and Alexa Fluor® 488 goat anti-mouse IgG (Life Technologies, Grand Island, NY) for 1 hour at room temperature. For nuclear staining, DAPI (4′,6-diamidino-2-phenylindole) was used. Representative photomicrographs were taken by Zeiss Axiovert 200 fluorescence microscope (Carl Zeiss MicroImaging, Thornwood, NY) and confocal microscope (Carl Zeiss). The number of NP positive cells was counted at 200× magnification. For assessment of a cellular distribution of NPs, the number of specific cell types co-localized with NPs was divided by the total number of NP positive cells per field. For example, Kupffer cells positive with NPs (CD68+ NP+ cells) were divided by a total number of NP+ cells per field.
Liver perfusion and isolation of nonparenchymal cells (NPCs) and hepatocytes
The liver was perfused and digested by the collagenase perfusion method described previously 22. Briefly, after liver digestion, hepatoctyes and NPC fractions were separated by centrifugation. Then, hepatocytes or NPCs were plated on collagen coated plates or cover slips with hepatocyte adherence media or RPMI media containing 10% FBS for 20 hours. The plated cells were used for immunofluorescence analysis.
Immunofluorescence analysis of NP uptake in isolated NPCs and hepatocytes
Plated cells were incubated with 4% paraformaldehyde for 10 minutes. After blocked with 5% donkey serum, fixed cells were incubated with the following antibodies for 2 hours at room temperature: rat anti-CD68 (Serotec, Kidlington, UK), rabbit anti-eNOS (Novus Biologicals, Littleton, CO) and rabbit anti-desmin (Cell Signaling Technology, Danvers, MA). Then, NPCs were incubated with the following secondary antibodies: Alexa Fluor® 488 goat anti-rat IgG and Alexa Fluor® 488 goat anti-rabbit IgG (Life Technologies, Grand Island, NY) for 1 hour at room temperature and stained with DAPI for visualization of nuclei. Hepatocytes were detected using their autofluorescence at 488 filter. Representative photomicrographs were taken by Zeiss Axiovert 200 fluorescence microscope (Carl Zeiss MicroImaging, Thornwood, NY) and STED super-resolution Leica microsystem (Leica, TCS SP8 3XSTED).
Flow cytometry of isolated NPCs and hepatocytes
NPCs isolated after liver perfusion were stained with rat anti-CD68, rat anti-CD31, rabbit anti-eNOS and rabbit anti-desmin. For intracellular staining, isolated NPCs were fixed in 4% paraformaldehyde for 20 minutes and permeabilized in 0.1% Triton X-100 solution for 15 minutes at room temperature. For blocking, NPCs were incubated with anti-CD16/32 Fc blocker (BD Biosciences, San Jose, CA) for 30 minutes and incubated with primary antibodies for 30 minutes at room temperature. After brief washing with 2% FBS, cells were incubated in secondary antibodies including Alexa Fluor® 488 goat anti-rat IgG and Alexa Fluor® 488 goat anti-rabbit IgG (Life Technologies, Grand Island, NY) for 30 minutes at room temperature. To exclude apoptotic cells, cells were incubated with diluted (1:2000) propidium iodide for 10 minutes. Hepatocytes were detected using their autofluorescence at 488 filter. Flow cytometry was performed using BD™ LSR II Green Flow Cytometer (BD Biosciences, San Jose, CA) and BD FACSDiva software (BD Biosciences, San Jose, CA).
Statistical analysis
Data were reported as mean ± standard error of mean (SEM). One-way analysis of variance (ANOVA) or Student’s t-test was performed to determine statistical significance among multiple groups. P values < 0.05 were considered statistically significant.
Results
Nanoparticles (NPs) were largely retained in CD68-positive Kupffer cells in the normal liver
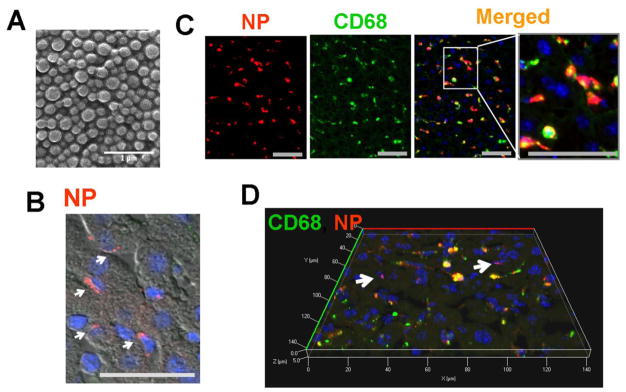
We used DiD-loaded NPs to visualize their distribution. DiD is a fluorescent dye with an excitation/emission range = 644/665, which avoids overlap with endogenous tissue autofluorescence. Nanoparticle size was determined by dynamic light scattering (DLS) using a ZetaPals ζ–potential and particle size analyzer (Brookhaven Instruments, Holtsville, NY). The average hydrodynamic diameter (Z-Ave) of DiD-loaded nanoparticles was 271±1.4 nm, with a polydispersity index (PDI) of 0.126. The zeta potential was −28.3±4.66 mV. Nanoparticle morphology was visualized using a XL-30 ESEM-FEG scanning electron microscope (Figure 1A): average particle size by electron microscopy was 150–200 nm.
Figure 1. Nanoparticles (NPs) are largely retained in CD68+ Kupffer cells in the liver.
(A) Scanning electron micrograph of DiD-loaded nanoparticles. Scale bar; 1μm. The liver was isolated 40 minutes after NP injection through the spleen and analyzed using fluorescence microscope. Red; NP, Green; CD68, Scale bar; 50μm. (B) NPs (red) were clustered in non-parenchymal cells according to liver structure. (C) Immunofluorescent images of NPs (red) and CD68+ Kupffer cells (green). Kupffer cells retaining NPs are shown in yellow in the merged images. (D) Confocal 3D image of NP-treated liver tissue clearly shows that NPs (red) highly co-localize with CD68+ Kupffer cells (green). The arrows point to a few NP-positive, but CD68-negative cells.
Forty minutes after NP injection to mice, livers were harvested and hepatic NP distribution was examined. NPs were localized in the sinusoidal area, rather than in hepatocytes (Figure 1B). Immunofluorescent analysis with a macrophage marker CD68 revealed that NPs were largely retained in CD68+ Kupffer cells (Figures. 1C & D) and some in other liver cells (white arrows in Figure 1D).
The pattern of NP distribution was similar between splenic injection and tail vein injection, both showing a strong co-localization of NPs with CD68+ Kupffer cells (Supplemental Figure 1). The results presented here came from splenic injection to minimize the differences in the amount of NPs to be delivered to the liver.
NPs were taken up primarily by Kupffer cells, followed by LSECs and HSCs
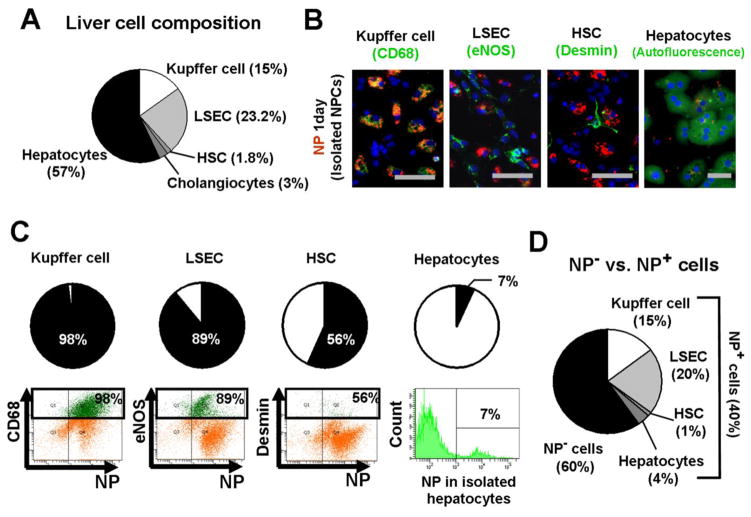
To determine relative NP uptake by major liver cells, such as hepatocytes, HSCs, LSECs, and Kupffer cells, we first determined the portion of each cell among the entire liver cell population (Figure 2A). Parenchymal cells were reported to account for approximately 60% of the total liver cells with 57% being hepatocytes and 3% being cholangiocytes 23, 24. Therefore, the remaining 40% are non-parenchymal cells. We performed flow cytometry analysis of non-parenchymal cells isolated from mice and found the ratios of Kupffer cells, LSECs and HSCs to the total non-parenchymal cells (Supplemental Figure 2, 37.2%, 58.1% and 4.5%, respectively). Based on these results, we determined a composition of liver cells, which includes 57% of hepatocytes, 3% of cholangiocytes, 15% of Kupffer cells, 23.2% of LSECs and 1.8% of HSCs (Figure 2A).
Figure 2. Nanoparticles (NPs) are retained in non-parenchymal cells rather than hepatocytes.
One day after NP injection to mice, liver cells were isolated and evaluated for NP uptake. (A) A composition of liver cells. Flow cytometry analysis was performed to determine the ratios of non-parenchymal cells using specific markers: CD68 for Kupffer cells, eNOS for LSECs and desmin for HSCs. (B) Immunofluorescent images of NPs with isolated Kupffer cells (CD68+), LSECs (eNOS), HSCs (desmin) and hepatocytes (autofluorescence). Red; NP, Green; cell markers. (C) Ratios of NP-positive cells in each cell type. Flow cytometry analysis was performed in non-parenchymal cell fractions to determine the percentages of NP-positive cells in each cell type, using CD68 for Kupffer cells, eNOS for LSECs and desmin for HSCs. Hepatocytes were isolated separately. Each cell type is indicated in green. (D) Ratios of NP-positive cells in the entire liver cells.
We examined NP uptake by non-parenchymal cells and hepatocytes with immunofluorescence, isolating cells from mice injected with NPs (Figure 2B). NPs were co-localized with all cell types examined, but to varying degrees. The highest concentration was observed in Kupffer cells, followed by LSECs and HSCs, as indicated by intensity of co-localization of NPs with their respective cell markers. NP-positive hepatocytes were rare. Flow cytometry showed that 98% of Kupffer cells, 89% of LSECs, 56% of HSCs, and only 7% of hepatocytes were NP-positive (cholangiocytes were not examined) (Figure 2C). With these numbers and the composition of liver cells determined in Figure 2A, the ratios of NP-positive Kupffer cells (15%), LSECs (20%), HSCs (1%) and hepatocytes (4%) among the entire population of liver cells were calculated (Figure 2D). For example, since Kupffer cells account for 15% of the entire liver cell population, 98% of NP-positive Kupffer cells correspond to 15% (15% × 0.98 = 15%) of the entire liver population. Approximately 40% of liver cells were NP-positive while 60% did not retain NPs.
Flow cytometry detects NP-positive cells regardless of the concentration of NPs in cells, which gave LSECs the highest number of NP-positive cells. However, NPs were most concentrated in Kupffer cells as shown in Figures. 1 and 2B, indicating that NPs are largely in Kupffer cells in vivo.
NPs were retained in CD68-negative cells after the depletion of Kupffer cells by clodronate liposomes
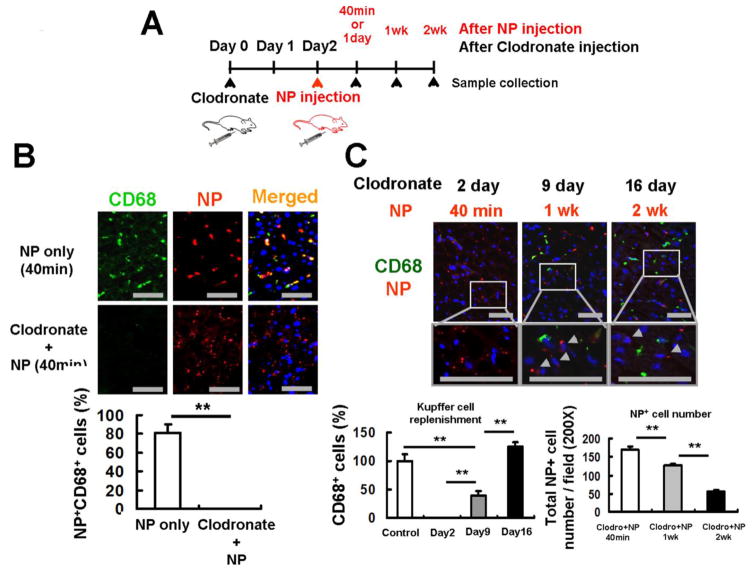
NP delivery was examined after the depletion of Kupffer cells by clodronate liposomes (Figure 3). Two days after injection of clodronate liposomes, we injected NPs to mice and monitored NP distribution and Kupffer cell replenishment at indicated time points (Figure 3A). Clodronate liposomes depleted Kupffer cells within 2 days. In animals depleted of Kupffer cells, NPs were retained in CD68-negative cells as early as 40 minutes after NP injection (Figures. 3B & C). NPs stayed in CD68-negative cells for over 2 weeks after NP administration, while Kupffer cells were completely restored to the basal level in 2 weeks (Figure 3C). These observations suggest that manipulation (e.g., depletion) of Kupffer cells could be a strategy to deliver NPs to non-Kupffer cells.
Figure 3. NPs are retained in CD68-negative cells in the absence of Kupffer cells.
(A) Experimental design for Kupffer cell depletion by clodronate liposomes and NP injection. Clodronate liposomes were injected intraperitoneally to mice 2 days before NP injection. Mice were sacrificed at 40 minutes, 1, and 2 weeks after NP injection for collection of liver tissues. (B) CD68-positive Kupffer cells (green) were completely depleted 2 days after clodronate liposome treatment. NPs (red) were retained in the liver even in the absence of Kupffer cells. Scale bar; 50μm. The percentages of NP-positive/CD68-positive cells in the total NP-positive cells were determined 40 minutes after NP injection. (C) Kupffer cells returned to the basal levels by 16 days after clodronate liposome treatment. Newly recruited CD68-positive Kupffer cells (green) were negative to NPs (red), but NPs still remained in CD68-negative cells even 2 weeks after their injection (arrow heads). Scale bar; 50μm. The ratios of CD68-positive Kupffer cells to those of the basal levels were determined 2, 9 and 16 days after clodronate liposome treatment. The number of NP-positive cells was counted at 200× magnification 40 minutes, 1 week and 2 weeks after NP injection. Data are shown as mean ± SEM. **p<0.01.
Kupffer cell depletion resulted in increased NP retention in LSECs
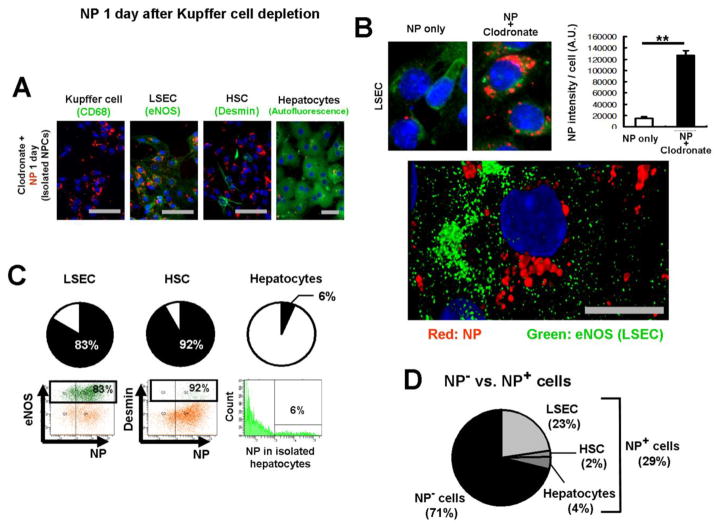
We then determined which liver cells took up NPs in the absence of Kupffer cells. Two days after injection of clodronate liposomes, NPs were injected, followed by isolation of liver cells on the next day. Immunofluorescent analysis confirmed that there were no NP-positive Kupffer cells (Figure 4A, leftmost image) and showed that Kupffer cell depletion resulted in increased retention of NPs in LSECs and HSCs, but no notable increases in hepatocytes, compared to their respective counterparts in the presence of Kupffer cells (Figures. 4A & B). Further, cellular location of NPs was determined in LSECs using Leica TCS SP8 STED 3X super-resolution microscope, which demonstrated the localization of NPs to the cytoplasm and around the nucleus (Figure 4B).
Figure 4. Kupffer cell depletion results in increased NP retention in LSECs.
NP uptake was determined 1 day after NP injection, following clodronate liposome treatment. Scale bar; 50μm. (A) Immunofluorescence of isolated Kupffer cells (CD68+), LSECs (eNOS), HSCs (desmin) and hepatocytes (autofluorescence), one day after NP injection. NPs (red) and cell markers (green). (B) Kupffer cell depletion significantly increased NP retention in LSECs (upper panel). The bar chart represents NP intensity per LSEC. Data are shown as mean ± SEM. Quantification of 52 fields. **p<0.01. A cellular distribution of NPs in LSECs was determined by isolating LSECs one day after NP injection (lower panel). NPs were localized to the nucleus. NP (red), eNOS (green) and nucleus (blue, DAPI). An image was taken by Leica TCS SP8 STED 3X super-resolution microscope. Scale bar; 10μm. (C) NP-positive cells in each cell type after Kupffer cell depletion. Flow cytometry analysis was performed in non-parenchymal cell fractions using CD68 for Kupffer cells, eNOS for LSECs and desmin for HSCs, as well as in hepatocyte fractions. Hepatocytes were isolated separately. Each cell type is indicated in green. (D) Ratios of NP-positive cells in the entire liver cells after Kupffer cell depletion.
NP-positive cells were quantified in the absence of Kupffer cells using flow cytometry (Figure 4C), using methods similar to those used earlier (Figure 2C). Although NPs were mostly retained in LSECs as indicated by fluorescent intensity in LSECs (Figure 4B), the ratio of NP-positive LSECs (83%) was similar to that observed in the presence of Kupffer cells (Figure 4C, left panel). NP-positive HSCs increased to 92%, but the degree of retention evaluated by immunofluorescence was similar to that observed in the presence of Kupffer cells (Figure 4C, middle panel). Kupffer cell depletion did not change NP-positive hepatocyte counts (Figure 4C, right panel).
The ratios of NP-positive cells to the entire liver cell population were estimated, as before (Figure 4D). While 40% of the entire liver cell population was NP-positive in the presence of Kupffer cells (Figure 2D), Kupffer cell depletion decreased NP-positive cells to 29% (Figure 4D). The percentages of NP-positive LSECs, HSCs and hepatocytes in the entire liver population were pretty similar to those in the presence of Kupffer cells. However, it is significant that the retention of NPs in LSECs increased by more than 8 times (Figure 4B).
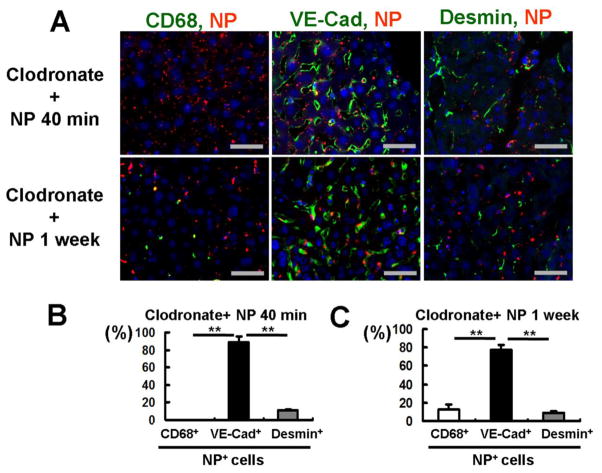
Immunofluorescent analysis of liver sections also confirmed the dominance of LSECs in NP retention in the absence of Kupffer cells (Figure 5). Although flow cytometry found that 4% of NP-positive cells were hepatocytes (Figure 4D), immunofluorescent analysis of liver sections did not detect NPs in hepatocytes (Figures 1A & 5) as evaluated by the liver structure using phase contrast microscopy (Figure 1A). This may be attributable to higher sensitivity of flow cytometry than immunofluorescence analysis. Depletion of Kupffer cells resulted in NP retention in LSECs by 89% and 78% of the total NP-positive cells 40 minutes and 1 week after NP injection, respectively; of the cells that have NPs, 10 or 9% of them are HSCs (Figures 5B & C). All these observations indicate that LSECs become the major NP-engulfing cells when Kupffer cells are absent.
Figure 5. NP-positive liver cells after Kupffer cell depletion.
Livers were isolated 40 minutes and 1 week after NP injection. (A) Representative fluorescent images of liver sections. Cell markers include CD68 (green) for Kupffer cell, VE-Cad (green) for LSECs and desmin (green) for HSCs. Scale bar; 50μm. (B & C) Quantification of NP-positive cells in livers 40 minutes (B) or 1 week (C) after NP injection. Among NP-positive cells, 89% were LSECs and 10% were HSCs at 40 minutes, while LSECs and HSCs were 79% and 9% 1 week after NP injection, respectively. Data are shown as mean ± SEM. Quantification of 7 fields per tissue. **p<0.01.
Discussion
Nanoparticles are a promising tool for drug delivery because of their potential to deliver drugs to specific cell populations 1, 25. NPs may also be useful experimentally with siRNA or CRISPR/Cas-9 system to suppress or delete target genes in a cell-specific manner 26. This study has determined a cellular distribution of PLGA-NPs (sizes 271±1.4 nm) in mouse liver when they were administered in vivo for the first time. Kupffer cells were found to be the primary cells that took up NPs, followed by LSECs and HSCs (Figure 6). NPs were found in only 7% of hepatocytes. Depletion of Kupffer cells by clodronate liposomes increased NP retention in LSECs and HSCs. Interestingly, with Kupffer cell depletion, 6% of hepatocytes were associated with NPs, similar to the fraction associated in the presence of Kupffer cells. These findings suggest a hierarchy of NP uptake among liver cells, which is characterized by dominance of Kupffer cells, likely due to their prominent phagocytic nature and cellular location, and limited access to hepatocytes (Figure 6). In the absence of Kupffer cells, this hierarchy makes LSECs the primary intaker of NPs, followed by HSCs. In fact, without Kupffer cells, the percentage of HSCs containing NPs increased from 56% to 92%, which would explain no changes in the percentage of hepatocytes containing NPs. In terms of liver physiology, this finding may reflect the multi-cellular barrier presented by non-parenchymal cells for protection of hepatocytes.
Figure 6. Summary of nanoparticle uptake in the liver.
A hierarchy of NP uptake is seen among liver cells, which is characterized by dominance of Kupffer cells, followed by liver sinusoidal endothelial cells (LSECs), hepatic stellate cells (HSCs), and limited access to hepatocytes.
It has been thought that Kupffer cells take up NPs delivered to the liver. However, the relative ratio of NPs that accumulate in Kupffer cells compared to other liver cells has not been documented before. Recently, liposome-NPs encapsulated with procollagen a1 siRNA were shown to resolve liver fibrosis 27. That study also reported a higher uptake of liposome-NPs by Kupffer cells than by the HSCs that were the desired target. Interestingly, LSEC uptake of liposome-NPs was not reported, which may be due to limitations in their detection method using histological analyses with immuno-labeling of cell markers. Because LSECs are located in a very close vicinity to HSCs, it is not easy to distinguish them histologically. Also, a marker for LSECs is often difficult to choose. Nonetheless, this previous study agrees with our results, in showing that the primary cellular destination of NPs is Kupffer cells, although other liver cells can also take up NPs. The current study thus suggests that an important consideration in NP delivery to the liver is examination of drug-loaded NPs to a particular liver cell type and that studies have to demonstrate not only uptake of NPs by the target cell type but also non-uptake by other cell types and prove that an anticipated effect is due to their specific delivery to the target cell type. Otherwise, the anticipated effect could be attained by NPs that may be delivered to other cell types. This is particularly important from a therapeutic point of view since off-target delivery of drugs could cause unknown effects. Therefore, NP delivery has to enhance its specificity.
Although drugs may diffuse out of NPs and cells and into the whole liver, the cellular fate of NPs is obviously still important, as the duration of action, effectiveness, and side-effects of NP-based delivery all potentially depend on the cellular localization of NPs. For example, if drug-loaded NPs are sequestered predominantly in Kupffer cells, these cells will be exposed to much higher levels of drugs and are therefore more affected by them than other cells in the liver that will experience lower levels of drugs, which can affect drug action. Given the same requirement of cell-specificity, we also believe that our results are relevant to other modes of NP application such as gene delivery and diagnostics.
The primary uptake of NPs by Kupffer cells may make Kupffer cells themselves the most convenient target for NP delivery in the liver. Kupffer cells are involved in the inflammatory process and could be an effective therapeutic target for liver disease. Further, increased retention of NPs in LSECs and HSCs secondary to depletion of Kupffer cells by clodronate liposomes may suggest a possibility of selective delivery of NPs to these cell types experimentally, although further enhancement in specificity to either cell type is needed. For therapeutic purposes, however, it seems essential to develop a strategy that allows NPs to escape from Kupffer cells since depletion of Kupffer cells is not possible in clinical settings. Our results suggest that specific delivery to hepatocytes will be even more difficult than LSEC or HSC specific delivery. For example, we found no changes in the number of hepatocytes that took up NPs with the depletion of Kupffer cells. Given that hepatocytes are the primary liver cells and involved in many liver diseases including metabolic disorders and hepatocellular carcinoma, it is very important to develop a strategy to deliver NPs specifically to hepatocytes.
Modification of NP surface with high affinity ligands that bind to cell-specific receptors is the most often used strategy to enhance targeting of NPs to specific cell types 5. For example, vitamin A coating of liposomes or NPs has been used for specific delivery to HSCs 28, 29. However, since these studies did not show distributions of these carriers in other liver cells in vivo, the effectiveness of vitamin A coating to target HSCs is still uncertain. It is also reported that hepatocytes take up vitamin A 30.
The size of NPs may also help to enhance their specific delivery. Our NPs are similar in size to most current preparations, with the average diameter of 271±1.4 nm in water (150–200 nm by electron microscopy). A protein corona may form on these NPs. However, we believe that its formation would not add substantially to the overall particle diameter since it would predominantly be a monolayer of protein attached to the outer surface of the NP and the typical dimension of a protein such as albumin or gamma-globulin is less than 10 nm. In mice, the size of fenestrae in LSECs is estimated to be 280 nm 31. Therefore, our NPs have passed through fenestrae. Thus, larger NPs (more than 280 nm in diameter) might achieve more specific delivery to LSECs with help of Kupffer cell depletion by clodronate liposomes. It was reported that a small diameter helped NPs to escape from Kupffer cells and LSECs 32. However, it is not clear how this escape occurs against strong phagocytic activity of Kupffer cells or LSECs that was demonstrated in the current study.
Disease conditions may also affect a cellular distribution of NPs in the liver. Morphological and/or functional changes in liver cells as well as hepatic microcirculatory disorders occur in pathological conditions. For example, portal hypertension causes the development of collateral vessels and hemodynamic changes. These changes may influence the cellular distribution of NPs in the liver. In fact, one study showed that liver fibrosis increased liposome NP accumulation in HSCs by approximately 3.5-fold 27. The mechanism of this increased uptake by HSCs, particularly activated HSCs (i.e., myofibroblasts), was not specified. Therefore, effective cell-specific NP delivery for therapeutic purposes, particularly in the setting of pathological changes in the liver, requires a better understanding of NP fate in different liver diseases.
For treatment of liver disease, NPs in the form of liposomes and micelles 33 have been used most frequently. Liposome-based NPs are evolving into more advanced forms such as nano-structured lipid or solid lipid NPs 33. However, some cationic lipids are also known to be cytotoxic, unstable at high ionic conditions 34, 35, and cause dose-dependent toxicity that elicits immune activation 36, 37. We used NPs made of poly lactic-co-glycolic acid (PLGA), one of the most promising polymers for drug delivery due to its lack of toxicity, biodegradability 38, and potential for sustained release 1. PLGA NPs naturally undergo hydrolysis in the body, resulting in biodegradable metabolite monomers such as lactic acid and glycolic acid 39. They are not immunogenic or proinflammatory, as they neither activate neutrophils nor affect macrophage systems 25, which was demonstrated in this study as well (Supplemental Figure 3). Importantly, the United States Food and Drug Administration and the European Medicines Agency have approved use of PLGA NPs as a carrier for delivery of various drugs in humans 40. Given these advantages, PLGA NPs have been increasingly popular for various purposes in medical settings including drug delivery, diagnosis and imaging 39.
In conclusion, this is the first study, which focused on PLGA-NPs with the average size of 271+/-1.4 nm. The point of this study is to illustrate the complexity of NP distribution in liver tissue, to develop methods for measuring the distribution of NPs throughout the complex cellular architecture of the liver, and to define the cellular distribution of one representative NP formulation. Use of NPs with different sizes and different formulations could potentially result in different hepatic cellular distributions. Thus, we hope that this study will provide a standard measure that others can use to determine the effect of size and surface chemistry of NPs on their hepatic cellular distribution and to look more closely at the cellular distribution of their NPs with the liver, as a means to identify the effectiveness and potential toxicity of their approach.
Supplementary Material
Acknowledgments
Financial support: This work was supported by NIH grants R01 DK082600, P30 DK045735, R21 AA023599 and CT DPH 2015-0901 (YI), NIH AI112443 (WMS), and JSPS KAKENHI 26440055 of Ministry of Education, Sport, Culture, Science and Technology in Japan (AS).
List of abbreviations
- PLGA
Poly (D,L-lactide-co-glycolide)
- NPs
nanoparticles
- LSECs
liver sinusoidal endothelial cells
- HSCs
hepatic stellate cells
- DiD
1,1′-Dioctadecyl-3,3,3′,3′-Tetramethylindodicarbocyanine,4 Chlorobenzenesulfonate Salt
- DCM
dichloromethane
- PVA
polyvinyl alcohol
- NPCs
nonparenchymal cells
- SEM
standard error of mean
- DLS
dynamic light scattering
- Z-Ave
average hydrodynamic diameter
- PDI
polydispersity index
Footnotes
All authors have no conflict of interest.
Author’s contributions: J.P., T.U. and Y.S. performed research, T.U., Y.D., A.S., W.M.S. and Y.I. designed research, J.P., T.U., Y.S., W.M.S. and Y.I. wrote manuscript.
Publisher's Disclaimer: This is a PDF file of an unedited manuscript that has been accepted for publication. As a service to our customers we are providing this early version of the manuscript. The manuscript will undergo copyediting, typesetting, and review of the resulting proof before it is published in its final citable form. Please note that during the production process errors may be discovered which could affect the content, and all legal disclaimers that apply to the journal pertain.
Contributor Information
Jin-Kyu Park, Email: jinkyu820@knu.ac.kr, Section of Digestive Diseases, Department of Internal Medicine, Yale University School of Medicine, 333 Cedar Street, New Haven, Connecticut 06520, USA. Department of Veterinary Pathology, College of Veterinary Medicine, Kyungpook National University, Daegu 41566, Republic of Korea.
Teruo Utsumi, Email: teruo_utsumi@yahoo.com, Section of Digestive Diseases, Department of Internal Medicine, Yale University School of Medicine, 333 Cedar Street, New Haven, Connecticut 06520, USA.
Young-Eun Seo, Email: young-eun.seo@yale.edu, Department of Biomedical Engineering, Yale University, 55 Prospect Street, New Haven, Connecticut 06511, USA.
Yang Deng, Email: yang.deng.yd@gmail.com, Department of Biomedical Engineering, Yale University, 55 Prospect Street, New Haven, Connecticut 06511, USA.
Ayano Satoh, Email: ayano113@cc.okayama-u.ac.jp, The Graduate School of Natural Science and Technology, Okayama University, Okayama, Japan.
W. Mark Saltzman, Email: mark.saltzman@yale.edu, Department of Biomedical Engineering, Yale University, 55 Prospect Street, New Haven, Connecticut 06511, USA.
Yasuko Iwakiri, Email: yasuko.iwakiri@yale.edu, Section of Digestive Diseases, Department of Internal Medicine, Yale University School of Medicine, 333 Cedar Street, New Haven, Connecticut 06520, USA.
References
- 1.Cheng CJ, Tietjen GT, Saucier-Sawyer JK, Saltzman WM. A holistic approach to targeting disease with polymeric nanoparticles. Nat Rev Drug Discov. 2015;14:239–47. doi: 10.1038/nrd4503. [DOI] [PMC free article] [PubMed] [Google Scholar]
- 2.Chen Y, Mohanraj VJ, Wang F, Benson HA. Designing chitosan-dextran sulfate nanoparticles using charge ratios. AAPS Pharm Sci Tech. 2007;8:E98. doi: 10.1208/pt0804098. [DOI] [PMC free article] [PubMed] [Google Scholar]
- 3.Bergen JM, von Recum HA, Goodman TT, Massey AP, Pun SH. Gold nanoparticles as a versatile platform for optimizing physicochemical parameters for targeted drug delivery. Macromol Biosci. 2006;6:506–16. doi: 10.1002/mabi.200600075. [DOI] [PubMed] [Google Scholar]
- 4.Caruthers SD, Wickline SA, Lanza GM. Nanotechnological applications in medicine. Curr Opin Biotechnol. 2007;18:26–30. doi: 10.1016/j.copbio.2007.01.006. [DOI] [PubMed] [Google Scholar]
- 5.Kang JH, Toita R, Murata M. Liver cell-targeted delivery of therapeutic molecules. Crit Rev Biotechnol. 2014:1–12. doi: 10.3109/07388551.2014.930017. [DOI] [PubMed] [Google Scholar]
- 6.Seymour LW, Ferry DR, Anderson D, Hesslewood S, Julyan PJ, Poyner R, et al. Hepatic drug targeting: phase I evaluation of polymer-bound doxorubicin. J Clin Oncol. 2002;20:1668–76. doi: 10.1200/JCO.2002.20.6.1668. [DOI] [PubMed] [Google Scholar]
- 7.Reddy LH, Couvreur P. Nanotechnology for therapy and imaging of liver diseases. J Hepatol. 2011;55:1461–6. doi: 10.1016/j.jhep.2011.05.039. [DOI] [PubMed] [Google Scholar]
- 8.Fu S, Naing A, Moulder SL, Culotta KS, Madoff DC, Ng CS, et al. Phase I trial of hepatic arterial infusion of nanoparticle albumin-bound paclitaxel: toxicity, pharmacokinetics, and activity. Mol Cancer Ther. 2011;10:1300–7. doi: 10.1158/1535-7163.MCT-11-0259. [DOI] [PubMed] [Google Scholar]
- 9.Li FQ, Su H, Chen X, Qin XJ, Liu JY, Zhu QG, et al. Mannose 6-phosphate-modified bovine serum albumin nanoparticles for controlled and targeted delivery of sodium ferulate for treatment of hepatic fibrosis. J Pharm Pharmacol. 2009;61:1155–61. doi: 10.1211/jpp/61.09.0004. [DOI] [PubMed] [Google Scholar]
- 10.van Beuge MM, Prakash J, Lacombe M, Gosens R, Post E, Reker-Smit C, et al. Reduction of fibrogenesis by selective delivery of a Rho kinase inhibitor to hepatic stellate cells in mice. J Pharmacol Exp Ther. 2011;337:628–35. doi: 10.1124/jpet.111.179143. [DOI] [PubMed] [Google Scholar]
- 11.Yang N, Ye Z, Li F, Mahato RI. HPMA polymer-based site-specific delivery of oligonucleotides to hepatic stellate cells. Bioconjug Chem. 2009;20:213–21. doi: 10.1021/bc800237t. [DOI] [PMC free article] [PubMed] [Google Scholar]
- 12.Adrian JE, Poelstra K, Scherphof GL, Molema G, Meijer DK, Reker-Smit C, et al. Interaction of targeted liposomes with primary cultured hepatic stellate cells: Involvement of multiple receptor systems. J Hepatol. 2006;44:560–7. doi: 10.1016/j.jhep.2005.08.027. [DOI] [PubMed] [Google Scholar]
- 13.Beljaars L, Molema G, Weert B, Bonnema H, Olinga P, Groothuis GM, et al. Albumin modified with mannose 6-phosphate: A potential carrier for selective delivery of antifibrotic drugs to rat and human hepatic stellate cells. Hepatology. 1999;29:1486–93. doi: 10.1002/hep.510290526. [DOI] [PubMed] [Google Scholar]
- 14.Bisht S, Khan MA, Bekhit M, Bai H, Cornish T, Mizuma M, et al. A polymeric nanoparticle formulation of curcumin (NanoCurc) ameliorates CCl4-induced hepatic injury and fibrosis through reduction of pro-inflammatory cytokines and stellate cell activation. Lab Invest. 2011;91:1383–95. doi: 10.1038/labinvest.2011.86. [DOI] [PMC free article] [PubMed] [Google Scholar]
- 15.Giannitrapani L, Soresi M, Bondi ML, Montalto G, Cervello M. Nanotechnology applications for the therapy of liver fibrosis. World J Gastroenterol. 2014;20:7242–51. doi: 10.3748/wjg.v20.i23.7242. [DOI] [PMC free article] [PubMed] [Google Scholar]
- 16.Dong L, Zuo L, Xia S, Gao S, Zhang C, Chen J, et al. Reduction of liver tumor necrosis factor-alpha expression by targeting delivery of antisense oligonucleotides into Kupffer cells protects rats from fulminant hepatitis. J Gene Med. 2009;11:229–39. doi: 10.1002/jgm.1293. [DOI] [PubMed] [Google Scholar]
- 17.Bhatia SN, Underhill GH, Zaret KS, Fox IJ. Cell and tissue engineering for liver disease. Sci Transl Med. 2014;6:245sr2. doi: 10.1126/scitranslmed.3005975. [DOI] [PMC free article] [PubMed] [Google Scholar]
- 18.Iwakiri Y, Shah V, Rockey DC. Vascular pathobiology in chronic liver disease and cirrhosis - Current status and future directions. J Hepatol. 2014 doi: 10.1016/j.jhep.2014.05.047. [DOI] [PMC free article] [PubMed] [Google Scholar]
- 19.Sadauskas E, Wallin H, Stoltenberg M, Vogel U, Doering P, Larsen A, et al. Kupffer cells are central in the removal of nanoparticles from the organism. Part Fibre Toxicol. 2007;4:10. doi: 10.1186/1743-8977-4-10. [DOI] [PMC free article] [PubMed] [Google Scholar]
- 20.Kermanizadeh A, Chauche C, Balharry D, Brown DM, Kanase N, Boczkowski J, et al. The role of Kupffer cells in the hepatic response to silver nanoparticles. Nanotoxicology. 2014;8(Suppl 1):149–54. doi: 10.3109/17435390.2013.866284. [DOI] [PubMed] [Google Scholar]
- 21.Chiannilkulchai N, Ammoury N, Caillou B, Devissaguet JP, Couvreur P. Hepatic tissue distribution of doxorubicin-loaded nanoparticles after i.v. administration in reticulosarcoma M 5076 metastasis-bearing mice. Cancer Chemother Pharmacol. 1990;26:122–6. doi: 10.1007/BF02897257. [DOI] [PubMed] [Google Scholar]
- 22.Wang W, Soroka CJ, Mennone A, Rahner C, Harry K, Pypaert M, et al. Radixin is required to maintain apical canalicular membrane structure and function in rat hepatocytes. Gastroenterology. 2006;131:878–84. doi: 10.1053/j.gastro.2006.06.013. [DOI] [PMC free article] [PubMed] [Google Scholar]
- 23.Tavoloni N. The intrahepatic biliary epithelium: an area of growing interest in hepatology. Semin Liver Dis. 1987;7:280–92. doi: 10.1055/s-2008-1040583. [DOI] [PubMed] [Google Scholar]
- 24.Daoust R, Cantero A. The numerical proportions of cell types in rat liver during carcinogenesis by 4-dimethylaminoazobenzene (DAB) Cancer Res. 1959;19:757–62. [PubMed] [Google Scholar]
- 25.Wilczewska AZ, Niemirowicz K, Markiewicz KH, Car H. Nanoparticles as drug delivery systems. Pharmacol Rep. 2012;64:1020–37. doi: 10.1016/s1734-1140(12)70901-5. [DOI] [PubMed] [Google Scholar]
- 26.Ramakrishna S, Kwaku Dad AB, Beloor J, Gopalappa R, Lee SK, Kim H. Gene disruption by cell-penetrating peptide-mediated delivery of Cas9 protein and guide RNA. Genome Res. 2014;24:1020–7. doi: 10.1101/gr.171264.113. [DOI] [PMC free article] [PubMed] [Google Scholar]
- 27.Jimenez Calvente C, Sehgal A, Popov Y, Kim YO, Zevallos V, Sahin U, et al. Specific hepatic delivery of procollagen alpha1(I) siRNA in lipid-like nanoparticles resolves liver fibrosis. Hepatology. 2015 doi: 10.1002/hep.27936. [DOI] [PMC free article] [PubMed] [Google Scholar]
- 28.Sato Y, Murase K, Kato J, Kobune M, Sato T, Kawano Y, et al. Resolution of liver cirrhosis using vitamin A-coupled liposomes to deliver siRNA against a collagen-specific chaperone. Nat Biotechnol. 2008;26:431–42. doi: 10.1038/nbt1396. [DOI] [PubMed] [Google Scholar]
- 29.Duong HT, Dong Z, Su L, Boyer C, George J, Davis TP, et al. The use of nanoparticles to deliver nitric oxide to hepatic stellate cells for treating liver fibrosis and portal hypertension. Small. 2015;11:2291–304. doi: 10.1002/smll.201402870. [DOI] [PubMed] [Google Scholar]
- 30.Blomhoff R, Green MH, Green JB, Berg T, Norum KR. Vitamin A metabolism: new perspectives on absorption, transport, and storage. Physiol Rev. 1991;71:951–90. doi: 10.1152/physrev.1991.71.4.951. [DOI] [PubMed] [Google Scholar]
- 31.Sarin H. Physiologic upper limits of pore size of different blood capillary types and another perspective on the dual pore theory of microvascular permeability. J Angiogenes Res. 2010;2:14. doi: 10.1186/2040-2384-2-14. [DOI] [PMC free article] [PubMed] [Google Scholar]
- 32.Rensen PC, Sliedregt LA, Ferns M, Kieviet E, van Rossenberg SM, van Leeuwen SH, et al. Determination of the upper size limit for uptake and processing of ligands by the asialoglycoprotein receptor on hepatocytes in vitro and in vivo. J Biol Chem. 2001;276:37577–84. doi: 10.1074/jbc.M101786200. [DOI] [PubMed] [Google Scholar]
- 33.Bartneck M, Warzecha KT, Tacke F. Therapeutic targeting of liver inflammation and fibrosis by nanomedicine. Hepatobiliary Surg Nutr. 2014;3:364–76. doi: 10.3978/j.issn.2304-3881.2014.11.02. [DOI] [PMC free article] [PubMed] [Google Scholar]
- 34.Lv H, Zhang S, Wang B, Cui S, Yan J. Toxicity of cationic lipids and cationic polymers in gene delivery. J Control Release. 2006;114:100–9. doi: 10.1016/j.jconrel.2006.04.014. [DOI] [PubMed] [Google Scholar]
- 35.Breunig M, Lungwitz U, Liebl R, Goepferich A. Breaking up the correlation between efficacy and toxicity for nonviral gene delivery. Proc Natl Acad Sci U S A. 2007;104:14454–9. doi: 10.1073/pnas.0703882104. [DOI] [PMC free article] [PubMed] [Google Scholar]
- 36.Conwell CC, Liu F, Huang L. Several serum proteins significantly decrease inflammatory response to lipid-based non-viral vectors. Mol Ther. 2008;16:370–7. doi: 10.1038/sj.mt.6300356. [DOI] [PubMed] [Google Scholar]
- 37.Khazanov E, Simberg D, Barenholz Y. Lipoplexes prepared from cationic liposomes and mammalian DNA induce CpG-independent, direct cytotoxic effects in cell cultures and in mice. J Gene Med. 2006;8:998–1007. doi: 10.1002/jgm.933. [DOI] [PubMed] [Google Scholar]
- 38.Kumari A, Yadav SK, Yadav SC. Biodegradable polymeric nanoparticles based drug delivery systems. Colloids Surf B Biointerfaces. 2010;75:1–18. doi: 10.1016/j.colsurfb.2009.09.001. [DOI] [PubMed] [Google Scholar]
- 39.Danhier F, Ansorena E, Silva JM, Coco R, Le Breton A, Preat V. PLGA-based nanoparticles: an overview of biomedical applications. J Control Release. 2012;161:505–22. doi: 10.1016/j.jconrel.2012.01.043. [DOI] [PubMed] [Google Scholar]
- 40.Vert M, Mauduit J, Li S. Biodegradation of PLA/GA polymers: increasing complexity. Biomaterials. 1994;15:1209–13. doi: 10.1016/0142-9612(94)90271-2. [DOI] [PubMed] [Google Scholar]
Associated Data
This section collects any data citations, data availability statements, or supplementary materials included in this article.


