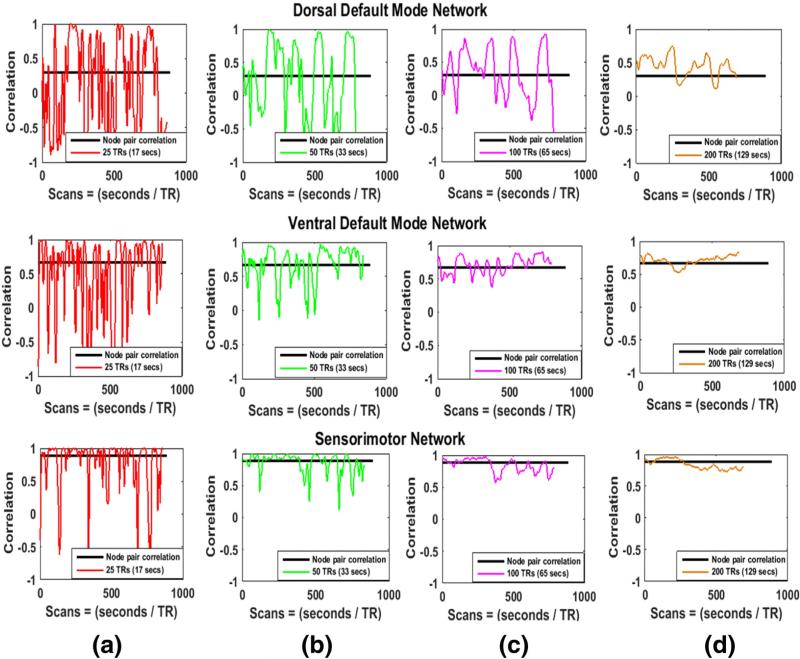
Fig. 2.
Stationary and sliding window correlations of three node pairs (selected at random) from three different real resting-state networks. Stationary correlations of the node pairs are shown by black horizontal lines. The size of the window increases from left to right. The SWC fluctuates around the stationary correlation and these fluctuations are largest for smallest window in (a) and decrease as the window size increases towards the right.

