

Summary
Topologically Associating Domains (TADs) are fundamental structural and functional building blocks of human interphase chromosomes, yet mechanisms of TAD formation remain unclear. Here we propose that loop extrusion underlies TAD formation. In this process, cis-acting loop-extruding factors, likely cohesins, form progressively larger loops, but stall at TAD boundaries due to interactions with boundary proteins, including CTCF. Using polymer simulations, we show that this model produces TADs and other fine features of Hi-C data. Contrary to typical illustrations, each TAD consists of multiple loops dynamically formed through extrusion, rather than a single static loop. Loop extrusion both explains diverse experimental observations, including the preferential orientation of CTCF motifs, enrichments of architectural proteins at TAD boundaries, and boundary deletion experiments, and makes specific predictions for depletion of CTCF versus cohesin. Finally, loop extrusion has additional, potentially far-ranging, consequences for processes including enhancer-promoter interactions, orientation-specific chromosomal looping, and compaction of mitotic chromosomes.
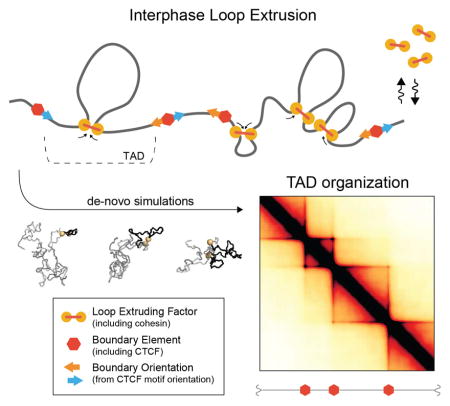
Graphical Abstract
Introduction
Interphase chromosome organization in three dimensions underlies critical cellular processes, including gene regulation via enhancer-promoter interactions. Recent advances in mapping chromosomal interactions genome-wide have found that the interphase chromosomes of higher eukaryotes are partitioned at a sub-megabase scale into a sequence of self-interacting topologically associating domains (TADs, Dixon et al., 2012; Nora et al., 2012), or domains (Rao et al., 2014; Sexton et al., 2012). An increasing number of studies have found important functional roles for TADs in the control of gene expression and development (Andrey et al., 2013; Lupiáñez et al., 2015; Symmons et al., 2014).
TADs are contiguous regions of enriched contact frequency that appear as squares in a Hi-C map (Fig 1A), and are relatively insulated from neighboring regions. Many TADs have homogeneous interiors, while others have complex and hierarchical structures, and particularly sharp or enriched boundaries. More recently, high resolution maps revealed peaks of interactions between loci at the boundaries of TADs (“peak-loci” (Rao et al., 2014)). TADs differ from larger-scale A/B compartments in that they do not necessarily form an alternating ‘checkerboard’ pattern of enriched contact frequencies (Lajoie et al., 2014), and several TADs often reside within a single contiguous compartment (Gibcus and Dekker, 2013; Gorkin et al., 2014) (Supplemental Note).
Fig 1. Loop extrusion as a mechanism TAD formation.

A. Examples of Hi-C contact maps at 5kb resolution showing TADs from four chromosomal regions (GM12878 in-situ MboI (Rao et al., 2014)), highlighting TADs (purple lines) and interaction peaks (blue circles).
B. Model of LEF dynamics (fig. S1): LEFs shown as linked pairs of yellow circles, chromatin fiber in grey. From top to bottom: extrusion, dissociation, association, stalling upon encountering a neighboring LEF, stalling at a BE (red hexagon).
C. Schematic of LEF dynamics (Movie-M1, Movie-M2).
D. Conformation of a polymer subject to LEF dynamics, with processivity 120kb, separation 120kb. Left: shows LEFs (yellow), and chromatin (grey), for one conformation, where darker grey highlights the combined extent of three regions of sizes (180kb, 360kb, 720kb) separated by BEs. Right: the progressive extrusion of a loop (black) within a 180kb region.
E. Simulated contact map for processivity 120kb, separation 120kb.
Although often illustrated as large loops, several lines of evidence indicate that TADs are not simply stable loops formed between two boundary loci. First, only 50% of TADs have corner-peaks (Rao et al., 2014). Second, boundary loci do not appear to be in permanent contact either by FISH (Rao et al., 2014), or by their relative contact frequency (see results). Third, while TADs are enriched in contact probability throughout the domain, polymer simulations show that simple loops display enrichment only at the loop bases, unless the loop is very short (Benedetti et al., 2014; Doyle et al., 2014). For these reasons, identifying mechanisms of how TADs are formed remains an important open question.
While polymer models have provided insight into multiple levels of chromosome organization (Bau et al., 2011; Lieberman-Aiden et al., 2009; Marko and Siggia, 1997; Naumova et al., 2013; Rosa and Everaers, 2008), relatively few have focused on TADs. Of those that have considered TADs, some have focused primarily on characterizing chromosome structure rather than mechanisms of folding (Giorgetti et al., 2014; Hofmann and Heermann, 2015). Others (Barbieri et al., 2012; Jost et al., 2014) have considered models where monomers of same type experience preferential pairwise attractions to produce TADs; such models, however, when generalized to the genome-wide scale would require a separate factor to recognize and compact each TAD. With only several types of monomers, this would produce checkerboard patterns for each type, which is characteristic of compartments rather than TADs. One proposed mechanism giving good agreement to the observed TAD organization relies on supercoiling (Benedetti et al., 2014). Still, the connection between supercoiling and higher-order eukaryotic chromosome organization remains unclear, since the reported agreement between supercoiling domain boundaries and TAD boundaries is roughly 1-in-10 (Naughton et al., 2013).
Here we propose a mechanism whereby TADs are formed by loop extrusion (Alipour and Marko, 2012; Nasmyth, 2001). In this process, cis-acting loop-extruding factors (LEFs, likely cohesins) form progressively larger loops, but are stalled by boundary elements (BEs, including bound CTCF) at TAD boundaries (Fig 1B–C). We tested this mechanism using polymer simulations of the chromatin fiber subject to the activity of LEFs. We found it can produce TADs that quantitatively and qualitatively agree with Hi-C data. Importantly, our work provides a mechanism for preferentially forming contacts within TADs; such a mechanism is implicitly assumed in structural models of TADs formed by dynamic loops (Giorgetti et al., 2014; Hofmann and Heermann, 2015). Loop extrusion (Alipour and Marko, 2012), first introduced as processive loop enlargement by condensin (Nasmyth, 2001), has been implicated in mitotic chromosome compaction (Goloborodko et al., 2015; Naumova et al., 2013), and chromosome segregation in bacteria (Gruber, 2014; Wang et al., 2015). Importantly, however, these previous proposals did not consider any role of loop extrusion for TAD formation in interphase and did not directly test the impact of loop extrusion on 3D spatial organization or contact maps.
Results
Mechanism of loop extrusion with boundary elements
To demonstrate how loop extrusion can lead to the formation of TADs, we first defined the dynamics of LEFs limited by BEs (Fig 1B–C, fig S1A). Upon binding to the chromatin fiber, each LEF holds together two directly adjacent regions; it then extrudes a loop by translocating along the chromatin fiber in both directions, holding together progressively distant regions of a chromosome. Translocation stops when the LEF encounters an obstacle, either another LEF, or a BE. If halted only on one side, LEFs continue to extrude on the other side. Throughout this process, LEFs can stochastically dissociate, releasing the extruded loop; for generality, we assume that this occurs uniformly across the genome. BEs underlie the formation of TADs by stalling LEF translocation, and thus ensuring that extruded loops do not cross TAD boundaries. BEs in vivo might be formed by specifically bound architectural proteins, including CTCF, or any other impediment to LEF translocation. We note that BEs in vivo may be partially permeable because they either stochastically stall LEFs or are present in a fraction of cells.
Minimal 3D model of interphase loop extrusion
To efficiently explore how loop-extrusion dynamics spatially organize an interphase chromosome, we first studied a minimal model. In particular, we modelled a 10Mb region of the chromatin fiber as a polymer subject to the activity of associating and dissociating LEFs limited by impermeable BEs (Fig 1C). As previously (Naumova et al., 2013), we modelled the chromatin fiber as a polymer of 10nm monomers (roughly three nucleosomes or 600bp) with excluded volume interactions and without topological constraints, subject to Langevin dynamics in OpenMM (Eastman et al., 2013). LEFs impose a system of bonds on the polymer: a bound LEF forms a bond between monomers at the two ends of an extruded loop, and the bond is re-assigned to increasingly separated pairs of monomers as a LEF translocates along the chromosome; when a LEF unbinds, this bond is removed. BEs, which halt LEFs translocation, were placed at fixed positions with sequential separations of 180kb, 360kb, and 720kb, through the 10Mb region.
The dynamics of loop extrusion are determined by two independent parameters (Fig 2B, fig. S1B, S2): the average linear separation between bound LEFs, and the LEF processivity, i.e. the average size of a loop extruded by an unobstructed LEF over its lifetime (Goloborodko et al., 2015). Our model is additionally characterized by parameters governing the diffusivity of chromatin, polymer stiffness, density, and the Hi-C capture radius. For each set of parameter values, we ran polymer simulations long enough to allow ≥10 association/dissociation events per LEF (Movie-M1, Movie-M2). From simulations, we obtain an ensemble of chromosome conformations (Fig 1D) and compute average contact frequency maps (“simulated Hi-C”, Fig 1E) that can be compared with experimental Hi-C data.
Fig 2. Quantitative analysis of loop extrusion.

A. Experimental P(s) (shaded areas) versus simulated P(s) for the 100 best-fitting parameter-sets (lines, one per parameter-set) within TADs (purple) and between TADs (green). Experimental P(s) calculated from 2kb contact maps and normalized to one at 4kb; shaded area shows 10th and 90th percentiles at each genomic distance. Simulated P(s) shown with vertical offsets from fitting (fig. S2).
B. Goodness-of-fit versus LEF processivity and separation for the 100 best-fitting parameter-sets (from 6912 total parameters-sets). Circle areas represent the number of parameter-sets among the top-100, while color quantifies the best-fit at each processivity-separation pair; a value of 1 indicates a perfect fit.
C–F. Simulated contact maps for the indicated processivity-separation pairs.
For many values of LEF processivity and separation, we observe the formation of TADs on a simulated Hi-C map (Fig 2C–E). For some parameter values we observe formation of homogenous TADs; other simulated parameter sets lead to the formation of peaks at corners of TADs, or enrichment of contacts at the boundary of TADs, seen as lines along the edge of a TAD (Database D1). These simulations illustrate how the combined action of LEFs and BEs leads to enrichment of interactions within TADs and effective insulation between neighboring TADs.
TADs are formed by dynamic loops
We next tested the ability of our model to reproduce the dependence of Hi-C contact frequency P(s) with distance s, used previously for quantifying polymer models (Barbieri et al., 2012; Benedetti et al., 2014; Le et al., 2013; Naumova et al., 2013; Rosa et al., 2010). We aimed to reproduce both P(s) within TADs of sizes 180kb, 360kb and 720kb, and P(s) between TADs. We determined the goodness-of-fit for each parameter-set as the geometric standard deviation between the four experimental and four simulated P(s) curves. Note that P(s) between TADs is ~2-fold smaller and scales differently with distance (Fig 2A, fig. S2C). For each pair of values of LEF processivity and LEF separation, we quantified the best achieved goodness-of-fit and the number of times a pair appears among the top-100 out of 6912 total parameter-sets (Fig 2B).
We found the best agreement with Hi-C data is achieved for LEF processivity of ~120–240kb and LEF separation ~120Kb (Fig 2A–B), where the resulting TADs consist of dynamically forming, growing and dissociating loops (Fig 3A, fig. S1E,F). In this regime, LEFs extrude ~75Kb loops relatively independently, as there are substantial gaps between LEFs (52–69% coverage of TADs by loops).
Fig 3. TADs formed by LEFs consist of dynamically forming, growing and dissociating loops.

A. Illustration of how TADs formed by loop extrusion result from averaging the dynamic positions of loop-bases over many cells, including configurations with nested (cell 6) and consecutive (cell 4) loops (fig. S1).
B. left: simulated contact map, as in 1E, is an average of many single-cell maps. right: simulated single-cell contact maps (18kb resolution, green circles show LEF positions).
C. Conformation of a polymer subject to LEF dynamics with processivity 120kb, and separation 120kb. Three neighboring regions between BEs of sizes (180kb, 360kb, 720kb) colored in (green, pink, blue). Contacts from an ensemble of such conformations are averaged together to form a contact map.
Notably, TADs are barely visible in simulated single-cell contact maps (Fig. 3B). Moreover, only a small fraction of contacts on the map are directly mediated by LEFs. Consistently, polymer conformations display high spatial overlap between adjacent TADs rather than appearing as segregated globules (Fig 3C, fig. S3A). Indeed, in both simulated and experimental Hi-C maps there is only ~2-fold depletion of contacts between neighboring TADs (Fig. 2A, fig. S2C). Together, this demonstrates how TADs emerge as a population-average feature.
Loop extrusion recapitulates results of experimental TAD boundary deletions
Importantly, the mechanism of loop extrusion naturally recapitulates the results of TAD boundary deletion experiments (Nora et al., 2012). Upon experimental deletion of a TAD boundary, the TAD spreads to the next boundary; this indicates that preferential interactions between loci in a TAD are not hard-wired, and that boundary elements play crucial roles. This behavior has been confirmed with targeted disruption of CTCF binding motifs at TAD boundaries (Guo et al., 2015; Narendra et al., 2015; Sanborn et al., 2015; de Wit et al., 2015). Consistently, in our model, deletion of a BE leads to spreading of a TAD until the next BE (fig. S1C,D).
TAD corner peaks are not permanent loops
Many TADs appear to have peaks of interactions at their corners in Hi-C data (~50%, (Rao et al., 2014)). Interestingly, we found that TADs with and without peaks have similar P(s), suggesting a similar underlying organizational mechanism, independent of the corner-peak (fig. S2C). In agreement, our model shows that the mechanism of loop extrusion can produce both types of TADs, as increasing LEF processivity naturally strengthens peaks at TAD corners (Fig 2E–F, fig. S2A). Interestingly, our simulations show that TADs with visibly strong peaks do not require permanent contact between BEs, in agreement with our analyses of Hi-C data (fig. S4F,G).
Our simulations, together with previous polymer studies of chromatin loops (Benedetti et al., 2014; Doyle et al., 2014; Hofmann and Heermann, 2015), demonstrate that a single stable loop is incapable of producing TADs. As follows, we refrain from referring to TAD corner-peaks as loops, or drawing TADs as loops held together by their BEs. Indeed, we find that stable loops between BEs provide among the worse fits to Hi-C data, with exceedingly-strong corner-peaks and a lack of visible TADs (Fig 4, fig. S4). This stands in contrast with popular depictions of TADs as loops (Rao et al., 2014). Instead, our model predicts that TADs with and without corner-peaks result from the collective activity of LEFs in the region between BEs.
Fig 4. Simple Strong Loops are not TADs.

A. Experimental P(s) (shaded areas) versus simulated P(s) (solid lines) for a parameter-set with a strong loop between neighboring BEs, calculated as in Fig 2A. Here, the fit is relatively poor, (1.4137, rank 2208 out of 6912), and loops are not completely permanent, with BEs in contact 27% of the time for 180kb TAD and 14% for the 720kb TAD.
B. Simulated contact map for a simple strong loop with processivity 960kb, separation 960kb.
C. Illustration of how a single loop present in many cells leads to strong corner-peaks between neighboring BEs.
TADs require long-range insulation
Importantly, insulation between neighboring TADs in our model does not arise from direct physical blocking of interactions between distal genomic regions by BEs. Instead, our model relies on the ability of BEs to regulate the translocation of LEFs. LEFs allow for insulation to be mediated over spatial and genomic distances much larger than the physical size of the BE. To rule out the possibility that a bulky BE is sufficient to insulate neighboring TADs, we performed simulations of this scenario. Indeed, in simulations where a BE is simply a bulky object, we see no long-range insulation and fail to obtain TADs (Fig. 5, fig. S5). Similarly, in simulations where the chromatin fiber is locally very stiff at a BE, we again only see local insulation, and also fail to obtain TADs. Together, these simulations highlight the role of LEFs for imposing insulation at the scale of whole TADs.
Fig 5. TADs require long range insulation.

A. Illustration of a genomic region with an insulating element (red hexagon), a promoter (blue square) and an enhancer (green oval) in 1D (Supplemental note)
B. Illustration and contact map for a model of BEs as large bulky objects (e.g. bound by proteins or RNA). Each BE is bound by 3 polymer chains of length 10.
C. As above, for a model of BEs as a stiff region of chromatin (10 monomers of stiffness 6).
D. As above, for a model with direct BE-to-BE attraction (attraction strength 3).
Another important characteristic of our model is that loops extruded by LEFs act in cis, along the chromatin fiber, and do not impose interactions between genomically distal loci or loci on different chromosomes. Indeed, when we analyzed the interaction patterns of peak-loci in Hi-C data, we found that there was no enrichment of contacts between pairs of peak-loci at larger separations on the same chromosome or between different chromosomes (fig. S5). This pattern is consistent with our model, but is inconsistent with models that rely on direct interactions between BEs when such loci come into spatial proximity.
To rule out the mechanism whereby TADs are formed by direct BE-to-BE associations, we performed simulations where any two BEs would interact when they came into close spatial proximity (fig. S5). Biologically, this represents a scenario where proteins interact to bridge cognate genomic elements (Barbieri et al., 2012; Bohn and Heermann, 2010; Brackley et al., 2015; Scolari and Lagomarsino, 2015), for example via interactions mediated by dimerization of bound CTCF. Our simulations confirmed that a direct BE-to-BE mechanism has no way of distinguishing between distant or proximal chromosomal regions; instead, all pairs of BEs display peaks of contact probability. Moreover, direct BE-to-BE interactions alone imposed negligible insulation between neighboring TADs, even in the case of strongly interacting BEs. Together, these results demonstrate the utility of LEFs stalled by BEs for restricting potentially interacting pairs of loci to those that are within TADs.
Molecular roles for cohesin and CTCF as LEFs and BEs
We next investigated possible molecular candidates for LEFs and BEs for TAD formation in interphase. We find that our proposed roles of cohesin as a LEF, and CTCF as a BE, both reconciles existing experimental results and predicts outcomes of future experiments.
Multiple lines of evidence point to cohesin as a possible LEF in interphase. Like condensin, cohesin is a Structural Maintenance of Chromosome (SMC) complex. These have been hypothesized to extrude chromatin loops (Alipour and Marko, 2012; Nasmyth, 2001) and have similar molecular architectures to known motor proteins (Guacci et al., 1993; Nasmyth, 2001; Peterson, 1994). Cohesins have been implicated in interphase TAD organization (Mizuguchi et al., 2014; Sofueva et al., 2013; Zuin et al., 2014) and chromatin looping (Kagey et al., 2010) beyond their role in sister chromatid cohesion. Indeed, cohesins dynamically bind chromatin even before DNA replication (Gerlich et al., 2006). Finally, cohesin is enriched at interphase TAD boundaries (Dixon et al., 2012) and corner-peaks (Rao et al., 2014), and its depletion makes TADs less prominent (Sofueva et al., 2013; Zuin et al., 2014).
CTCF is a similarly-relevant molecular candidate for forming BEs. First, CTCF is enriched at TAD boundaries (Dixon et al., 2012), its depletion makes TADs less prominent (Zuin et al., 2014), and it has a relatively long residence time on chromatin (Nakahashi et al., 2013). Second, bound CTCF interacts with cohesin (Parelho et al., 2008) in an orientation-dependent manner (Xiao et al., 2011), similar to the interactions of shugoshin (Hara et al., 2014) and sororin (Nishiyama et al., 2010) with cohesin. Third, inwards-oriented CTCF sites are enriched at TAD boundaries (Rudan et al., 2015) and TAD corner-peaks (Rao et al., 2014). We note that any impediment to LEF translocation may serve as a BE. As follows, BEs in vivo may be formed by sites with high occupancy of proteins other than CTCF (Van Bortle et al., 2014) that block LEF translocation physically rather than through a specific interaction. For example, active promoters bound by transcription-associated machinery are a prominent candidate, as they are particularly bulky and are enriched at TAD boundaries (Dixon et al., 2012; Ulianov et al., 2015).
Loop extrusion predicts effects of cohesin and CTCF perturbations
The proposed roles of cohesin as a LEF and CTCF as a BE makes predictions for patterns of cohesin and CTCF binding, genomic engineering experiments at particular loci, and global perturbations of cohesin and CTCF levels on chromosomal organization. First, analogous to LEF accumulation at BEs in our simulations (Fig 6B), we predict that cohesin accumulates at CTCF binding sites, but only when CTCF is bound at these sites (Parelho et al., 2008). Consistently, we find that cohesin ChIP-seq peaks are more enriched around strongly-bound CTCF peaks (Fig 6C–D). This suggests that CTCF binding strength can translate into BE permeability.
Fig 6. CTCF as a directional boundary element.

A. Inward-oriented CTCF sites at TAD boundaries are consistent with loop extrusion and a directional boundary function of CTCF (fig. S6).
B. Accumulation of LEFs at BEs for simulations with processivity 120kb and separation 120kb.
C. Distributions of CTCF, Smc3, and Rad21 ChIP-seq peak summits in the vicinity of the 4000 strongest motif-associated CTCF binding peaks (orientation indicated by blue arrow).
D. Same, but for the weakest 4000 motif-associated CTCF binding sites.
E. Asymmetry in ChIP-seq peaks around the strongest 4000 motif-associated CTCF ChIP peaks. Each dot represents an ENCODE GM12878 ChIP-seq track. The y-axis shows the number of peaks within +/− 200bp of a CTCF motif. The x-axis shows the difference between the number of factors on the right and on the left of the motif, i.e. asymmetry of the factor relative to a CTCF motif.
F. Same, but for the weakest 4000 motif-associated CTCF ChIP peaks.
Second, with these molecular roles, our simulations make predictions about changes in contact maps and spatial distances that would result from experimental perturbations to cohesin and CTCF (fig. S2). In particular, we predict that depletion of CTCF will result in increased permeability of BEs thus reducing insulation between neighboring TADs, yet would have little effect on spatial distances of loci within TADs and only moderately reduce spatial distances of loci between TADs. In contrast, depletion of cohesin, modeled as an increased LEF separation, would also make TADs weaker, but would be accompanied by more drastic increases of distances for loci both within and between TADs. Currently-available Hi-C data supports such differential, non-redundant, effects of CTCF and cohesin depletion on Hi-C maps (Zuin et al., 2014). Consistently, available imaging data supports decompaction following cohesin depletion (Nolen et al., 2013; Sofueva et al., 2013; Zuin et al., 2014), and lack of decompaction following CTCF depletion (Nolen et al., 2013). Finally, our model predicts that greatly increased cohesin binding time, modeled as greatly increased LEF processivity, would condense interphase chromosomes into a prophase-like ‘vermicelli’ state (fig. S3), as seen upon depletion of the cohesin unloader Wapl (Tedeschi et al., 2013).
Complex TAD architectures from directional CTCF boundaries
If bound CTCFs act as a directional BEs then the mechanism of loop extrusion can also explain the observed enrichment in convergent CTCF sites at TAD boundaries and loop bases, even at very large genomic separations (Fig 6A, fig. S6). Loop extrusion with directional BEs also provides a rationale for results of manipulating CTCF site orientation, where flipping solely the orientation of a CTCF site can cause two neighboring TADs to merge (Guo et al., 2015; Narendra et al., 2015; Sanborn et al., 2015; de Wit et al., 2015). Interestingly, we find that CTCF binding sites at TAD boundaries are oriented such that the C-terminus of bound CTCF (Nakahashi et al., 2013), known to interact with cohesin (Xiao et al., 2011), faces the interior of TADs. Indeed, we find that cohesin ChIP-seq peaks are enriched in this exact orientation-dependent manner around strongly-bound CTCF peaks (Fig 6C–F). Together, these observations support a mechanism where CTCF acts as a boundary element that impedes loop extrusion by cohesins in an orientation-dependent manner.
To further test whether CTCF as a directional BE can recapitulate the rich variety of TAD domain architectures in vivo, we extended the minimal model introduced above to investigate a complex system of directional BEs with locus-specific permeability (Fig 7). For these simulations, we converted ChIP-seq data for CTCF over a 15Mb region of human chromosome 14 into BE permeability and directionality. First, we assigned directionality of CTCF sites using the nearest cohesin peak for those CTCF sites without an associated motif. Second, we transformed CTCF ChIP-seq data using a logistic function such that weakly bound CTCF sites formed permeable BEs. We found that when parameters of the minimal model described above were used, the abundant permeable boundaries in this system produced contact maps with good agreement to Hi-C maps at short distances (<400kb), but poor agreement at further distances (fig. S7). We found that better agreement at far distances can be obtained if we increased LEF processivity to 360kb (corresponding to an increase in average loop size from ~75kb to ~135kb). Still, even with increased LEF processivity, agreement along the chromosome was non-uniform (fig. S7).
Fig 7. Complex TAD architectures from loop extrusion.

A. Schematic of LEF dynamics with directional BEs.
B–C. Directional BE strength profile (the sum of BEs occupancies within a 12kb bin) for regions simulated in (d–g).
D–G. Simulated contact maps for regions of human chr14, GM12878 cell type, for models with orientation specific BEs of varying permeability. Maps are compared with experimental maps for the same regions at the same 12kb resolution (fig. S7). LEF processivity is 120kb (d,e) and 360kb (e,f).
Upon inspecting these simulated maps (Fig. 7, fig. S7), we noticed that strong CTCF sites tend to produce stronger boundaries both in simulations and in the Hi-C data, while weak CTCF sites (e.g. 66.5Mb) had minimal effects on both maps. Consistently, CTCF sites which are not at annotated TAD boundaries have lower CTCF occupancy (fig. S6). In both maps, CTCF-depleted regions formed large homogenous domains (e.g. 62.6–63.6Mb). Moreover, we found that our simulations recapitulated several other features of TAD organization, including: nested TADs (e.g. 62Mb); strong interactions between the BE and the body of the domain (“lines” at the edge, or perimeter, of the TAD, e.g. 65.9Mb); and complex networks of interactions between several BEs (“grids” of peaks, e.g. 66Mb). These results illustrate how not only TADs but finer structures similar to those found in experimental Hi-C maps naturally emerge in our simulations without being directly encoded; this further supports loop extrusion as a mechanism of chromosomal organization in interphase.
Discussion
In summary, our model of loop extrusion not only forms TADs in agreement with Hi-C, but agrees with a number of specific features observed experimentally. First, loop extrusion naturally produces enrichment of contacts within a domain, and can create corner-peaks between TAD boundaries.
Second, loop extrusion naturally explains finer structures including nested TADs, lines at TAD edges, and grids of peaks. Third, it explains why peaks of interactions are absent between distal BEs and BEs on different chromosomes. Fourth, it explains merging of TADs seen in boundary deletion experiments. Fifth, it provides a rationale for inward-oriented CTCF motifs at TAD boundaries. Sixth, it explains a directional bias in the accumulation of cohesin peaks around bound CTCF motifs. Seventh, it is consistent with current Hi-C and microscopy results for CTCF and cohesin depletion. Finally, it allows for interaction peaks between BEs that are not simple stable loops, as necessary for consistency with available Hi-C and microscopy data (Imakaev et al., 2015). Moreover, our model makes predictions for further experiments, strengthening the case for loop extrusion as a mechanism of TAD formation. Given the ability of loop extrusion to recapitulate complex locus-specific folding patterns, we propose that TADs may be better understood as one of many emergent phenomena from loop extrusion, rather than a discrete and distinct set of genomic entities.
Loop extrusion as a model of TAD formation in interphase has recently received a significant amount of attention. In (Nichols and Corces, 2015), the authors propose, but did not quantitatively test, that bound CTCF can load cohesin in an orientation-specific manner, holding one side of the cohesin complex while the other translocates to form an extruded loop. We note that if the majority of cohesin is loaded in this fashion, the results of cohesin depletion would be similar to CTCF depletion, in contrast with current experimental results reporting non-redundant effects (Zuin et al., 2014); in the context of loop extrusion, details of LEF loading and BE function are important subjects for future study. In (Sanborn et al., 2015), published while our manuscript was available as a preprint (http://dx.doi.org/10.1101/024620), the authors considered a tension globule model as well as a loop extrusion model similar to the one presented here. Surprisingly, for both the tension globule and the loop extrusion models, they find good agreement with experimental P(s) that is robust to changes in simulation parameters. In contrast, for loop extrusion, we find that P(s) depends strongly on the parameters of LEF dynamics. This may be because we considered a wider range of LEF processivities and separations, spanning from a free-polymer regime, to a permanent loop regime, to a compacted ‘vermicelli’ regime. Also in contrast with (Sanborn et al., 2015), where 13 out of 13 genomic engineering experiments were successfully predicted, we found a nonuniform agreement as a function of genomic position between the results of our simulations and HiC maps. We believe our observation of non-uniform agreement along the chromosome can reflect: additional undetermined factors underlying BEs, locus-specific details of LEF dynamics (including sites of loading and unloading); the role of higher-order active and inactive compartments (Brackley et al., 2015; Jost et al., 2014); or locus-specific experimental details of Hi-C and ChIP-seq (Imakaev et al., 2012; Yaffe and Tanay, 2011).
Considering a wide range of LEF processivities and separations allowed us to make predictions regarding the effects of CTCF and cohesion perturbations. Indeed, our simulations predict distinct consequences of CTCF and cohesin depletion on Hi-C maps and spatial distances, consistent with available imaging and Hi-C data (Nolen et al., 2013; Sofueva et al., 2013; Zuin et al., 2014). Still, further validation of our predictions requires new methods for architectural protein removal, as available techniques have yet to fully disrupt TAD formation. Additionally, we note that other proteins complexes may play important roles in chromosome organization, potentially via mechanisms distinct from loop extrusion; for example, bound polycomb may be able to self-associate, thus compacting polycomb-bound regions (Boettiger et al., 2016), and possibly contributing to the formation of TAD-like domains (Williamson et al., 2014).
The mechanism of loop extrusion in interphase has additional, potentially far-ranging, consequences for processes in the nucleus. First, enhancer-promoter pairings can be dictated by the relative placement of BEs, including CTCF (Hou et al., 2008). Second, loop extrusion may have an even stronger effect if LEFs stall at promoters, effectively turning the enhancer-promoter search process into a 1D search process, and allowing for orientation-specific interactions. Third, loop extrusion may facilitate high-fidelity VDJ and class switch recombination and other processes dependent on long-range intra-chromosomal looping with specific orientations, particularly given the observed interplay between CTCF and cohesin (Alt et al., 2013; Degner et al., 2011; Dong et al., 2015; Lin et al., 2015).
Finally, the mechanism of TAD formation via loop extrusion studied here is similar to the proposed mechanism of mitotic chromosome condensation (Alipour and Marko, 2012; Goloborodko et al., 2015, 2016; Nasmyth, 2001; Naumova et al., 2013), but with the addition of BEs and many fewer, less processive, LEFs. Accordingly, increasing the number and processivity of LEFs and removing BEs could underlie the transition from interphase to mitotic chromosome organization. Conversely, upon exit from mitosis, interphase 3D chromosome organization can be re-established by restoring previous BE positions, which could potentially be epigenetically inherited bookmarks (Kadauke and Blobel, 2013).
Experimental Procedures
LEF dynamics with boundary elements
LEF translocation along a chromatin fiber was simulated on a 1D lattice, where each position was characterized by the following parameters: association (birth) probability, dissociation (death) probability, and BE occupancy (stalling probability). For the minimal model, we considered a system with uniform birth probability, constant death probability, a fixed number of LEFs, and a discrete number of completely impermeable BEs. As previously (Goloborodko et al., 2015), we modeled LEFs as having two “heads” connected by a linker.
3D simulations
We represent chromatin fibers as a polymer of spherical monomers connected by harmonic bonds, with stiffness and a soft-core repulsive potential). Simulations were performed with Langevin dynamics in periodic boundary conditions using OpenMM (Eastman and Pande, 2010; Eastman et al., 2013). The two monomers held by the two heads of each LEF were connected by a harmonic bond. A 3D-to-1D dynamics parameter controlled the number of 3D-simulation time-steps per 1D-simulation time-steps.
Minimal 3D polymer model
We performed simulations of a polymer chain consisting of 8 groups of three TADs of 300, 600, and 1200 monomers each, arranged sequentially (300, 600, 1200, 300, …). Impermeable BEs were placed between neighboring TADs. For each parameter set, we collected 2000 conformations to calculate P(s) and 10000 for contact maps.
Parameter sweep
We considered the following values for the 5 simulation parameters:
LEF processivity: 100, 200, 400, 800, 1200, 1600
LEF separation: 50, 100, 200, 400, 800, 1600
3D-to-1D dynamics: 300/4, 1000/4, 5000/4
Stiffness S: 0, 2, 4, 6
Density: 0.05, 0.2
For each of these 864 separate simulations, we generated 2000 conformations (total 1,728,000), and calculated contact maps for the 8 values of the Hi-C capture radius (the distance at which contacts between two monomers are recorded; 2, 3, 4, 5, 6, 7, 8, 10) for a total of 6912 parameters sets.
Experimental P(s) and Hi-C maps
To calculate experimental P(s) within and between TADs, we used publicly-available data and annotations from (Rao et al., 2014). Data were processed in-house using hiclib (Imakaev et al., 2012), for GM12878 inSitu protocol and MboI restriction enzyme, binned at 2kb. Displayed Hi-C maps were at 5kb resolution, processed similarly.
Goodness-of-fit
To compare experimental and simulated P(s), we selected experimental TADs 0.9–1.1 of the size of a simulated TAD, (180kb, 360kb and 720kb). The goodness-of-fit was the geometric standard deviation of the ratio of simulated to experimental P(s). Since the best fitting models had diverse parameter sets, we took first 100 best fitting models (fit values 1.103 to 1.195) and assessed how frequently each pair of (processivity, separation) occurs in this list, and what the best fit was for each pair.
ChIP-seq peaks around oriented CTCF motifs
Motifs were assigned to ENCODE narrow peak calls in the GM12878 cell line by interval intersection using bedtools (Quinlan and Hall, 2010). Genome-wide CTCF motif matches were also obtained from ENCODE (Kheradpour and Kellis, 2014) using the CTCF_known1 motif. For 4000 most and least enriched CTCF peaks, we produced histograms of the summit positions of ENCODE called ChIP peaks for other factors.
Converting CTCF ChIP-seq to orientation-specific BE permeability
To convert ChIP-seq peak strength to the occupancy of simulated BEs, we used a logistic transformation f(x)=1/(1 + exp(−x/20 − mu)), where x is a sum of peak fold-change-over-input values for peaks with a given orientation in a 600bp bin. Mu=3 was used normally, mu=2 or mu=4 was used for higher or lower CTCF occupancy. Peak orientation was determined by the motif orientation; when unavailable, we used relative orientation of CTCF and the closest Rad21 peak.
3D polymer model with orientation-specific BEs
We modelled a 15MB region of human chr14, 60,000,000 to 75,000,000, using the same parameters as the best-fitting minimal model. We also considered simulations with different processivity and CTCF occupancy. The simulated contact map was rescaled to 12kb resolution and compared to GM12878 in Situ data from (Rao et al., 2014), corrected at 10kb and rescaled to 12kb.
Models of direct BE-to-BE interactions, bulky and stiff boundary elements
Models had the same BE positions as in the minimal model but did not include LEF dynamics. To simulate direct BE-to-BE interactions, we used an attractive soft-core potential. Contact maps were displayed for attractive strengths of 1.5, 3, and 5, and contact radius 10. For bulky BEs, several polymer chains were connected at each BE (either 3 of length 10 attached 1-per-monomer to the monomers around the BE via harmonic bonds, or 5 chains of length 6). For stiff BEs, the 10 monomers around the BE had an increased stiffness of 6, while other monomers had a stiffness of 1, as defined above. Contact maps were displayed for contact radius 10.
Supplementary Material
Highlights.
TADs can be formed by loop extrusion limited by boundary elements
Polymer simulations and genomic analyses were jointly employed to test this proposal
Proposed roles of cohesin and CTCF reconcile diverse experimental observations
Acknowledgments
MI & GF would like to thank the MIT PRIMES: Program for Research in Mathematics, Engineering, and Science for High School Students for the opportunity to supervise excellent students. This project began as Carolyn Lu’s project for the MIT PRIMES, supervised by MI and GF, and initial results were presented at the annual PRIMES conference in May 2013 (https://math.mit.edu/research/highschool/primes/materials/2013/conf/12-2-Lu.pdf). Work including detailed comparison to experimental Hi-C data was presented at conferences in Heidelberg (April, 2015) and the Weizmann institute (June, 2015). The authors thank Edith Heard, Susana Hadjur, Katerina Kraft, Elphege Nora, Francois Spitz, and other attendees of the Genome Regulation in 3D conference at the Weizmann for helpful discussions and feedback. Authors are supported by R01 GM114190 and U54 DK107980 of the 4D Nucleome Program.
Footnotes
Contributions
GF, MI, and LAM conceived of the project and wrote the paper. CL performed initial simulations. NA led ChIP-seq and motif analyses. AG led literature curation for CTCF and cohesin. MI led polymer simulations. GF led experimental data analyses and writing.
Publisher's Disclaimer: This is a PDF file of an unedited manuscript that has been accepted for publication. As a service to our customers we are providing this early version of the manuscript. The manuscript will undergo copyediting, typesetting, and review of the resulting proof before it is published in its final citable form. Please note that during the production process errors may be discovered which could affect the content, and all legal disclaimers that apply to the journal pertain.
References
- Alipour E, Marko JF. Self-organization of domain structures by DNA-loop-extruding enzymes. Nucleic Acids Res. 2012;40:11202–11212. doi: 10.1093/nar/gks925. [DOI] [PMC free article] [PubMed] [Google Scholar]
- Alt FW, Zhang Y, Meng FL, Guo C, Schwer B. Mechanisms of Programmed DNA Lesions and Genomic Instability in the Immune System. Cell. 2013;152:417–429. doi: 10.1016/j.cell.2013.01.007. [DOI] [PMC free article] [PubMed] [Google Scholar]
- Andrey G, Montavon T, Mascrez B, Gonzalez F, Noordermeer D, Leleu M, Trono D, Spitz F, Duboule D. A switch between topological domains underlies HoxD genes collinearity in mouse limbs. Science (80- ) 2013;340:1234167. doi: 10.1126/science.1234167. [DOI] [PubMed] [Google Scholar]
- Barbieri M, Chotalia M, Fraser J, Lavitas LM, Dostie J, Pombo A, Nicodemi M. Complexity of chromatin folding is captured by the strings and binders switch model. Proc Natl Acad Sci. 2012;109:16173–16178. doi: 10.1073/pnas.1204799109. [DOI] [PMC free article] [PubMed] [Google Scholar]
- Bau D, Sanyal A, Lajoie BR, Capriotti E, Byron M, Lawrence JB, Dekker J, Marti-Renom MA. The three-dimensional folding of the alpha-globin gene domain reveals formation of chromatin globules. Nat Struct Mol Biol. 2011;18:107–114. doi: 10.1038/nsmb.1936. [DOI] [PMC free article] [PubMed] [Google Scholar]
- Benedetti F, Dorier J, Burnier Y, Stasiak A. Models that include supercoiling of topological domains reproduce several known features of interphase chromosomes. Nucleic Acids Res. 2014;42:2848–2855. doi: 10.1093/nar/gkt1353. [DOI] [PMC free article] [PubMed] [Google Scholar]
- Boettiger AN, Bintu B, Moffitt JR, Wang S, Beliveau BJ, Fudenberg G, Imakaev M, Mirny LA, Wu C, Zhuang X. Super-resolution imaging reveals distinct chromatin folding for different epigenetic states. Nature. 2016 doi: 10.1038/nature16496. advance on. [DOI] [PMC free article] [PubMed] [Google Scholar]
- Bohn M, Heermann DW. Diffusion-driven looping provides a consistent framework for chromatin organization. PLoS One. 2010;5:e12218. doi: 10.1371/journal.pone.0012218. [DOI] [PMC free article] [PubMed] [Google Scholar]
- Van Bortle K, Nichols MH, Li L, Ong CT, Takenaka N, Qin ZS, Corces VG. Insulator function and topological domain border strength scale with architectural protein occupancy. Genome Biol. 2014;15:R82. doi: 10.1186/gb-2014-15-5-r82. [DOI] [PMC free article] [PubMed] [Google Scholar]
- Brackley CA, Johnson J, Kelly S, Cook PR, Marenduzzo D. Binding of bivalent transcription factors to active and inactive regions folds human chromosomes into loops, rosettes and domains. 2015 doi: 10.1093/nar/gkw135. arXiv Prepr. arXiv1511.01848. [DOI] [PMC free article] [PubMed] [Google Scholar]
- Degner SC, Verma-Gaur J, Wong TP, Bossen C, Iverson GM, Torkamani A, Vettermann C, Lin YC, Ju Z, Schulz D, et al. CCCTC-binding factor (CTCF) and cohesin influence the genomic architecture of the Igh locus and antisense transcription in pro-B cells. Proc Natl Acad Sci U S A. 2011;108:9566–9571. doi: 10.1073/pnas.1019391108. [DOI] [PMC free article] [PubMed] [Google Scholar]
- Dixon JR, Selvaraj S, Yue F, Kim A, Li Y, Shen Y, Hu M, Liu JS, Ren B. Topological domains in mammalian genomes identified by analysis of chromatin interactions. Nature. 2012;485:376–380. doi: 10.1038/nature11082. [DOI] [PMC free article] [PubMed] [Google Scholar]
- Dong J, Panchakshari Ra, Zhang T, Zhang Y, Hu J, Volpi Sa, Meyers RM, Ho Y-J, Du Z, Robbiani DF, et al. Orientation-specific joining of AID-initiated DNA breaks promotes antibody class switching. Nature. 2015 doi: 10.1038/nature14970. [DOI] [PMC free article] [PubMed] [Google Scholar]
- Doyle B, Fudenberg G, Imakaev M, Mirny LA. Chromatin loops as allosteric modulators of enhancer-promoter interactions. PLoS Comput Biol. 2014;10:e1003867. doi: 10.1371/journal.pcbi.1003867. [DOI] [PMC free article] [PubMed] [Google Scholar]
- Eastman P, Pande V. OpenMM: A Hardware-Independent Framework for Molecular Simulations. Comput Sci Eng. 2010;12 doi: 10.1109/MCSE.2010.27. [DOI] [PMC free article] [PubMed] [Google Scholar]
- Eastman P, Friedrichs MS, Chodera JD, Radmer RJ, Bruns CM, Ku JP, Beauchamp KA, Lane TJ, Wang LP, Shukla D, et al. OpenMM 4: A Reusable, Extensible, Hardware Independent Library for High Performance Molecular Simulation. J Chem Theory Comput. 2013;9:461–469. doi: 10.1021/ct300857j. [DOI] [PMC free article] [PubMed] [Google Scholar]
- Gerlich D, Koch B, Dupeux F, Peters JM, Ellenberg J. Live-cell imaging reveals a stable cohesin-chromatin interaction after but not before DNA replication. Curr Biol. 2006;16:1571–1578. doi: 10.1016/j.cub.2006.06.068. [DOI] [PubMed] [Google Scholar]
- Gibcus JH, Dekker J. The Hierarchy of the 3D Genome. Mol Cell. 2013;49:773–782. doi: 10.1016/j.molcel.2013.02.011. [DOI] [PMC free article] [PubMed] [Google Scholar]
- Giorgetti L, Galupa R, Nora EP, Piolot T, Lam F, Dekker J, Tiana G, Heard E. Predictive polymer modeling reveals coupled fluctuations in chromosome conformation and transcription. Cell. 2014;157:950–963. doi: 10.1016/j.cell.2014.03.025. [DOI] [PMC free article] [PubMed] [Google Scholar]
- Goloborodko A, Marko JF, Mirny L. Mitotic chromosome compaction via active loop extrusion. 2015 doi: 10.1016/j.bpj.2016.02.041. bioRxiv 21642. [DOI] [PMC free article] [PubMed] [Google Scholar]
- Goloborodko AA, Imakaev M, Marko J, Mirny L. Compaction and segregation of sister chromatids via active loop extrusion. 2016 doi: 10.7554/eLife.14864. bioRxiv. [DOI] [PMC free article] [PubMed] [Google Scholar]
- Gorkin DU, Leung D, Ren B. The 3D Genome in Transcriptional Regulation and Pluripotency. Cell Stem Cell. 2014;14:762–775. doi: 10.1016/j.stem.2014.05.017. [DOI] [PMC free article] [PubMed] [Google Scholar]
- Gruber S. Multilayer chromosome organization through DNA bending, bridging and extrusion. Curr Opin Microbiol. 2014;22:102–110. doi: 10.1016/j.mib.2014.09.018. [DOI] [PubMed] [Google Scholar]
- Guacci V, Yamamoto a, Strunnikov a, Kingsbury J, Hogan E, Meluh P, Koshland D. Structure and function of chromosomes in mitosis of budding yeast. Cold Spring Harb Symp Quant Biol. 1993;58:677–685. doi: 10.1101/sqb.1993.058.01.075. [DOI] [PubMed] [Google Scholar]
- Guo Y, Xu Q, Canzio D, Shou J, Li J, Gorkin DU, Jung I, Wu H, Zhai Y, Tang Y, et al. CRISPR Inversion of CTCF Sites Alters Genome Topology and Enhancer/Promoter Function. Cell. 2015;162:900–910. doi: 10.1016/j.cell.2015.07.038. [DOI] [PMC free article] [PubMed] [Google Scholar]
- Hara K, Zheng G, Qu Q, Liu H, Ouyang Z, Chen Z, Tomchick DR, Yu H. Structure of cohesin subcomplex pinpoints direct shugoshin-Wapl antagonism in centromeric cohesion. Nat Struct Mol Biol. 2014;21:864–870. doi: 10.1038/nsmb.2880. [DOI] [PMC free article] [PubMed] [Google Scholar]
- Hofmann A, Heermann DW. The role of loops on the order of eukaryotes and prokaryotes. FEBS Lett. 2015 doi: 10.1016/j.febslet.2015.04.021. [DOI] [PubMed] [Google Scholar]
- Hou C, Zhao H, Tanimoto K, Dean A. CTCF-dependent enhancer-blocking by alternative chromatin loop formation. Proc Natl Acad Sci U S A. 2008;105:20398–20403. doi: 10.1073/pnas.0808506106. [DOI] [PMC free article] [PubMed] [Google Scholar]
- Imakaev M, Fudenberg G, McCord RP, Naumova N, Goloborodko A, Lajoie BR, Dekker J, Mirny LA. Iterative correction of Hi-C data reveals hallmarks of chromosome organization. Nat Methods. 2012;9:999–1003. doi: 10.1038/nmeth.2148. [DOI] [PMC free article] [PubMed] [Google Scholar]
- Imakaev MV, Fudenberg G, Mirny LA. Modeling chromosomes: Beyond pretty pictures. FEBS Lett. 2015;589:3031–3036. doi: 10.1016/j.febslet.2015.09.004. [DOI] [PMC free article] [PubMed] [Google Scholar]
- Jost D, Carrivain P, Cavalli G, Vaillant C. Modeling epigenome folding: formation and dynamics of topologically associated chromatin domains. Nucleic Acids Res. 2014:1–9. doi: 10.1093/nar/gku698. [DOI] [PMC free article] [PubMed] [Google Scholar]
- Kadauke S, Blobel GA. Mitotic bookmarking by transcription factors. Epigenetics Chromatin. 2013;6:6. doi: 10.1186/1756-8935-6-6. [DOI] [PMC free article] [PubMed] [Google Scholar]
- Kagey MH, Newman JJ, Bilodeau S, Zhan Y, Orlando DA, van Berkum NL, Ebmeier CC, Goossens J, Rahl PB, Levine SS, et al. Mediator and cohesin connect gene expression and chromatin architecture. Nature. 2010;467:430–435. doi: 10.1038/nature09380. [DOI] [PMC free article] [PubMed] [Google Scholar]
- Kheradpour P, Kellis M. Systematic discovery and characterization of regulatory motifs in ENCODE TF binding experiments. Nucleic Acids Res. 2014;42:2976–2987. doi: 10.1093/nar/gkt1249. [DOI] [PMC free article] [PubMed] [Google Scholar]
- Lajoie BR, Dekker J, Kaplan N. The Hitchhiker’s Guide to Hi-C Analysis: Practical guidelines. Methods. 2014;72:65–75. doi: 10.1016/j.ymeth.2014.10.031. [DOI] [PMC free article] [PubMed] [Google Scholar]
- Le TBK, Imakaev MV, Mirny LA, Laub MT. High-Resolution Mapping of the Spatial Organization of a Bacterial Chromosome. Science (80- ) 2013;342:731–734. doi: 10.1126/science.1242059. [DOI] [PMC free article] [PubMed] [Google Scholar]
- Lieberman-Aiden E, van Berkum NL, Williams L, Imakaev M, Ragoczy T, Telling A, Amit I, Lajoie BR, Sabo PJ, Dorschner MO, et al. Comprehensive Mapping of Long-Range Interactions Reveals Folding Principles of the Human Genome. Science (80- ) 2009;326:289–293. doi: 10.1126/science.1181369. [DOI] [PMC free article] [PubMed] [Google Scholar]
- Lin SG, Guo C, Su A, Zhang Y, Alt FW. CTCF-binding elements 1 and 2 in the Igh intergenic control region cooperatively regulate V(D)J recombination. Proc Natl Acad Sci. 2015;112:1815–1820. doi: 10.1073/pnas.1424936112. [DOI] [PMC free article] [PubMed] [Google Scholar]
- Lupiáñez DG, Kraft K, Heinrich V, Krawitz P, Brancati F, Klopocki E, Horn D, Kayserili H, Opitz JM, Laxova R, et al. Disruptions of Topological Chromatin Domains Cause Pathogenic Rewiring of Gene-Enhancer Interactions. Cell. 2015;161:1012–1025. doi: 10.1016/j.cell.2015.04.004. [DOI] [PMC free article] [PubMed] [Google Scholar]
- Marko JF, Siggia ED. Polymer models of meiotic and mitotic chromosomes. Mol Biol Cell. 1997;8:2217–2231. doi: 10.1091/mbc.8.11.2217. [DOI] [PMC free article] [PubMed] [Google Scholar]
- Mizuguchi T, Fudenberg G, Mehta S, Belton JM, Taneja N, Folco HD, FitzGerald P, Dekker J, Mirny L, Barrowman J, et al. Cohesin-dependent globules and heterochromatin shape 3D genome architecture in S. pombe. Nature. 2014;516:432–435. doi: 10.1038/nature13833. [DOI] [PMC free article] [PubMed] [Google Scholar]
- Nakahashi H, Kwon KR, Resch W, Vian L, Dose M, Stavreva D, Hakim O, Pruett N, Nelson S, Yamane A, et al. A Genome-wide Map of CTCF Multivalency Redefines the CTCF Code. Cell Rep. 2013;3:1678–1689. doi: 10.1016/j.celrep.2013.04.024. [DOI] [PMC free article] [PubMed] [Google Scholar]
- Narendra V, Rocha PP, An D, Raviram R, Skok JA, Mazzoni EO, Reinberg D. CTCF establishes discrete functional chromatin domains at the Hox clusters during differentiation. Science (80- ) 2015;347:1017–1021. doi: 10.1126/science.1262088. [DOI] [PMC free article] [PubMed] [Google Scholar]
- Nasmyth K. Disseminating the genome: joining, resolving, and separating sister chromatids during mitosis and meiosis. Annu Rev Genet. 2001;35:673–745. doi: 10.1146/annurev.genet.35.102401.091334. [DOI] [PubMed] [Google Scholar]
- Naughton C, Avlonitis N, Corless S, Prendergast JG, Mati IK, Eijk PP, Cockroft SL, Bradley M, Ylstra B, Gilbert N. Transcription forms and remodels supercoiling domains unfolding large-scale chromatin structures. Nat Struct Mol Biol. 2013;20:387–395. doi: 10.1038/nsmb.2509. [DOI] [PMC free article] [PubMed] [Google Scholar]
- Naumova N, Imakaev M, Fudenberg G, Zhan Y, Lajoie BR, Mirny LA, Dekker J. Organization of the mitotic chromosome. Science. 2013;342:948–953. doi: 10.1126/science.1236083. [DOI] [PMC free article] [PubMed] [Google Scholar]
- Nichols MH, Corces VG. A CTCF Code for 3D Genome Architecture. Cell. 2015;162:703–705. doi: 10.1016/j.cell.2015.07.053. [DOI] [PMC free article] [PubMed] [Google Scholar]
- Nishiyama T, Ladurner R, Schmitz J, Kreidl E, Schleiffer A, Bhaskara V, Bando M, Shirahige K, Hyman AA, Mechtler K, et al. Sororin mediates sister chromatid cohesion by antagonizing Wapl. Cell. 2010;143:737–749. doi: 10.1016/j.cell.2010.10.031. [DOI] [PubMed] [Google Scholar]
- Nolen LD, Boyle S, Ansari M, Pritchard E, Bickmore WA. Regional chromatin decompaction in cornelia de lange syndrome associated with NIPBL disruption can be uncoupled from cohesin and CTCF. Hum Mol Genet. 2013;22:4180–4193. doi: 10.1093/hmg/ddt265. [DOI] [PMC free article] [PubMed] [Google Scholar]
- Nora EP, Lajoie BR, Schulz EG, Giorgetti L, Okamoto I, Servant N, Piolot T, van Berkum NL, Meisig J, Sedat J, et al. Spatial partitioning of the regulatory landscape of the X-inactivation centre. Nature. 2012;485:381–385. doi: 10.1038/nature11049. [DOI] [PMC free article] [PubMed] [Google Scholar]
- Parelho V, Hadjur S, Spivakov M, Leleu M, Sauer S, Gregson HC, Jarmuz A, Canzonetta C, Webster Z, Nesterova T, et al. Cohesins Functionally Associate with CTCF on Mammalian Chromosome Arms. Cell. 2008;132:422–433. doi: 10.1016/j.cell.2008.01.011. [DOI] [PubMed] [Google Scholar]
- Peterson CL. The SMC family: novel motor proteins for chromosome condensation? Cell. 1994;79:389–392. doi: 10.1016/0092-8674(94)90247-x. [DOI] [PubMed] [Google Scholar]
- Quinlan AR, Hall IM. BEDTools: a flexible suite of utilities for comparing genomic features. Bioinformatics. 2010;26:841–842. doi: 10.1093/bioinformatics/btq033. [DOI] [PMC free article] [PubMed] [Google Scholar]
- Rao SSP, Huntley MH, Durand NC, Stamenova EK, Bochkov ID, Robinson JT, Sanborn AL, Machol I, Omer AD, Lander ES, et al. A 3D Map of the Human Genome at Kilobase Resolution Reveals Principles of Chromatin Looping. Cell. 2014;159:1665–1680. doi: 10.1016/j.cell.2014.11.021. [DOI] [PMC free article] [PubMed] [Google Scholar]
- Rosa A, Everaers R. Structure and dynamics of interphase chromosomes. PLoS Comput Biol. 2008;4:e1000153. doi: 10.1371/journal.pcbi.1000153. [DOI] [PMC free article] [PubMed] [Google Scholar]
- Rosa A, Becker NB, Everaers R. Looping probabilities in model interphase chromosomes. Biophys J. 2010;98:2410–2419. doi: 10.1016/j.bpj.2010.01.054. [DOI] [PMC free article] [PubMed] [Google Scholar]
- Rudan MV, Barrington C, Henderson S, Ernst C, Odom DT, Tanay A, Hadjur S. Comparative Hi-C reveals that CTCF underlies evolution of chromosomal domain architecture. Cell Rep. 2015;10:1297–1309. doi: 10.1016/j.celrep.2015.02.004. [DOI] [PMC free article] [PubMed] [Google Scholar]
- Sanborn AL, Rao SSP, Huang SC, Durand NC, Huntley MH, Jewett AI, Bochkov ID, Chinnappan D, Cutkosky A, Li J, et al. Chromatin extrusion explains key features of loop and domain formation in wild-type and engineered genomes. Proc Natl Acad Sci. 2015;112:201518552. doi: 10.1073/pnas.1518552112. [DOI] [PMC free article] [PubMed] [Google Scholar]
- Scolari VF, Lagomarsino MC. Combined collapse by bridging and self-adhesion in a prototypical polymer model inspired by the bacterial nucleoid. Soft Matter. 2015;11:1677–1687. doi: 10.1039/c4sm02434f. [DOI] [PubMed] [Google Scholar]
- Sexton T, Yaffe E, Kenigsberg E, Bantignies F, Leblanc B, Hoichman M, Parrinello H, Tanay A, Cavalli G. Three-dimensional folding and functional organization principles of the Drosophila genome. Cell. 2012;148:458–472. doi: 10.1016/j.cell.2012.01.010. [DOI] [PubMed] [Google Scholar]
- Sofueva S, Yaffe E, Chan WC, Georgopoulou D, Vietri Rudan M, Mira-Bontenbal H, Pollard SM, Schroth GP, Tanay A, Hadjur S. Cohesin-mediated interactions organize chromosomal domain architecture. EMBO J. 2013;32:3119–3129. doi: 10.1038/emboj.2013.237. [DOI] [PMC free article] [PubMed] [Google Scholar]
- Symmons O, Uslu VV, Tsujimura T, Ruf S, Nassari S, Schwarzer W, Ettwiller L, Spitz F. Functional and topological characteristics of mammalian regulatory domains. Genome Res. 2014;24:390–400. doi: 10.1101/gr.163519.113. [DOI] [PMC free article] [PubMed] [Google Scholar]
- Tedeschi A, Wutz G, Huet S, Jaritz M, Wuensche A, Schirghuber E, Davidson IF, Tang W, Cisneros Da, Bhaskara V, et al. Wapl is an essential regulator of chromatin structure and chromosome segregation. Nature. 2013;501:564–568. doi: 10.1038/nature12471. [DOI] [PMC free article] [PubMed] [Google Scholar]
- Ulianov SV, Khrameeva EE, Gavrilov AA, Flyamer IM, Kos P, Mikhaleva EA, Penin AA, Logacheva MD, Imakaev MV, Chertovich A, et al. Active chromatin and transcription play a key role in chromosome partitioning into topologically associating domains. Genome Res. 2015;26:70–84. doi: 10.1101/gr.196006.115. [DOI] [PMC free article] [PubMed] [Google Scholar]
- Wang X, Le TBK, Lajoie BR, Dekker J, Laub MT, Rudner DZ. Condensin promotes the juxtaposition of DNA flanking its loading site in Bacillus subtilis. Genes Dev. 2015;29:1661–1675. doi: 10.1101/gad.265876.115. [DOI] [PMC free article] [PubMed] [Google Scholar]
- Williamson I, Berlivet S, Eskeland R, Boyle S, Illingworth RS, Paquette D, Dostie J, Bickmore WA. Spatial genome organization: contrasting views from chromosome conformation capture and fluorescence in situ hybridization. Genes Dev. 2014;28:2778–2791. doi: 10.1101/gad.251694.114. [DOI] [PMC free article] [PubMed] [Google Scholar]
- de Wit E, Vos ESM, Holwerda SJB, Valdes-Quezada C, Verstegen MJAM, Teunissen H, Splinter E, Wijchers PJ, Krijger PHL, de Laat W. CTCF Binding Polarity Determines Chromatin Looping. Mol Cell. 2015;60:676–684. doi: 10.1016/j.molcel.2015.09.023. [DOI] [PubMed] [Google Scholar]
- Xiao T, Wallace J, Felsenfeld G. Specific sites in the C terminus of CTCF interact with the SA2 subunit of the cohesin complex and are required for cohesin-dependent insulation activity. Mol Cell Biol. 2011;31:2174–2183. doi: 10.1128/MCB.05093-11. [DOI] [PMC free article] [PubMed] [Google Scholar]
- Yaffe E, Tanay A. Probabilistic modeling of Hi-C contact maps eliminates systematic biases to characterize global chromosomal architecture. Nat Genet. 2011;43:1059–1065. doi: 10.1038/ng.947. [DOI] [PubMed] [Google Scholar]
- Zuin J, Dixon JR, van der Reijden MIJa, Ye Z, Kolovos P, Brouwer RWW, van de Corput MPC, van de Werken HJG, Knoch Ta, van IJcken WFJ, et al. Cohesin and CTCF differentially affect chromatin architecture and gene expression in human cells. Proc Natl Acad Sci U S A. 2014;111:996–1001. doi: 10.1073/pnas.1317788111. [DOI] [PMC free article] [PubMed] [Google Scholar]
Associated Data
This section collects any data citations, data availability statements, or supplementary materials included in this article.