

Abstract
We proposed a method for automatic detection of cervical cancer cells in images captured from thin liquid based cytology slides. We selected 20,000 cells in images derived from 120 different thin liquid based cytology slides, which include 5000 epithelial cells (normal 2500, abnormal 2500), lymphoid cells, neutrophils, and junk cells. We first proposed 28 features, including 20 morphologic features and 8 texture features, based on the characteristics of each cell type. We then used a two-level cascade integration system of two classifiers to classify the cervical cells into normal and abnormal epithelial cells. The results showed that the recognition rates for abnormal cervical epithelial cells were 92.7% and 93.2%, respectively, when C4.5 classifier or LR (LR: logical regression) classifier was used individually; while the recognition rate was significantly higher (95.642%) when our two-level cascade integrated classifier system was used. The false negative rate and false positive rate (both 1.44%) of the proposed automatic two-level cascade classification system are also much lower than those of traditional Pap smear review.
1. Introduction
According to the statistics of WHO (World Health Organization), there were 530,000 new cases in the world in 2012 and it caused the second highest mortality rate in cancers of female patients. More than 270,000 females died from cervical cancer every year in the world, more than 85% of which occurred in the developing countries [1]. The screening of cervical cancers in the developing countries encountered serious difficulties, due to backward economy and poor condition. The incidence of cervical cancer is 6 times higher in the developing countries than in developed countries. Therefore, there is an urgent need to develop a screening method that is appropriate for the developing countries.
Cervical cancer is typically diagnosed by the liquid based cytology (LBC) slides followed by pathologist review. This method overcomes the problem of fuzzy background, cell overlap, and uneven staining of traditional methods and improves the sensitivity of screening [2]. However, the human review of the slides carries the price of large screening volume, high cost, and dependence of the reliability and accuracy on the reviewers' skill and experience. These factors reduced the accuracy of the screening method and resulted in relatively high false positive (~10%) or false negative rates (~20%) [3].
Automatic and semiautomatic methods have been used to identify abnormal cells from the slides by analyzing the contours of the cells [4–9]. Automatic analysis method of cervical cell images has recently been developed and is used to detect cervical cancers and has been intensively studied and improved. In this method, the cells are smeared on the slides, from which images were obtained by cameras of industrial quality. The images are then analyzed to look for abnormal cells. This method has the benefit of saving huge resources of mankind and materials and greatly improved the efficiency of screening, reduced human errors, and enhanced the accuracy of the screening. The acquirement of cell features, design of cell classification system, and the classification of the cells play critical roles in this method. In this study, these three important aspects were investigated.
Different classification systems of cervical smear cells have recently been proposed [6, 10–13]. Chen et al. [6] proposed classifying the cells into superficial cells, intermediate cells, parabasal cells, low-grade squamous intraepithelial lesion, and high-grade squamous intraepithelial lesion (HSIL). Rahmadwati et al. [10, 11] classified all the cervical cells into normal, premalignant, and malignant categories. In another study [11], the premalignant stage was further divided into CIN1 (carcinoma in situ 1), CIN2, and CIN3. Rajesh Kumar et al. [12] classified the cervical cells into two types of cells, normal and abnormal cervical cells. Sarwar et al. [13] divided the cells into three normal cells (superficial squamous epithelial, intermediate squamous epithelial, and columnar epithelial), and four abnormal cells (mild squamous nonkeratinizing dysplasia, moderate squamous nonkeratinizing dysplasia, severe squamous nonkeratinizing dysplasia, and moderate squamous cell carcinoma in situ). These classification systems are still in the stage of research. No system has been finalized as the method for clinical practice. Since the Pap smears are usually contaminated by blood and lymphoid tissues, the method of directly classifying the squamous cells into normal and abnormal cells is not appropriate for the classification of cervical smears.
In regard to the acquirement of cell features, most of the researchers used multidimensional features to classify the cells [12, 14–16]. Some authors analyzed four parameters: area, integrated optical density (IOD), eccentricity, and Fourier coefficients [12]. Other authors used 16 features: area of nucleus, area of cytoplasm, nuclear gray level, cytoplasm's gray level, and so forth [14]. Some authors acquired nine parameters: mean intensity, variance, number of concave points, area, area ratio, perimeter, roundness, entropy, and intensity ratio [15]. Finally, some other authors used 27 parameters, which included contrast, energy, correlation, and homogeneity [16]. Most of these parameters were obtained through computers. It remains to be studied which parameters are more appropriate for cell classification.
In the recent years, the method of multiclassifier integration is the focus of the study for pattern recognition and has been applied to some areas of biological feature recognition [17–19]. In one study [18], neural network classification system based on two-level cascade system has been used to recognize lung cancer cells and has decreased the error rate of single classifier network. In another study [19], two-dimensional cascaded AdaBoost framework was used for eye localization. From these pioneer studies, it is known that the method of classifier integration could help to enhance the sensitivity in comparison to a traditional single classifier.
We hereby proposed the following novel ideas for automatic analysis method of cervical cell images: (1) Feature extraction: obtaining 28 dimensional features including nuclear area and contrast, 20 morphologic, and 8 textural features, based on the difference in cell morphology or cell density. (2) Cell classification: first separating the cells into epithelial cells, lymphoid cells, neutrophils, and junk cell and then classifying the epithelial cells into normal and abnormal cells. (3) Method of classification: classification of cervical cells by two-level cascade. The cells are first classified by fast and rough C4.5 classifier and then by more accurate LR classifier into normal and abnormal cells.
2. The Methods
2.1. The Workflow of the Automatic Detection System
The main components of automatic analysis method of cervical cell images include high quality digital camera, computer, three-dimensional moving stage, microscope, and the auxiliary cell analysis equipment. The workflow is shown as Figure 1. The first level classification or rough classification includes acquirement of cell images, image preprocessing, cell nuclei and background segmentation by appropriate cutoff, measurement and analysis of cell morphology, and optical density and textural features, by the cell assessment and classifying function of C4.5. The second level classification or detailed classification includes extraction of similar features as in Step 1 and usage of LR classifier to classify the cells into normal and abnormal epithelial cells.
Figure 1.

Flowchart of the Automatic Detection System.
2.2. Acquirement of Cell Images
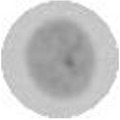
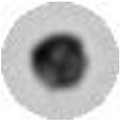
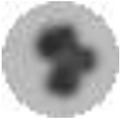
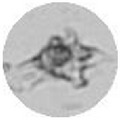
Pap smear has served important functions in cervical cancer screening for the past half century. But it has high requirements on the cell smear and has high false positive rate [20]. In contrast, the technology of liquid based cytology cell analysis showed higher smear quality and sensitivity [21] and reduced the false positive rate and is the most common method of smear preparation. The cervical cancer development is usually accompanied by the nuclear abnormality of the cells. Therefore, we used Feulgen-thionin staining method to make thin liquid based cell smear as shown in Figure 2 and then analyze the smears using automatic analysis method of cervical cell images.
Figure 2.

The nuclei after thin liquid based cytology. (a) Sample image 1. (b) Sample image 2. (c) Sample image 3. (d) Sample image 4.
Automatic detection method of cervical cell images acquired cell image though high quality camera (IDS UI-3370CP-C-HQ) on the microscope (Olympus BX43) and saved them as of a 300∗300 resolution images in .jpg format with 8-bit gray depth, then divided the image into 332 areas with each area containing 200–400 cells, and separated and analyzed the cells in each area. Based on the opinions of pathologists and cytotechnologists, we then selected 20,000 cells in images derived from 120 different thin liquid based cytology slides, which included epithelial cells (normal 2500, abnormal 2500), lymphoid cells, neutrophils, and junk cells.
2.3. Image Preprocessing and Segmentation
Due to various limitations and interference, there is always reduction in quality during smear making, image acquirement, image transfer, and conversion, such as uneven staining, uneven lightness, noise during transfer, and loss of original quality during conversion. Therefore, it is necessary to do some preprocessing of the images before cell segmentation to assure the accuracy of the analysis [22, 23].
We studied the image enhancement and the noise reduction in cervical cell image analysis. To enhance the image, we stored some of the details of the images before histogram equalization and then restored the details while doing histogram equalization. This method increased the contrast between the cells and the background, made the cell borders stand out, and enhanced the local contrast of the image by removing or reducing the nonrelevant information [4, 24]. To reduce the noise, the median filter method [25, 26] was used in the study to first rank the pixels in the areas according to the degree of grayness from low to high and then select the median value as the output pixel. This was a nonlinear smoothing filtering technology, which could not only inhibit pulse pepper and salt noise, but also protect the image border well.
Cell images segmentation is an important step in the automatic cell recognition. It determines if the cell nuclear morphology will match the original cells and will influence the accuracy of the feature parameters and the sensitivity of the system. The adaptive threshold segmentation method used in this study is a simple but effective method. It determined the best segmentation cutoff by the features and distribution of the peak and bottom of the histogram equalization curve, to separate the nuclei from the background [27, 28]. This method is not only simple and fast in calculation, but also effective in dealing with images with big difference in local background grayness in the targeted areas.
2.4. Extraction of Features
The selection of cell features and calculation are the essential steps in cell recognition. There is always contamination of the cervical specimens by lymphoid cells, blood, and junk cells. Based on literature suggestions and different features in cell nuclei, we select 28 features, including 20 morphologic features and 8 texture features.
2.4.1. Morphologic Features
Morphologic features were used to describe the shape of the nucleus, which was important to distinguish between different cell types. According to the different morphology of the nucleus, we extracted 28 morphologic features, including area [12, 15, 29], Circularity, Distance, Sigma, Sides, Roundness, Convexity [29], I a (centroid coordinates of x-axis), I b (centroid coordinates of y-axis), M 11, M 02, M 20, Compactness [29], Count-Length [30], Diameter [30], Radius [29, 30], Rectangularity [30], Anisometry [31], Bulkiness [32], and Structure-Factor [33].
After the cells become malignant, the number of chromosomes in the nucleus will change, leading to changes in the shape of the nucleus. As a result, the nuclear circularity and the roundness will also change. The roundness examines the distance between the border and the center of the area, which can be expressed as
| (1) |
where Sigma indicates the deviation from the mean distance and Distance indicates the mean distance, which can be defined as
| (2) |
| (3) |
g 0 is the mean values of pixel in the area of cell and g (x, y) is the pixel value of dot (x, y) in the area of cell.
Since the calculation of roundness is associated with the number of sides of equilateral polygons, the number of sides can be used to estimate the roundness roughly. The more sides the equilateral polygon has, the rounder the nucleus is. Sides are defined as
| (4) |
Circularity is used to calculate the similarity of the nuclear region with a circle and can be expressed as (5), where P is the perimeter:
| (5) |
With the transformation of the shape, size, and location of the image, centroid coordinates will change. Centroid coordinates (I a, I b) can be used to estimate the geometric transformation of the images, which can be expressed as
| (6) |
M 20 and M 02 separately represent the sum of the pixel values of x- and y-axis of the nucleus. M 11 represents the mean values of every pixel in the nucleus. h was defined in
| (7) |
2.4.2. Texture Features
Textural features are the repeated textural units and their patterns of presence. The extraction of textual features is to convert the three-dimensional difference of random texture or geometric texture into the differences in the values of grayness and then use mathematical models to describe the texture information. Symbiotic matrix is an important method in the analysis of the texture features of the images. It represents the combined information of direction, distance, the degree, and the speed of the change of the images, by calculating the relationship of the distance and direction between two points of grayness in the image.
There are 14 dimensional features in the symbiotic matrix proposed by Haralick et al. [34]. The features used by us include Contrast [16, 30], Energy [16, 30], Correlation [16, 30], Homogeneity [16], Entropy [15, 30], Anisotropy [35], Mean, and Deviation.
Mean is used to represent the mean gray values of the nucleus, which can be defined by
| (8) |
g(x, y) is the gray values of the pixel (x, y). Num denotes the number of pixels of images.
The deviation is used to represent the deviation of gray values of the nucleus, which can be represented by
| (9) |
2.5. The Two-Level Cascade Classifier Integration
The false classifications produced by different classifiers usually do not overlap when you analyze the multidimension features of the same entity. It indicates that different classifiers might be complementary in information and might be used to enhance the capability of detection. Single classifier is prone to make incorrect classification or miss the classification, resulting in reduced accuracy of the classification. On the other hand, combing different classifier can achieve higher capability in classification by making using of their complementary information.
The integration method of combing multiple classifiers can be cascade or parallel. In the cascade method, the output of the previous classifier is used as the input of the next classifier, with each classifier having its own model of feature extraction and model of classification. After analyzing the C4.5 classifier and the LR classifier, we used two-level cascade integration system, that is, another step of classification on the cells that are difficult to classify by C4.5 classifier. In this way, we achieved higher sensitivity of recognition. The flowchart is shown in Figure 3.
Figure 3.

Flowchart of the two-level classification system.
The level 1 classification is rough classification and can use fast classifier such as C4.5 to classify the cervical cells into epithelial cells, lymphoid cells, neutrophils, or junk cells. In level 2 classification, the epithelial cells from level 1 classification are further classified into normal and abnormal cells by logic regression classifier with high accuracy.
Every child classifier will give its accuracy, but the final rejection rate is determined by the last output. Therefore, the accuracy and the false rate of each child are independent and do not affect each other. The accuracy and the false rate of the whole system are shown in
| (10) |
| (11) |
In these equations, c i and w i separately represent the rate of correct recognition and rate of incorrect recognition. Therefore, the function of the integrated system is dependent on the capability of every step, especially the rate of incorrect recognition of the first few steps. In ideal situation, the rate of incorrect recognition of every step is 0. Even if the rate of correct recognition of every step is not high, the final rate of correct recognition will approach 1, as the steps increase.
2.6. Assessment Functions
The classifications are evaluated with four parameters. Their accuracy is shown in (12), precision rate in (13), recall rate in (14), and F-measure in (15):
| (12) |
| (13) |
| (14) |
| (15) |
In these equations, TN represents true negatives, TP true positions, FN false negatives, and FP false positive. F is the assessment parameter when α = 1 in (15).
3. The Results
In this study, we selected 20,000 cells, including 2500 abnormal epithelial cells, from 120 different thin liquid based cytology slides based on the cell features and the opinions of the pathologists. During the procedure of cervical specimen collection, not only epithelial cells, but also lymphoid cells, blood, and other contaminants were also collected, which results in reduced recognition rate of these cells. Therefore, direct classification of these five groups of cells is not very helpful to identify the abnormal epithelial cells. So we separated the experiment into two steps to identify the abnormal epithelial cells. In the first step, the cells were separated into epithelial cells, lymphoid cells, neutrophils, and junk cells. In Step 2, we separated the epithelial cells into normal and abnormal epithelial cells.
3.1. Image Preprocessing and Segmentation
The purpose of image preprocessing is to reduce the complexity of the image data and to prepare for the analysis in the following steps. To reduce the influence of interference to the image analysis, we used the method of histogram equalization to enhance the image and median value filtering to remove the noise. The results are shown in Figure 4(b). The image segmentation is the process to isolate the image into characteristic areas and select the areas we need for analysis. This step would directly affect the feasibility and the reliability of the next steps. We used the method of adaptive threshold for image segmentation, the results of which are shown in Figure 4(c).
Figure 4.

The results of image preprocessing and segmentation. (a) The original image. (b) The image after preprocessing. (c) The image after segmentation.
As can be seen in Figure 4, the method we used can effectively reduce the noise and retain the borders of the image. It also shows that the method of segmentation can effectively select out the target areas.
3.2. Feature Extraction
The relevant cell features extracted after image segmentation provide the information for automatic image analysis. Therefore, the extracted features should adequately reflect the differences of normal and abnormal epithelial cells. In this study, we extracted 28 morphologic and texture features, which are shown in Table 1.
Table 1.
Example morphologic and texture features of the nuclei of different type of cells.
| Step 1 classification | Step 2 classification | |||||
|---|---|---|---|---|---|---|
| Cell type | Epithelial cells | Lymphoid cells | Neutrophils cells | Junk cells | Normal epithelial cells | Abnormal epithelial cells |
| Cell image |
|
|
|
|
|
|
| Area (μm2) | 1071 | 403 | 342 | 972 | 538 | 2455 |
| Circularity | 0.843519 | 0.916002 | 0.765056 | 0.300962 | 0.753142 | 0.997429 |
| Distance | 17.397 | 10.2599 | 9.30611 | 15.8119 | 12.0604 | 26.8547 |
| Sigma | 1.16761 | 0.546327 | 1.61327 | 5.60155 | 1.2382 | 0.346338 |
| Roundness | 0.932884 | 0.946751 | 0.826644 | 0.645737 | 0.897334 | 0.987103 |
| Sides | 5.05552 | 5.63962 | 3.22911 | 2.30386 | 4.1358 | 11.0196 |
| Mean | 158.233 | 79.5434 | 100.567 | 128.506 | 117.796 | 123.245 |
| Deviation | 6.99297 | 41.8068 | 39.1483 | 28.4216 | 29.373 | 37.8975 |
| Energy | 0.0744681 | 0.00502435 | 0.00584795 | 0.0033976 | 0.00580941 | 0.0416018 |
| Correlation | 0.872788 | 0.891784 | 0.901872 | 0.852879 | 0.937312 | 0.93632 |
| Homogeneity | 0.716823 | 0.301341 | 0.281612 | 0.258799 | 0.368374 | 0.574155 |
| Contrast | 0.868347 | 25.5558 | 19.7018 | 15.9352 | 7.09665 | 12.4264 |
| Convexity | 0.97541 | 0.975787 | 0.914439 | 0.675939 | 0.967626 | 0.983574 |
| M 11 | 5434.79 | −84.2779 | 1278.93 | 952.484 | 1756.51 | −601.93 |
| M 20 | 105447 | 13084.7 | 12303.9 | 72230.5 | 18714 | 480713 |
| M 02 | 79455.2 | 12887.3 | 7861.95 | 131805 | 28798.7 | 478728 |
| I a | 106538 | 13115.8 | 12645.8 | 131821 | 29095.8 | 480881 |
| I b | 78364.5 | 12856.2 | 7520.04 | 72215.2 | 18416.8 | 478559 |
| Entropy | 4.58423 | 6.75867 | 6.62043 | 6.56861 | 6.61984 | 5.98287 |
| Anisotropy | −0.549074 | −0.484435 | −0.478508 | −0.533538 | −0.523816 | −0.640747 |
| Compactness | 1.1056 | 1.04565 | 1.30927 | 5.38011 | 1.11106 | 1.10762 |
| ContLength (μm) | 121.983 | 72.7696 | 75.0122 | 256.35 | 86.669 | 184.853 |
| Diameter (μm) | 39.3954 | 23.2594 | 23.7697 | 57.8705 | 29.4279 | 55.9464 |
| Radius (μm) | 16.5 | 10.5 | 7 | 9 | 11.5 | 27 |
| Rectangularity | 0.809384 | 0.826425 | 0.760234 | 0.579734 | 0.77907 | 0.807594 |
| Anisometry | 1.16598 | 1.01004 | 1.29677 | 1.35107 | 1.25692 | 1.00242 |
| Bulkiness | 1.00102 | 1.00474 | 1.04771 | 1.29773 | 1.00501 | 1.00022 |
| Structure-Factor | 0.16717 | 0.0148302 | 0.358639 | 0.753318 | 0.263212 | 0.002.63965 |
3.3. The Classification of the Cells
In the process of specimen collection, epithelial cells, lymphoid cells, blood, and other contaminants were also collected. It is difficult to achieve satisfactory classification if a single classifier is used. The combination of multiple classifiers can overcome the weakness of a single classifier, make full use of each classifier's strength, and reduce the recognition error rate and increase the recognition robustness [14, 36, 37]. The following is the workflow of the two-level cascade integration system.
Step 1 (rough classification). —
In Step 1 classification, or rough classification, we separated the cells into four groups of cells, which are epithelial cells, lymphoid cells, neutrophils, and junk cells. We used the parameters best for classification to build C4.5 classifier. Confusion matrix shows the relationship between the predicted cell type and the original cell type and further calculates the error rate and precision. The values in normalization confusion matrix represent the percentages. We used C4.5 classifier in the Step 1 classification. The assessment results on the precision of the classification using confusion matrix are shown in Figure 5.
As can be seen in Figure 5, the lymphoid cells are easy to recognize because of the stability of their nuclei. The stability of the neutrophils is less, so its recognition rate was in the middle. The junk cells in the image are contaminants in the specimen collection process, the debris from smear making process, or cell overlap and showed low nuclear stability and therefore had low recognition rate. Epithelial cells including normal cells and abnormal epithelial cells had less nuclear stability and also lower recognition rate.
Even though confusion matrix can indicate the correct recognition rate of every type of cells, it cannot directly tell the overall correctness, precision, recall, F-measures, and so forth. Table 2 shows the results of Step 1 classification. Naïve Bayesian (NB) classifier built from the best parameters is used as the reference group.
As can be seen in Table 2, C4.5 classification is better than NB classifier in accuracy, precision, recall, and F-measure. This also indicates that our method of fist classifying the cells into 4 groups is more appropriate for cervical cells. The precision, recall, and F-measure of C4.5 are around 96%, while the precision and recall of NB classifier are worse. There is also influence on the F-measure.
Figure 5.
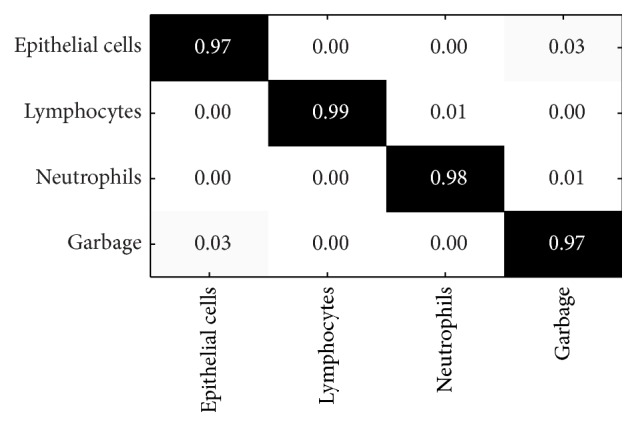
The confusion matrix of the percentages of correct recognition. x-axis represents the predicted cell types. y-axis is correct cell types. The values in black are the percentages of correct recognition. The values in grey are the percentages of incorrect recognition.
Table 2.
The accuracy of the four types of cells and the precision, the recall rate, and the F-measure of epithelial cells, from Step 1 classification.
| Type | Assessment | NB | C4.5 | P value |
|---|---|---|---|---|
| 4 types of cells | Accuracy | 92.065% (18413/20000) | 97.185% (19237/20000) | 0.0001 |
|
| ||||
| Epithelial cells | Precision | 88.4% (4648/5256) | 97% (4819/4970) | 0.0001 |
| Recall rate | 93.0% (4648/5000) | 96.4% (4819/5000) | 0.0001 | |
| F-measure | 90.6% | 96.7% | ||
Step 2 (epithelial cell classification). —
In this step, we further classified the cells from Step 1 into normal and abnormal epithelial cells. We built LR classifier by using the optimal parameters for classification and compared it with the NB classifier using the same parameters. The overall true positive rate of abnormal epithelial cells is shown in Table 3.
As can be seen in Table 3, LR classifier is much better than NB classifier in both accuracy of the two types of cells (normal and abnormal epithelial cells) and the precision of abnormal epithelial cells. This also indicates that the level 2 classification by LR classifier is more appropriate for cervical cell recognition.
The assessment of the effectiveness of classifier is dependent not only on overall correctness, but also on specificity and sensitivity. The ROC curve and the areas under the ROC curve in this study not only combine sensitivity and specificity but also take all critical values into consideration and therefore can better represent the correctness of the method used in this study. The ROC curves are shown in Figure 6.
As can be seen in Figure 6, the ROC curve of LR classifier is on the left upper corner and far from the chance curve. The area under ROC curve is 0.996, far bigger than the areas (0.5) under the chance line. The results show significant difference if we adopt the method of classifying the cells into 5 groups by LR classifier and compare it with the chance line without any value.
Table 3.
The result of Step 2 classification. The accuracy and the precision as analyzed by NB and LR classifiers are shown.
| Assessment | NB | LR | P values |
|---|---|---|---|
| Accuracy of 2 types of cells | 84.1% (4205/5000) |
98.58% (4929/5000) |
0.0001 |
|
| |||
| Precision of abnormal epithelial cells | 88.3% (2107/2386) |
98.6% (2455/2491) |
0.0001 |
Figure 6.
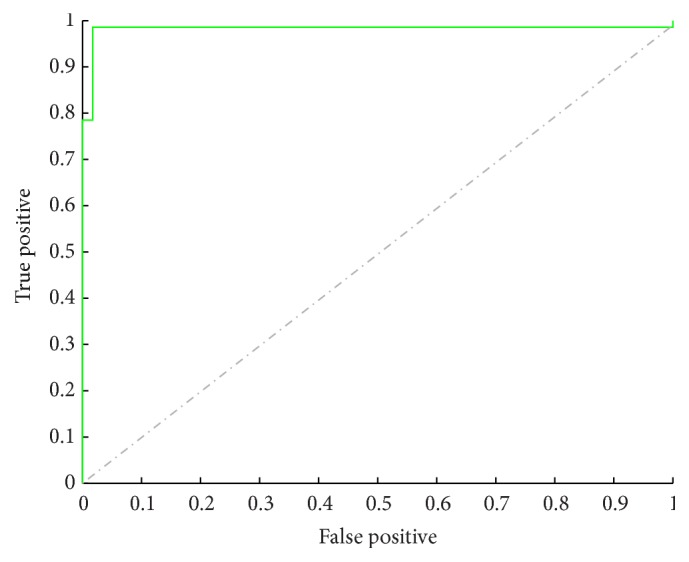
The ROC curves of the results of Step 2 classification. x-axis is the false positive. y-axis is true positive. The dash and dot line indicate the chance curve. The ROC curve of the results from Step 2 classification is in green color and on the left upper corner.
3.4. Further Analysis of the Experimental Results
The final goal of this study is to recognize abnormal epithelial cells and to filter out the interfering lymphoid cells, neutrophil, and junk cells. We used two-step cascade classification system to increase the sensitivity and the specificity of abnormal epithelial cells. To confirm the effectiveness of this cascade method and to show that it is not an effective strategy to directly separate the cells into 5 groups, we used the single classifier system that is commonly used by Weka, the same experimental data, and the same parameters to separate the cells into five groups and then compare with the results produced by our method.
According to the data from Steps 1 and 2 and (9) and (10), the overall accuracy and precision of detection of abnormal cells of our two-level cascade classification system are 95.805% and 95.642%, respectively. As can be seen in Figure 7, they are higher than the accuracy and the precision of any single classifier system. The detection rate of abnormal cells is also 2% higher than any single classifier system. These results indicate that the two-step cascade classifier integration system not only is appropriate for cervical cancer screening, but also enhances the sensitivity of abnormal epithelial cell detection.
Figure 7.
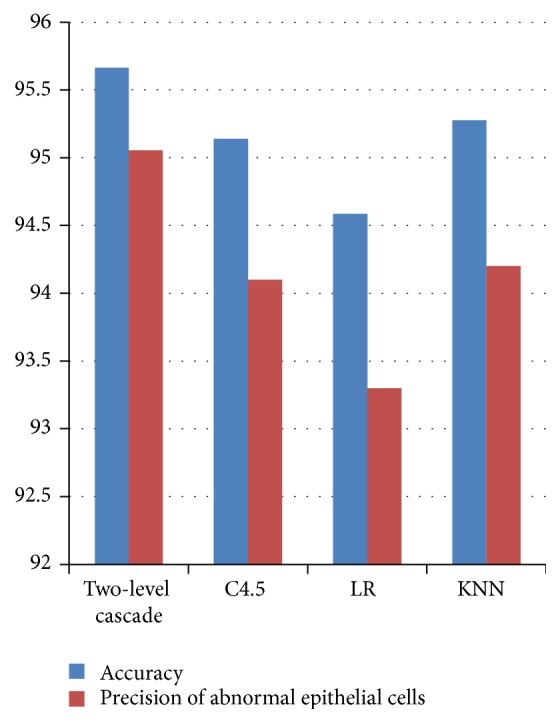
The histogram of the detection accuracy and the precision of each classifying system (KNN: K-nearest neighbor).
In comparison to the false negative (20%) and false positive (10%) of traditional Pap smear review [3], both the false negative rate and false positive rate (both 36 out of 2500 and 1.44%) of the proposed automatic two-level cascade classification system are much lower. These results demonstrated that the proposed classification system has the potential to dramatically reduce the false negative and false negative rate, to avoid misdiagnosis, and to increase the accuracy and reliability of cervical cancer screening.
4. Conclusion
In conclusion, we developed our two-level cascade classifier based on the experience of other studies and obtained 28 dimensional features in morphology and texture. We first separated the cells into epithelial cells, lymphoid cells, neutrophils, and junks cells because of mixed cell types in the specimen and then further classified the recognized epithelial cells into normal and abnormal epithelial cells. The first classifier C4.5 showed high accuracy (97.185%), precision (96.7%), recall (96.4%), and F-measure (96.7%). The overall correct rate of the Step 2 LR classifiers showed not only high accuracy (98.58%) and recognition rate of abnormal epithelial cells (98.6%), but also high areas under the ROC curve (0.996). The overall accuracy for the method we used was 95.805%, while the recognition rate for abnormal epithelial cells was 95.642%. Our method showed high accuracy and high abnormal epithelial cell recognition rate when compared with single classifier system and showed 2% higher abnormal cell recognition rate.
The cost of the system used in our study is estimated to be around 20,000$, including the equipment used to capture cell image such as industrial microscope (Olympus BX43) (~12,000$), high quality camera (IDS UI-3370CP-C-HQ) (~2000$), slides and staining materials (~500$), and software development and maintenance (~5500$). We think it is affordable for developing countries that are limited in budget and conditions. The application of this system will facilitate cervical cancer screening and prevention in developing countries and shorten the distance between developing countries and developed countries.
We will pay more attention to the larger samples in the future studies to confirm our promising findings.
Acknowledgments
This work is supported by the National Natural Science Foundation of China under Grant no. 61305001.
Competing Interests
The authors declare that there is no conflict of interests regarding the publication of this paper.
References
- 1. http://www.who.int/en/
- 2.Weintraub J., Morabia A. Efficacy of a liquid-based thin layer method for cervical cancer screening in a population with a low incidence of cervical cancer. Diagnostic Cytopathology. 2000;22(1):52–59. doi: 10.1002/(SICI)1097-0339(200001)22:1<52::AID-DC14>3.0.CO;2-#. [DOI] [PubMed] [Google Scholar]
- 3.Stoler M. H. Advances in cervical screening technology. Modern Pathology. 2000;13(3):275–284. doi: 10.1038/modpathol.3880048. [DOI] [PubMed] [Google Scholar]
- 4.Plissiti M. E., Nikou C., Charchanti A. Automated detection of cell nuclei in Pap smear images using morphological reconstruction and clustering. IEEE Transactions on Information Technology in Biomedicine. 2011;15(2):233–241. doi: 10.1109/TITB.2010.2087030. [DOI] [PubMed] [Google Scholar]
- 5.Sobrevilla P., Montseny E., Vaschetto F., Lerma E. Fuzzy-based analysis of microscopic color cervical pap smear images: nuclei detection. International Journal of Computational Intelligence and Applications. 2010;9(3):187–206. doi: 10.1142/s1469026810002860. [DOI] [Google Scholar]
- 6.Chen Y.-F., Huang P.-C., Lin K.-C., et al. Semi-automatic segmentation and classification of pap smear cells. IEEE Journal of Biomedical and Health Informatics. 2014;18(1):94–108. doi: 10.1109/JBHI.2013.2250984. [DOI] [PubMed] [Google Scholar]
- 7.Harandi N. M., Sadri S., Moghaddam N. A., Amirfattahi R. An automated method for segmentation of epithelial cervical cells in images of ThinPrep. Journal of Medical Systems. 2010;34(6):1043–1058. doi: 10.1007/s10916-009-9323-4. [DOI] [PubMed] [Google Scholar]
- 8.Sulaiman S. N., Mat Isa N. A., Othman N. H. Semi-automated pseudo colour features extraction technique for cervical cancer's pap smear images. International Journal of Knowledge-Based and Intelligent Engineering Systems. 2011;15(3):131–143. doi: 10.3233/KES-2011-0217. [DOI] [Google Scholar]
- 9.Bergmeir C., García Silvente M., Benítez J. M. Segmentation of cervical cell nuclei in high-resolution microscopic images: a new algorithm and a web-based software framework. Computer Methods & Programs in Biomedicine. 2012;107(3):497–512. doi: 10.1016/j.cmpb.2011.09.017. [DOI] [PubMed] [Google Scholar]
- 10.Rahmadwati, Naghdy G., Ross M., Todd C., Norachmawati E. Classification cervical cancer using histology images. Proceedings of the 2nd International Conference on Computer Engineering and Applications (ICCEA '10); March 2010; Bali Island, Indonesia. IEEE; pp. 515–519. [DOI] [Google Scholar]
- 11.Rahmadwati, Naghdy G., Ros M., Todd C., Norahmawati E. Cervical cancer classification using Gabor filters. Proceedings of the 1st IEEE International Conference on Healthcare Informatics, Imaging and Systems Biology (HISB '11); July 2011; San Jose, Calif, USA. IEEE; pp. 48–52. [DOI] [Google Scholar]
- 12.Rajesh Kumar R. R., Kumar V. A., Sharath Kumar P. N., Sudhamony S., Ravindrakumar R. Detection and removal of artifacts in cervical cytology images using support vector machine. Proceedings of the IEEE International Symposium on IT in Medicine and Education (ITME '11); December 2011; Cuangzhou, China. pp. 717–721. [DOI] [Google Scholar]
- 13.Sarwar A., Ali M., Suri J., Sharma V. Performance evaluation of machine learning techniques for screening of cervical cancer. Proceedings of the 2nd International Conference on Computing for Sustainable Global Development (INDIACom '15); March 2015; New Delhi, India. pp. 880–886. [Google Scholar]
- 14.Yusoff I. A., Mat Isa N. A., Othman N. H., Sulaiman S. N., Jusman Y. Performance of neural network architectures: cascaded MLP versus extreme learning machine on cervical cell image classification. Proceedings of the 10th International Conference on Information Sciences Signal Processing and their Applications (ISSPA '10); May 2010; Kuala Lumpur, Malaysia. IEEE; pp. 308–311. [DOI] [Google Scholar]
- 15.Prinyakupt J., Pluempitiwiriyawej C. Segmentation of white blood cells and comparison of cell morphology by linear and naïve Bayes classifiers. BioMedical Engineering Online. 2015;14(1, article 63) doi: 10.1186/s12938-015-0037-1. [DOI] [PMC free article] [PubMed] [Google Scholar]
- 16.Guo P., Banerjee K., Stanley R., et al. Nuclei-based features for uterine cervical cancer histology image analysis with fusion-based classification. IEEE Journal of Biomedical & Health Informatics. 2015 doi: 10.1109/jbhi.2015.2483318. [DOI] [PMC free article] [PubMed] [Google Scholar]
- 17.Prabhakar S., Jain A. K. Decision-level fusion in fingerprint verification. Pattern Recognition. 2001;35(4):861–874. [Google Scholar]
- 18.Jiang Y., Zhou Z., Xie Q., et al. Applications of neural network ensemble in lung cancer cell identification. Journal of Naijing University. 2001;37(5):529–534. [Google Scholar]
- 19.Niu Z., Shan S., Yan S., Chen X., Gao W. 2D cascaded AdaBoost for eye localization. Proceedings of the 18th International Conference on Pattern Recognition (ICPR '06); August 2006; Hong Kong, China. IEEE; pp. 1216–1219. [DOI] [Google Scholar]
- 20.Saslow D., Runowicz C. D., Solomon D., et al. American Cancer Society guideline for the early detection of cervical neoplasia and cancer. Ca—A Cancer Journal for Clinicians. 2002;52(6):342–362. doi: 10.3322/canjclin.52.6.342. [DOI] [PubMed] [Google Scholar]
- 21.Nance K. V. Evolution of Pap testing at a community hospital—a ten year experience. Diagnostic Cytopathology. 2007;35(3):148–153. doi: 10.1002/dc.20607. [DOI] [PubMed] [Google Scholar]
- 22.Chouhan R., Jha R. K., Biswas P. K. Enhancement of dark and low-contrast images using dynamic stochastic resonance. IET Image Processing. 2013;7(2):174–184. doi: 10.1049/iet-ipr.2012.0114. [DOI] [Google Scholar]
- 23.Mukherjee J., Mitra S. K. Enhancement of color images by scaling the DCT coefficients. IEEE Transactions on Image Processing. 2008;17(10):1783–1794. doi: 10.1109/tip.2008.2002826. [DOI] [PubMed] [Google Scholar]
- 24.Finlayson G., Hordley S., Schaefer G., Yun Tian G. Illuminant and device invariant colour using histogram equalisation. Pattern Recognition. 2005;38(2):179–190. doi: 10.1016/j.patcog.2004.04.010. [DOI] [Google Scholar]
- 25.Smolka B. Pattern Recognition. Berlin, Germany: Springer; 2002. Efficient modification of the central weighted vector median filter; pp. 166–173. [Google Scholar]
- 26.Hore A. E. S., Qiu B., Wu H. R. Improved vector filtering for color images using fuzzy noise detection. Optical Engineering. 2003;42(6):1656–1664. doi: 10.1117/1.1572156. [DOI] [Google Scholar]
- 27.Bojinski S., Schaepman M., Schläpfer D., Itten K. SPECCHIO: a spectrum database for remote sensing applications. Computers & Geosciences. 2003;29(1):27–38. doi: 10.1016/s0098-3004(02)00107-3. [DOI] [Google Scholar]
- 28.Zhang L., Chen S., Wang T., Chen Y., Liu S., Li M. A practical segmentation method for automated screening of cervical cytology. Proceedings of the IEEE International conference on Intelligent Computation and Bio-Medical Instrumentation (ICBMI '11); December 2011; Wuhan, China. IEEE; pp. 140–143. [DOI] [Google Scholar]
- 29.Zheng B., Yoon S. W., Lam S. S. Breast cancer diagnosis based on feature extraction using a hybrid of K-means and support vector machine algorithms. Expert Systems with Applications. 2014;41(4):1476–1482. doi: 10.1016/j.eswa.2013.08.044. [DOI] [Google Scholar]
- 30.Jin-Ping F. The Research on the Method of Cervical Cell Image Segmentation and Recognition. Guangzhou, China: Jinan University; 2010. [Google Scholar]
- 31.Bandlow T., Klupsch M., Hanek R., Schmitt T. RoboCup-99: Robot Soccer World Cup III. Vol. 1856. Berlin, Germany: Springer; 2000. Fast image segmentation, object recognition and localization in a robocup scenario; pp. 174–185. (Lecture Notes in Computer Science). [DOI] [Google Scholar]
- 32.Schneider G., Wrede P. Development of artificial neural filters for pattern recognition in protein sequences. Journal of Molecular Evolution. 1993;36(6):586–595. doi: 10.1007/BF00556363. [DOI] [PubMed] [Google Scholar]
- 33.Naghdy G., Ros M., Todd C. Proceedings of the 2011 2nd International Congress on Computer Applications and Computational Science. Vol. 2. Berlin, Germany: Springer; 2012. Morphological characteristics of cervical cells for cervical cancer diagnosis; pp. 235–243. [Google Scholar]
- 34.Haralick R. M., Shanmugam K., Dinstein I. H. Textural features for image classification. IEEE Transactions on Systems, Man and Cybernetics. 1973;3(6):610–621. doi: 10.1109/tsmc.1973.4309314. [DOI] [Google Scholar]
- 35.Chetverikov D. Experiments in the rotation-invariant texture discrimination using anisotropy features. Proceedings of the Sixth International Conference on Pattern Recognition and Information Processing (PRIP '82); 1982; pp. 1071–1074. [Google Scholar]
- 36.Qing C., Georganas N. D., Petriu E. M. Real-time vision-based hand gesture recognition using haar-like features. Proceedings of the IEEE Instrumentation & Measurement Technology Conference (IMTC '07); May 2007; Warsaw, Poland. IEEE; pp. 1–6. [DOI] [Google Scholar]
- 37.Kodogiannis V., Chowdrey H. S. Multi-network classification scheme for computer-aided diagnosis in clinical endoscopy. Proceedings of the International Conference on Medical Signal Processing (MEDISP '04); 2004; pp. 262–267. [Google Scholar]