

Abstract
NF-Y is a trimeric transcription factor (TF), binding the CCAAT box element, for which several results suggest a pioneering role in activation of transcription. In this work, we integrated 380 ENCODE ChIP-Seq experiments for 154 TFs and cofactors with sequence analysis, protein–protein interactions and RNA profiling data, in order to identify genome-wide regulatory modules resulting from the co-association of NF-Y with other TFs. We identified three main degrees of co-association with NF-Y for sequence-specific TFs. In the most relevant one, we found TFs having a significant overlap with NF-Y in their DNA binding loci, some with a precise spacing of binding sites with respect to the CCAAT box, others (FOS, Sp1/2, RFX5, IRF3, PBX3) mostly lacking their canonical binding site and bound to arrays of well spaced CCAAT boxes. As expected, NF-Y binding also correlates with RNA Pol II General TFs and with subunits of complexes involved in the control of H3K4 methylations. Co-association patterns are confirmed by protein–protein interactions, and correspond to specific functional categorizations and expression level changes of target genes following NF-Y inactivation. These data define genome-wide rules for the organization of NF-Y-centered regulatory modules, supporting a model of distinct categorization and synergy with well defined sets of TFs.
INTRODUCTION
The mechanisms of transcriptional activation by RNA polymerase II involve a complex set of events, that include the binding of transcription factors (TFs) to specific DNA sequences in promoters and enhancers (TF binding sites, TFBSs), the recruitment of non DNA-binding co-activators, many of which have chromatin-modifying activities, and the association of general transcription factors (GTFs). The process is influenced by local patterns of histone modifications, which, in turn, are ‘written’ and ‘read’ by enzymes recruited by TFs and cofactors. A central theme in modern biology and genetics is, therefore, the dissection of this highly complex process in molecularly identifiable units or modules, each responsible for a precise function and/or the regulation of specific sets of genes.
The CCAAT box, one of the first cis-acting promoter elements discovered, was identified in numerous studies over the past decade as a widespread feature of mammalian promoters (1–5), and indeed among one of the few ‘driver’ or ‘cardinal’ TFBSs in human (6–8) and mouse (9) regulatory regions. Its location in promoters is relatively precise, from 60 to 100 base pairs upstream of transcription start sites (TSSs), and it is found in diverse classes of genes, many of which belong to inducible systems, such as heat shock, endoplasmic reticulum (ER) stress, DNA-damage, cell-cycle (10) and also in genes overexpressed in cancer cells, particularly in the most aggressive ones (11–14).
By employing in vitro biochemical and in vivo genomic assays, the transcription factor NF-Y (also termed CBF) was found to be the primary factor with CCAAT-binding activity (15). NF-Y is a trimeric protein formed by the evolutionarily conserved subunits NF-YA, NF-YB and NF-YC, whose sequence-specific DNA recognition has been recently documented by structural studies (16,17). The vital physiological importance of NF-Y was documented in models of NF-YA knockout mice, in embryos (18) and in conditional experiments in hepatic, hematopoietic, neuronal and adipocyte systems (19–22). The biology of the three subunits is complex, both because NF-YA and NF-YC have multiple splicing isoforms with different function and expression levels in different tissues, and because the subunits are subject to post-translational modifications (PTMs), such as phosphorylations, acetylations and ubiquitinations (23).
A comprehensive effort to characterize genome-wide TFs binding and interplay in the human genome has been carried out by the ENCODE consortium (24,25), through hundreds of ChIP-Seq experiments in several different cell lines. The analysis of the massive amount of data produced has been so far extremely informative, confirming on one hand the specificity of many TFs for the binding motifs previously identified in vitro, and allowing on the other for the identification of novel ones (26–28). At the same time, however, it has detailed a more complex picture, in which many TFs appear to be bound to genomic locations devoid of their canonical target sequence, likely via protein–protein interactions with other sequence-specific TFs (26,29).
The identification of NF-Y genomic bound regions within the ENCODE project was performed by ChIP-Seq for NF-YA and NF-YB in the three ENCODE Tier-1 cell lines (K562, Hela-S3 and GM12878), with an initial partial characterization of its relationships with 78 other TFs in K562 cells (30). The data confirmed the general requirement for the CCAAT binding motif, and also a widespread binding to enhancers, previously observed in more limited ChIP on chip experiments (31,32). Additional relevant conclusions concerned the association of NF-Y to LTR repetitive sequences, the precise arrangement of binding sites with respect to some E-box binding TFs, and the widespread presence of FOS to NF-Y bound regions devoid of canonical AP1 sites. The binding to LTR regions and correlation with some TFs were also reported in other studies (26,29).
The association of NF-Y to nucleosome-dense regions devoid of open chromatin common histone PTMs, peculiar among ENCODE TFs, suggested that NF-Y is a ‘pioneer’ TF driving the initial opening of chromatin territories for the build-up of competent transcription complexes. This conclusion was further supported by independent studies: (i) the analysis of DNAse I hypersentitive sites through unbiased machine-learning methods, coupled with ChIPs and functional in vivo experiments (33); (ii) ChIP-Seq and RNAi analysis of the three NF-Y subunits in mES cells indicated that NF-Y promotes chromatin accessibility to master TFs like OCT4, SOX2 and NANOG in enhancers of developmentally controlled genes (34); (iii) The 3D structure of the trimer in complex with DNA (17) detailed two important features in line with a pioneering role: first, the overall area of DNA contacts is rather large (25/28 bps) for a TF, with sequence-specific recognition by NF-YA in the CCAAT minor groove area, leaving neighboring major grooves, generally the recognition points of DNA-binding TFs, open for binding; second, NF-Y is able to bend DNA – acting as an ‘architectural’ TF that shapes the three-dimensional arrangement of the promoter, bringing distal TFs closer to the general transcription machinery; (iv) Elimination of NF-Y binding by RNAi of one of its subunits or overexpression of a Dominant Negative NF-YA mutant, is detrimental for in vivo promoter recruitment of a disparate set of TFs and cofactors (35–47).
The near-ubiquitous pattern of expression of NF-Y subunits and widespread occurrence of CCAAT boxes in promoters might suggest a model whereby NF-Y could serve a pioneering role to most, or all, TFs in any specific CCAAT promoter. On the other hand, past individual dissections of promoters and TF–TF interactions would argue in favor of a more specific interplay, taking place only with selected classes of TFs and co-factors.
Reconstructing the genomic interplay map of NF-Y with other TFs is essential in order to rationalize and integrate this sketchy plot, assembled so far by using pieces of information on single TFs and promoters. For this task, in this work we systematically analyzed the enrichment for NF-Y sites in the genomic loci bound by 154 TFs tested in the ENCODE Project in K562, Hela-S3 and GM12878 cell lines, for a total of about 380 different ChIP-Seq experiments, identifying a subset of TFs which tend to bind in vivo throughout the genome the same DNA regions of NF-Y. Among these, we also singled out several cases in which the binding of NF-Y and the other TF requires a precise arrangement of binding sites on DNA. We then further integrated these observations with protein–protein interaction data, and provided a functional characterization of the genes targeted by the different associations, as well as the respective expression profiles after NF-Y-inactivation.
MATERIALS AND METHODS
Motif enrichment analysis
We considered all ENCODE ChIP-Seq data sets of K562, GM12878 and Hela-S3, i.e. cell lines for which NF-YA and NF-YB ChIP-Seq experiments were available. Peak coordinates were retrieved from the UCSC Genome Browser database (48), and regions around the peak summits submitted to PscanChIP (49) version 1.0, for assessing the enrichment of the CCAAT box. Differently from other motif enrichment analysis tools, PscanChIP evaluates motif enrichment in peak regions from ChIP-Seq experiments with two different criteria: global or local enrichment:
Global enrichment is assessed according to a genomic background, and motifs found to be enriched according to this measure are over-represented in the selected regions with respect to the rest of the genome accessible to TF binding. Thus, they tend to be found in the genome prevalently in correspondence to the binding regions of the TF investigated. Hence, a motif with significant global enrichment could correspond to the actual binding site of the TF (usually the most significant one), or binding sites of other TFs which show a clear genome-wide tendency to bind in association with it.
Local enrichment, instead, evaluates whether, whenever an instance of the motif is found in the neighborhood of a peak region, it is more likely to be close to the peak summit—where TF binding usually takes place—or not. Globally enriched motifs are usually enriched also locally. On the other hand, motifs enriched only according to this measure—and not globally—correspond to binding sites for TFs which tend to bind in close proximity of the TF for which the experiment was performed, but in a limited subset of regions, and not as a genome wide rule.
In both cases, enrichment is evaluated according to a Bonferroni-corrected P-value. To highlight only the strongest candidates, we deemed to be significantly enriched for the CCAAT box those data sets where the P-value was lower than 10−10 for either criterion. Since for the evaluation of global enrichment PscanChIP employs cell-specific background expected values, K562 data were analyzed with the respective PscanChIP background, while for Hela-S3 and GM12878 we employed the ‘mixed’ background that is suitable for cell lines for which data for computing the background values were not available. As descriptor of the CCAAT box motif we employed the JASPAR (50) matrix with ID MA0060.1. This matrix was originally described by one of us (51), and later confirmed by ChIP-chip (10) and de novo motif discovery in diverse sources of ChIP-Seq data (26,28,30,34,40,52). Factors with a significant enrichment for CCAAT boxes in their peaks were then submitted to further analyses in additional cell lines in which NF-Y experiments were not performed by ENCODE. The full data set analyzed, together with the complete PscanChIP results are available as Supplementary Table S1.
The PscanChIP tool contains also a module able to evaluate any positional bias for motifs within peak regions, in two different ways: (i) preferential positioning of a motif with respect to the peak summit, another indicator that the motif might be essential for the recruitment to DNA of the TF investigated, and (ii) preferential relative positioning of two different motifs, or two instances of the same motif, possible indicator of co-operative binding of two different TF, or a single TF binding as a dimer. In both cases, PscanChIP associates with any positional bias a P-value computed assuming a uniform distribution of the distance between motif instances. Hence, in data sets with significant enrichment for the CCAAT box, preferential distances among pairs of CCAAT boxes, or the CCAAT box and the binding sites of the other TFs, were also assessed by analyzing the regions bound both by NF-Y and each of the TFs, and reported to be significant if the associated P-value was lower than 10−10.
Genome-wide peak co-association
Since finding the CCAAT box motif enriched in peaks for TFs other than NF-Y, by itself, is no guarantee of in vivo NF-Y binding, we also determined, for each data set, the actual association of the TF studied with NF-Y by crossing its ChIP-Seq peak coordinates with the ones of both NF-YA and NF-YB in the same cell line, and assessing if the overlap could be considered significant, i.e. widespread genome-wide. Pairwise overlap between two ChIP-Seq data sets was defined by considering two peaks as ‘overlapping’ if the respective summits fell within 150 bps from one another. Starting from this definition we defined a co-association score able to capture the significance of the overlap. Given two data sets, with m and n peaks respectively, and k peaks considered to be overlapping according to the criterion just described, we assumed that across the genome there exists a number N of regions of 150 bps available for TF binding. Then, we assessed the probability of having by chance k peak regions out of N in common between the two TFs with a Fisher Exact Test with parameters k (the number of overlapping peak regions), n, m, (the number of peaks in the two data sets compared, respectively) and N.
The problem was to define a suitable value for N, which is a key value for the P-values produced. We considered taking into account the whole genome not to be a correct choice, since in every cell line or condition most of it is not accessible to TF binding. Thus, as in a previous work (49), we used as an estimate for N the number of chromatin accessible regions, identified by DNaseI ‘hyperaccessibility’ or ‘hypersensitivity’, which is indeed a feature of active cis-regulatory sequences. For this, we considered ENCODE DNaseI Digital Genomic Footprinting regions available at the UCSC genome browser database (48), which are exactly 150 bps long. The number is clearly variable in different cell lines, but ranges from 200 000 to 300 000 in all the cell lines available. In this work, we employed N = 250 000 for all the cell lines studied. Starting from the P-value, P returned by the Fisher test we defined the co-association score as –log10P if k was greater than the expected value, log10P otherwise. Once again, in order to single out the strongest candidates corresponding to genome-wide co-associations, and not only to co-associations derived from, e.g. the fact that TFs tend to bind promoters and/or enhancers, we considered two ChIP-Seq experiments to be ‘significantly overlapping’ if the resulting co-association score was >100 for both NF-YA and NF-YB.
For the identification of more complex regulatory modules, we also computed pairwise co-associations within NF-YB peaks for pairs of TFs in a similar fashion, by counting the number k of NF-YB summits that in turn contained a summit for both TFs within 150 bps, but in this case defining n and m as the number of summits for each TF located within 150 bps from a NF-YB summit, and setting for the Fisher Exact Test N as the overall number of NF-YB peaks. Co-association matrices and heatmaps were obtained for each cell line by performing a hierarchical clustering on co-association scores, using Pearson correlation as distance and UPGMC as clustering method, as implemented in the hclust R function, in order to identify groups of TFs clustering together when binding in association with NF-Y.
Lentivirus transductions, Western blots and ChIPs
The shRNA expressing (Scramble and shNF-YB) and packaging (VSVG and pCMV-dR8.74) plasmids were transfected in HEK293T cells to obtain lentiviruses. Lentivirus-containing supernatant was collected 48 h after transfections, filtered and frozen at –80°C. Hela Cells (30 × 106) were plated, infected with viral supernatants and harvested after 72 h. After fixation with formaldehyde (1% for 10’), crosslinked chromatin was sonicated (Bioruptor, Diagenode) to fragments of approximately 1/1.5 kbp in length, as checked by Agarose gel electrophoresis. ChIP assays were performed as described (35) with 5 μg of the following antibodies: anti-FLAG (Sigma-F3165), anti-NF-YB (GeneSpin), anti-ELK4 (Santa Cruz sc-13030), anti-E2F4 (Santa Cruz sc-1082) anti-CEBP/B (Santa Cruz sc-150). Immunoprecipitated DNAs were re-suspended in TE buffer and used for analysis by quantitative PCR.
From Hela cells infected in parallel with lentiviral supernatants, total extracts were re-suspended in SDS buffer and Western blots performed according to standard procedures, incubation overnight with the indicated primary antibodies and for 2 h with a peroxidase conjugated secondary antibody (Sigma). Digital images were collected by Chemidoc MP (Biorad).
Quantitative PCR analysis
Quantitative real time PCR (RT-PCR) was performed using SYBR Green (Biorad Soadvance mix) in IQ5 Biorad PCR machine. Primers (listed in Supplementary Table S7) were designed with Primer3 software, to amplify genomic regions of 80–150 bp. Relative enrichment was calculated as 2DCtx -2DCtb, where DCtx = (Ct input- Ct sample) and DCtb = (Ct input - Ct control antibody). Resulting values were normalized with respect to a negative locus. Data are shown as percentage of difference in TFs binding in shNF-YB-treated cells compared to shScramble-treated cells. Values are the means of two independent biological replicates and qPCR performed in triplicates.
Protein–protein interaction and expression data
We retrieved protein–protein interaction data from BioGrid version 3.4 (53), integrating them with available literature on NF-Y (28,54–59), in order to associate positional bias of binding sites with interactions at the protein level of corresponding TFs. Transcription profiling data after NF-YA inactivation by shRNA, available for Hela-S3 cells were retrieved from (30) (GEO accession GSE40215). As in the original work, arrays were RMA normalized, gene expression levels calculated, differential expression determined and probes annotated using the R Bioconductor packages affy and limma. We defined as up-regulated and down-regulated those genes with fold change above 1.3 and FDR < 0.05. Gene ontology enrichment was computed using DAVID version 6.5.
RESULTS
NF-Y has genome-wide partnerships with selected transcription factors
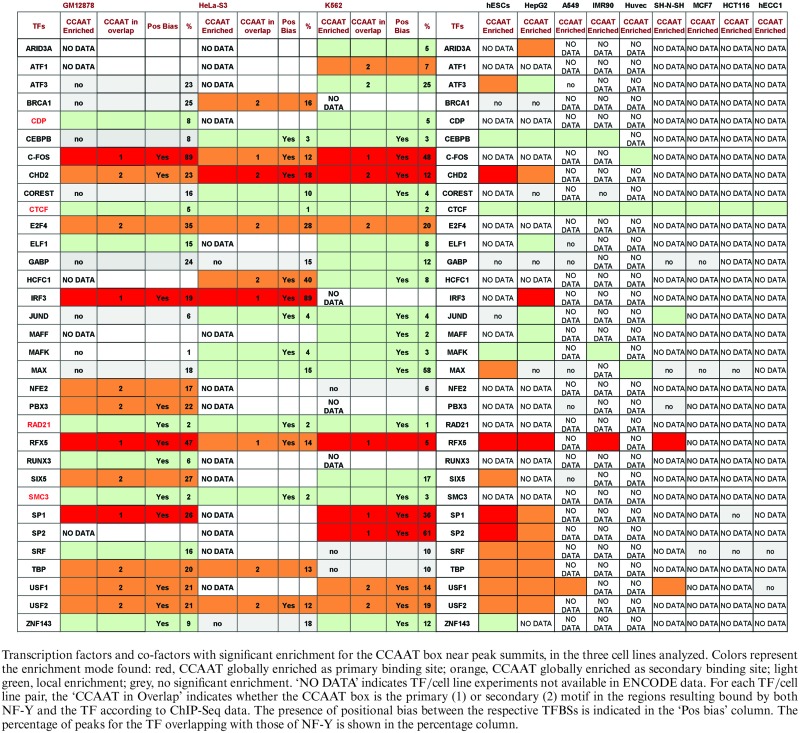
The workflow of the analysis is shown in Figure 1. Enrichment analysis for the CCAAT box motif in ChIP-Seq experiments for other TFs was based on three criteria, corresponding to the different modes of enrichment PscanChIP is able to identify, as described in the Materials and Methods section: (i) NF-Y was identified by PscanChIP as having the ‘primary binding site’ in the peak regions, that is, the CCAAT box was singled out as the motif with highest ‘global’ enrichment in the regions; in this case, the CCAAT box could be considered as the main sequence element responsible for the binding to DNA of the TF studied in the ChIP-Seq experiment (highlighted in red in Table 1). Note that this does not imply that the TF binds to CCAAT directly, but it suggests that a CCAAT-bound NF-Y might be mediating recruitment. (ii) NF-Y was scored as ‘secondary binding site’, i.e. it was significantly enriched at the global level according to PscanChIP, but was not the most enriched one, hinting at a widespread co-operative binding of NF-Y with the IP'ed TF, which is bound to its expected binding motif (highlighted in orange in Table 1). (iii) NF-Y was found to have only significant ‘local’ enrichment, hinting to close binding of NF-Y and the IP'ed TF, but limited to a subset of genomic regions not large enough to consider the phenomenon as a ‘general rule’ (highlighted in light green in Table 1).
Figure 1.

Analysis workflow. The whole set of TFs and co-factors with ChIP-Seq data in ENCODE (K562, HeLa-S3 and GM12878) were analyzed with PscanChIP to evaluate CCAAT enrichment. In parallel, we calculated the overlap of peaks for each of the 154 ENCODE factors from the three cell lines with NF-Y peaks. The NF-Y modules derived from these data were integrated by two sets of data: protein–protein interactions, taken from the BIOGRID database and gene expression data after NF-YA-inactivation in Hela-S3. Three resulting modes of NF-Y/TF interactions are shown at the bottom: NF-Y-mediated binding of a TF, in the absence of a specific TF recognition sequence (Left); co-binding of NF-Y and a TF, with positional constraints between the respective binding sites (Center); TF co-binding with NF-Y without any precise arrangement of sites (Right).
Table 1. Proteins whose in vivo binding sites are enriched in CCAAT boxes.
|
The analysis on the peak regions for 154 ENCODE TFs available in K562, Hela-S3 and GM12878 cell lines returned 33 factors, mostly sequence-specific TFs, with significant enrichment of CCAAT box in their ChIP-Seq bound regions in at least one cell line. The list is shown in Table 1. Notably, some of the data sets had the CCAAT box as ‘primary’ binding site. Indeed, independent genome-wide studies not linked to ENCODE already reported enrichment for NF-Y binding sites in the bound regions of ATF3 in HCT116 and LNCaP cells (60), Sp2 in HEK293 and mouse MEF cells (61,47), E2F4 in B cells GM06990 (62).
We then complemented the motif enrichment analysis by evaluating the co-occurrence of peak summits of NF-YB with those of each of the 33 TFs (see Materials and Methods and Supplementary Table S2). The results are also summarized in Table 1, with the percentage of peaks of each experiment sharing NF-YB summits in close proximity (the percentage column). The association identified by motif analysis was confirmed for nearly all the factors (29 out of 33), that had a significant overlap of their peaks with those of NF-Y, and therefore the CCAAT boxes found to be enriched are actually bound by NF-Y in vivo. We can also observe how the percentage of peaks overlapping NF-Y tends to be lower for those TFs with ‘local’ enrichment for the CCAAT box, while with ‘global’ CCAAT enrichment the overlap is usually more widespread. The four exceptions, for which the co-association score vice versa pointed to ‘significantly low’ overlap, were CTCF, the two associated subunits RAD21 and SMC3, together part of the cohesin complex and CDP (CCAAT Displacement Protein). For these, the enrichment found by PscanChIP was ‘local’, and overlap with NF-Y peaks marginal and not significant. The presence of CCAAT boxes with low peak association might reflect mutually exclusive binding: indeed, this was one of the original features described in vitro for CDP (63). It should also be noted that good NF-Y/CTCF intersections were recently reported in mES cells induced to neuronal differentiation, but not in growing cells (34), suggesting that the NF-Y/Cohesin interplay might be cell-type specific or related to the status of the cell (growing versus differentiated).
To characterize better the results obtained for each of the TFs listed in Table 1, and to assess whether the CCAAT box motif could be considered the primary binding motif in case of global enrichment, we ran a second round of PscanChIP experiments, focusing on the subset of TF-bound regions overlapping with NF-YB peaks, as defined in the previous step, thus bound in vivo both by NF-Y and the individual TF. Quite naturally, all the factors with CCAAT box globally enriched in their peaks had it also in these subsets, either as the primary ‘global’ binding motif or a secondary one, preceded by the binding site for the TF (summarized in column ‘Pos overlap’ in Table 1, where ‘1’ indicates the CCAAT box as primary binding site and ‘2’ secondary, respectively). For FOS, that in HeLa-S3 had the CCAAT box preceded in the ranking of enrichment motifs only by the canonical AP1 motif, the CCAAT box is confirmed as the primary motif in the overlapping regions in all cell lines, with no enrichment found for AP1, which vice versa can be found as primary site in regions co-bound by FOS and JUN, but not NF-Y. Indeed, AP1 and CCAAT box sites had been previously shown to co-exist with a precise spacing only in a limited set of regions, bound by both FOS and NF-Y, corresponding to LTR repeats (30,49). These findings point to two different main modes of genome targeting for FOS, one mediated by NF-Y/CCAAT, and another through the canonical AP1 motif. The same argument holds for CHD2 and RFX5, where the CCAAT box emerges as the primary motif in regions bound by NF-Y, with other motifs (CTCF for CHD2, the RFX motif for RFX5) not enriched in the regions bound together with NF-Y and becoming instead the main one when NF-Y is absent. All in all, the CCAAT box is the main motif found in regions bound by NF-Y and FOS, CHD2, IRF3, RFX5, PBX3, Sp1 and Sp2. All the other CCAAT-enriched TFs had instead the respective canonical motif as the most enriched also in the regions co-bound by NF-Y. For the TFs with ‘local’ enrichment for the CCAAT box, a secondary CCAAT enrichment in the peaks that overlapped NF-Y was confirmed. The sole exception was CoREST, for which the CCAAT box was found to be the most enriched motif in the presence of NF-Y binding.
We also computed for all the data sets whether there was any positional bias among binding sites, i.e. whether the CCAAT box and the motif known to be bound by the TF presented a preferential spacing in the co-bound regions, or whether more than one CCAAT box could be present in the regions, since NF-Y is known to bind also multiple instances of its binding site. Indeed, most had a significant positional bias, as scored by PscanChIP and described in the Materials and Methods section (see ‘Pos bias’ column in Table 1, and section ‘DNA organization of binding sites’ further on). Finally, for the TFs listed in Table 1, we extended the analysis to all the available ENCODE ChIP-Seq experiments, in cell lines in which NF-Y binding data are missing. The results are also shown in Table 1: in general, most factors indeed showed ubiquitous CCAAT enrichment, but 12 were more cell-type restricted. Since ChIP-Seq for NF-Y in these cell lines are not available, further verification based on peak overlap was not possible.
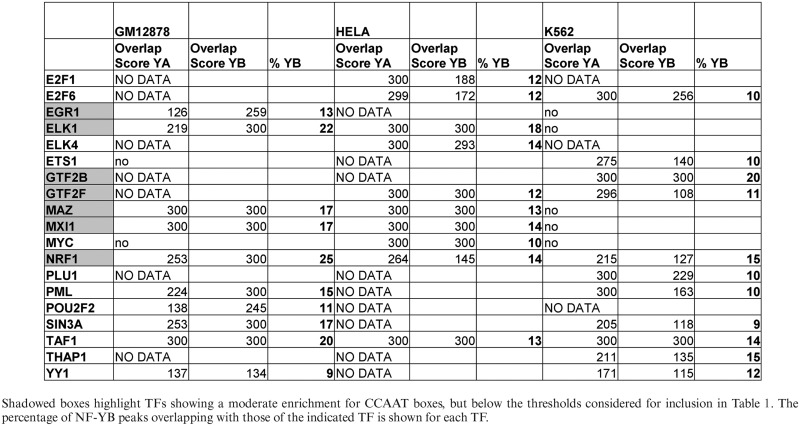
From the results of the general peak overlap analysis, we also noticed 19 additional factors with a significant co-association with NF-YA and NF-YB peaks (and overlap > 10%), but no enrichment for CCAAT boxes in PscanChIP analysis, according to the stringent significance threshold we employed (Table 2 and Supplementary Table S2). We considered this group to be relevant for the following reasons: (i) The analysis of PscanChIP did anyway show moderate enrichment of CCAAT boxes in the peaks of 8 TFs. (ii) A total of 10 out of the 11 sequence-specific TFs show significant overlap in more than one cell line, NRF1 and TAF1 in all three. (iii) There are additional members of families sharing common structural features, or subunits of complexes, of those found to be enriched for the CCAAT box (Table 1): E2F1/E2F6 (E2F4), EGR1 (Sp1/Sp2), ELK1/ELK4/ETS1 (ELF1/GABP/SRF), MYC/MXI1 (MAX/USF1/USF2), GTF2B, GTF2F1 and TAF1 (TBP). Therefore, we decided to add them to the downstream analyses performed.
Table 2. Other transcription factors and co-factors with significant overlap with NF-Y peaks, but without significant CCAAT box enrichment in the three cell lines analyzed.
|
Different groups of factors co-associate with NF-Y locations
The different degrees of NF-Y co-association resulting from the combination of CCAAT enrichment and peak overlap analyses suggest that the TFs identified can be partitioned in three groups (summarized in Figure 2):
Figure 2.

Classification of factors in three groups according to enrichment of CCAAT boxes in their peak regions, and the overlap of the latter with both NF-YA and NF-YB peaks. Group 1 TFs have both global enrichment of CCAAT boxes and widespread overlap with NF-Y; Group 2 more limited enrichment and overlap; Group 3 TFs have significant overlap with both NF-YA and NF–YB but no significant CCAAT enrichment.
Group 1: TFs showing ‘global’ enrichment for the CCAAT box as primary or secondary motif, and overlap of the NF-Y/TF peaks >20% in at least one data set (red and orange in Table 1).
Group 2: TFs with only ‘local’ CCAAT box enrichment (Light green in Table 1) and/or lower peak overlap (<20%). Some factors do show ‘global’ enrichment in HepG2 or hESCs (ARID3A, ATF3, MAX and SRF) but inclusion in this group, rather than in the first, is due to the fact that it is impossible to verify the overlap with NF-Y peaks in these cells for the lack of ChIP-Seq data for NF-Y.
Group 3: all the factors with significant peak overlap but no significant enrichment for the CCAAT box (summarized in Table 2).
General transcription factors TAF1 (TFIID), GTF2B and GTF2F1 are in the third group, while TBP is in the first. TFs belonging to different DNA-binding domain families are variously grouped: (i) Basic-Leucine Zipper FOS, NFE2, ATF1/ATF3 (that have similar binding site matrices), C/EBPb, NRF1. (ii) Zinc Fingers Sp1, Sp2, Znf143, EGR1, MAZ. (iii) b-HLH TFs USF1/2 in Group 1, Max, MXI1 in 2 and MYC in 3. (iv) TFs with ETS DNA-Binding Domain -ELF1, ELK1, ELK4, GABP, ETS1 and SRF- are split between Group 1 and 3. For FOS, IRF3, RFX5 and PBX3, all in Group 1, NF-Y is the primary site in the overlapping binding regions. All E2Fs family members tested by ENCODE (E2F4, E2F1 and E2F6) are present in one of the groups. As for cofactors, CHD2 and HCFC1 are in Group 1, and CoREST does have CCAAT as primary binding site in overlapping regions in Hela-S3, BRCA1 as secondary; KDM5B, SIN3A and PML have significant overlap and are in Group 3.
Multiple factor co-association modules
Given the TFs that showed significant co-association with NF-Y, we determined whether there were further multiple associations among them, that is, which ones tended to group together to form distinct regulatory modules when binding with NF-Y. Starting from regions bound by NF-YB, we computed for each pair of ENCODE TFs the number of peak summits pairs (one for TF) that were located within 150 bps from one another within the same NF-YB peak summit. In this way, we were able to compute a co-association score for each pair of TFs within NF-YB bound regions (see Materials and Methods), expressing the tendency of the two TFs to co-associate with NF-Y, and, in turn, to cluster together within the same regions when binding DNA together with NF-Y. We represented the results of this analysis with a matrix built according to the pairwise co-association scores (Supplementary Table S3).
In order to extend these co-associations to more than two pairwise TFs, we clustered the TF co-association matrix (see Materials and Methods), thus highlighting groups of multiple TFs that tend to co-localize when binding together with NF-Y. We present the results using heatmaps (Figure 3), where the intensity of color in cell (x,y) is proportional to the co-association score between transcription factors x and y within NF-YB peaks. We included in this analysis peaks of NF-YA, having very high overlap with those of NF-YB (30). The co-association of NF-YA with the other TFs in the heatmap reflects the degree of overlap of each of the latter with NF-Y itself (NF-YA+ and NF-YB+): thus, clusters with the highest correlation with NF-YA are those that in turn have the strongest co-association with NF-YB and hence NF-Y in general.
Figure 3.

Heatmap showing pairwise co-association of TFs within NF-YB bound regions, according to ChIP-Seq peak overlap in the three cell lines studied. Intensity of color in cell (x,y) is proportional to the co-association score between transcription factors x and y within NF-YB peaks, ranging from white (no significant co-association) to darker shades of blue (more significant co-associations). Rows and columns are clustered according to the respective correlations: hence, clustered TFs tend to bind together and have the same global pattern of association with the other TFs within NF-YB bound regions. Colored boxes highlight relevant clusters further discussed in the text.
In K562, where the largest number of experiments was available, NF-YA is closely linked with a cluster containing Group 1 factors, notably FOS, Sp1, Sp2 and CHD2, that in turn have a very high degree of pairwise association and form the strongest cluster (highlighted in red in Figure 3). Notice that for all these factors sequence analysis had indicated the CCAAT box as primary binding motif. A much larger cluster, with less significant correlation with NF-YA, is the one highlighted in green, composed by TFIID (TBP/TAF1), E2F4, ELF1/GABP, MAZ, EGR1, that shares MAX, ETS1, E2F6, PML, KDM5B/PLU1 and Sin3 with Max/MXI1, and at the same time shows a good correlation with the FOS-Sp1-Sp2-CHD2 cluster as well. Other relevant clusters are those formed by GTF2B/GTF2F, ATF3/USF1/USF2 and the one formed by Znf143 and Six5 (yellow box in the heatmap).
In GM12878, NF-YA is once again strongly associated with a FOS-Sp1-CHD2 cluster (red), as in K562, in this case joined also by PBX3 and RFX5, all Group 1 TFs. Note that data for Sp2 were not available in this cell line. Group 1 Six5/Znf143 also show the strong correlation found in K562. A large group with ELF1/ELK1, E-box TFs, PML, SIN3A and TBP is also observable, forming a cluster overlapping with the one identified in K562 (green color) with also a good correlation with CHD2, Sp1 and RFX5. It is also possible to single out two additional clusters, both visible in Hela as well, formed by JunD plus C/EBPb and BRCA1 plus CoREST, with a low co-association with NF-YA reflecting the results obtained by the sequence analysis for which the enrichment of CCAAT box motifs was lower.
In Hela cells, where less data sets were available for this analysis, there is again a cluster where FOS is joined by another Group 1 TF, IRF3, but a weaker association with NF-YA and other clusters formed by the E2F family members, by ELK1/4, and the larger subgroup comprising E-box TFs, GTFs, CHD2, MAZ, RFX5, BRCA1 and CoREST. Although ending up clustered elsewhere, Group 1 CHD2 and RFX5 keep however some correlation with the FOS/IRF3 pair. This could also be the effect of the lower co-association for both with NF-YA and NF-YB in this cell line, and also of the lower number of experiments available, that makes the computation of correlations used in clustering to be based on less complete data. In summary, Group 1 TFs tend not only to connect to NF-Y singularly, but also to be clustered together binding the same regions and forming a single regulatory module, further supporting the classification made above, with some notable cell-type specific preferences.
DNA organization of binding sites
In regions bound both by NF-Y and by another TF, we computed at the single base pair level the distribution of the distance between the respective binding sites, including the possible presence of more than one CCAAT box motif within the same region. This was done only with Group 1 and 2 factors, because of the lack of CCAAT enrichment in Group 3. A positive control was the preferential E-box (CACGTG)-CCAAT box distance, previously identified by us to be 10–12 bps (30). PscanChIP indeed recovered the same CCAAT-E-box bias within regions shared by NF-Y and USF1/2 and MAX, but not with MYC, nor MXI1. In general, 17 out of the 29 Group 1 and 2 factors showed some significant distance bias, and conserved throughout different cell types (see also column ‘Pos bias’ of Table 1). The detailed results are shown in Figure 4. The origin of the coordinates corresponds to the central ‘A’ of the best instance of the CCAAT box in the regions. We plotted for each TF studied the number of times the leftmost (if downstream) or rightmost (if upstream) nucleotide of the respective binding site motif was found to a given distance from the central ‘A’ of CCAAT. As in previous work (10), the distance was computed with respect to the best occurrence of the motif found with a PscanChIP score greater than 0.8 for all factors except Sp1 and Sp2, which have a less conserved binding site motif and for which the threshold employed was 0.9. We used as threshold 0.85 for both instances of the motif as threshold for the presence of a ‘double’ CCAAT. For each TF other than NF-Y, we employed as motif descriptor the JASPAR database (50) matrix associated with it derived from the respective ChIP-Seq experiments, otherwise the ones derived from large scale experiments, like SELEX that showed the greatest enrichment in the analyzed regions.
Figure 4.

Distribution of the distance of binding sites for TFs showing a positional bias with respect to CCAAT boxes in the peak regions bound by both the TF and NF-YB in the K562 cell line (left), and for TFs with CCAAT enrichment but without positional bias (right). The distance is computed from the middle A of CCAAT. For Six5, the full line refers to the Znf143 motif and the dotted line to a E-box.
It is possible to trace a modest positional preference in many cases, some overlapping the CCAAT box itself, as for C/EBPb, MafK, RUNX3 and RFX5. The latter has been connected with NF-Y, and a conserved distance of their respective sites has been already shown in the MHC Class II promoters/enhancers (64), it includes a peak at 29 bps with these locations, but it is also present with additional distances. Other TFs show predominant and almost exclusive distance bias, such as E-box binding TFs and Znf143. Six5 shows two sharp peaks, one for an E-box corresponding to the locations of USF1/2, but not MAX, at 12 bps from the CCAAT, and one for Znf143 at 36 bps: indeed, Six5 and Znf143 formed a strong cluster in the co-localization analysis. This configuration is often found in NF-Y-bound repetitive sequences of the LTR12 ERV9 family (26,30).
In the results of this analysis, an interesting feature could be observed with Group 1 factors FOS, IRF3, Sp2 and Sp1, which, as previously discussed, together form the strongest cluster associated with NF-Y and had the CCAAT box as primary sequence motif: the regions they bind together with NF-Y contain a configuration of two CCAAT boxes usually separated by 24–28 and 35–37 bps (Figure 5). The same holds true for PBX3 (for which the CCAAT box was the primary binding site in overlapping regions as well) and RFX5 (in GM12878, given the limited number of overlap regions in K562). Sp1 shows an additional module where the two binding sites are at 19 bps of distance. A closer look at the FOS peaks revealed the additional presence of E-boxes between the two CCAAT, and the complete absence of AP1 motifs as previously mentioned. Factors PBX3, RFX5, Sp2 and Sp1 do show some enrichment of GC-rich Sp1 sites between the two CCAAT boxes, and IRF3 has a combination of E-boxes and Sp1 sites. Overlap with the other ENCODE ChIP-Seq experiments available revealed that Sp1 and MAX result to be the factors binding these sites located around the double CCAAT area. A similar situation can be also observed for IRF1 in stimulated K562 cells (data not shown). In general, these double CCAAT sites are enriched in promoters and, for FOS, they are the binding sites for the transcriptionally active AP1-less locations termed ‘proximal-HOT’ devoid of other B-Zip partners (29). We remind that since these analyses were performed on regions resulting to be bound by both NF-Y and each one of the other factors in ChIP-Seq experiments, these multiple CCAAT modules can be reliably considered to be bound by NF-Y in vivo.
Figure 5.

Distribution of the distance between two bona fide CCAAT boxes for TFs with the CCAAT box as primary binding site, in the peak regions which overlap NF-YB bound regions; the distance is computed from the middle A of CCAAT. Additional enriched motifs with significant positional bias with respect to the CCAAT box are also shown (Sp1 binding site for Sp1, Sp2, RFX5 and IRF3; E-boxes for FOS, IRF3 and PBX3). The analysis was performed for all TFs in the K562 cell line, and in GM12878 for RFX5 and PBX3. The bottom plot shows the overall distance of double CCAAT boxes all in K562 NF-Y-bound regions containing two bona fide CCAAT boxes.
We also searched for instances of multiple CCAAT boxes in all NF-YB peaks, independently from the presence of additional TFs. Overall, we found that a large number (almost half in K562) of the NF-Y bound regions contained two reliable instances of the motif within 75 bps from the peak summit. The distance plot between those double CCAAT boxes showed, predictably, peaks at 24–27 and 36 bps distance, already found in the locations shown above. That is, about one half of the double CCAAT NF-Y bound regions were in turn associated with regions bound also by one or more of the TFs just discussed. However, two important differences emerged: an additional peak at 43 bps, which is much less evident in regions bound by the FOS/IRF3/Sp2/Sp1/RFX5/PBX3 modules, and a prominent peak at 19 bps, which is completely absent for all these TFs, but Sp1. Further analysis clarified that these latter double CCAAT boxes are mostly present in LTR repetitive sequences of the ERV1 family (29). Thus, essentially three main classes of double CCAAT locations exist: 19 bps apart, mainly located in repetitive sequences; 26 and 36 bps apart, that serve for the FOS/IRF3/Sp1/Sp2/RFX5/PBX3 module, in cooperation with the E-box or GC-rich sites; 43 bps apart, for which it remains to be seen which are the TFs—if any—more strongly associated.
NF-Y requirement for recruitment of E2F4, C/EBPb and ELK4
CCAAT-binding by NF-Y has already been shown to be required for the recruitment of numerous TFs and cofactors (33–46). The widespread co-occurrence of NF-Y with other TFs identified here, and the organization of binding sites on DNA, suggests that they are likewise recruited via NF-Y. To bring further pieces of evidence for this hypothesis, we inactivated the NF-YB subunit in Hela cells by shRNA. Then, we studied the binding of three TFs—E2F4, C/EBPb and ELK4—one representing each of the Groups, in ChIP assays on a set of genomic locations selected according to the presence of peaks overlapping with NF-YB in ChIP-Seq data (see Materials and Methods). Also, genes encoding for each of the selected TF were monitored to have CCAAT-less promoters. Note that the results could be interpreted either as direct binding of the TFs with NF-Y, or an indirect association via the binding of additional complexes. Specifically, we tested E2F4 because it is one of the few Group 1 TFs without a positional bias of its binding site motif, thus possibly independent from NF-Y binding, and ELK4 as a member of a large family present in all the three Groups, not previously associated to NF-Y activity. The results of qPCRs are shown in Figure 6: we obtained a partial reduction of NF-YB, as assessed by Western blot analysis, whereas the nuclear levels of the three TFs were not changed (Figure 6A); in ChIPs, qPCRs show that the levels of NF-YB binding to CCAAT promoters decreased in NF-YB shRNA-treated cells with respect to scramble shRNA controls. The degree of the decrease matches the levels of NF-YB inactivation. CCAAT-less promoters -ZFPL1, CARS, PALMD, EGR2- were negative for NF-Y binding, as expected (Figure 6B). E2F4 binding followed well the decrease of NF-Y binding, except in the NF-Y-negative ZFPL1 promoter used as control. Group 3 member ELK4 showed a similar behavior on INCENP and PNN, but not on LTN1 and ING1, in which ELK4 binding was unaffected or slightly increased after NF-YB removal. Finally, C/EBPb binding was decreased, but we noticed that two control CCAAT-less targets also showed decreased binding, albeit to a lesser degree. Since C/EBPb levels are unchanged in NF-YB-inactivated cells, there appears to be some indirect effect, at least partially affecting C/EBPb binding.
Figure 6.

Requirement of NF-Y for promoter recruitment of E2F4, C/EBPb and ELK4. (A) Western blot of nuclear extracts of Hela cells infected with control scramble and NF-YB shRNA with the indicated antibodies. (B) qPCR analysis of ChIP experiments performed on Hela cells treated as in A, over two biological replicates. The CCAAT and CCAAT-less core promoters regions bound by E2F4, C/EBPb and ELK4 according to ChIP-Seq data are amplified, and the enrichment of NF-YB, E2F4 (Upper), C/EBPb (Middle) and ELK4 (Lower) measured. Binding of both NF-YB and each of the TFs in NF-YB inactivated cells is compared to the respective binding in control Hela cells (C), which is set at 100 for both.
In summary, in line with the above categorization, these data further support the different degrees of co-association identified by our analysis, indicating that the importance of NF-Y for DNA binding by Group 1 E2F4 is more pervasive than for C/EBPb and ELK4.
Protein–protein interactions
The presence of co-binding with precise spatial arrangements of different TFBSs is an indicator that the respective TFs might directly contact each other, in turn a possible requirement for synergistic transcriptional regulation. We surveyed the BIOGRID repository of published protein–protein interactions, and added curated data from the literature of NF-Y interactors (see Materials and Methods): 17 proteins, or subunits of complexes, interacting with NF-Y are among the factors studied in this work. Of the 48 factors with significant genome-wide peak overlap with NF-YB according to our criterion, 11 are reported as direct NF-Y interactors (Supplementary Table S4). For comparison, of the other 106 ENCODE factors only 6—GCN5/KAT2A, p300, c-Jun, GATA2, ATF2 and BCL11A—have been reported to interact. Among NF-Y interactors, C/EBPb, FOS, Sp1 and USFs showed positional bias for their sites with respect to the CCAAT box, suggesting that the DNA spacing we detected is indeed associated with direct protein–protein interactions. We also retrieved from BIOGRID all protein–protein interactions among all the 48 factors associated with NF-Y, and constructed a network grid: here, again, we noticed a higher density among factors of Group 1 and with a positional bias with respect to the CCAAT box (Supplementary Figure S1). Although further direct protein–protein interactions studies with the TFs identified here with recombinant proteins are required, these data are in general agreement with the model proposed, and reinforce the idea that co-binding on DNA and specific distance biases of the sites are coupled by direct interactions with specific protein domains in NF-Y-TFs modules.
Functional analysis of co-localizations
We processed expression profiling data upon NF-YA functional inactivation by shRNA in Hela-S3 cells (see Materials and Methods) in order to single out genes significantly increasing or decreasing their expression as a consequence. This yielded 1492 down- and 1500 up-regulated genes. Considering proximal core promoters of these genes (−450/+50 from TSS), we derived the lists of differentially expressed genes bound by NF-YB, as well as of those co-bound by NF-YB and each of the TFs correlating with NF-Y in Hela-S3 cells. We performed a gene-ontology (GO) enrichment analysis on each gene list. The most relevant GO terms for each NF-Y/TF combination are shown in Supplementary Table S5A: this allowed for the selection of the NF-Y/TF combinations bound to core promoters in the three cells lines with clear enrichment of selected GO terms (Supplementary Table S5B).
We then categorized the data as a function of NF-Y-dependence. Figure 7 shows, for each enriched GO category, genes belonging to the category split between NF-Y up- and down-regulated, as well as which TFs are significantly associated with NF-Y on the promoters of the genes in the category. Up-regulated genes are those found repressed upon NF-Y inactivation, and vice versa for down-regulated ones. The complete set of genes selected is shown in Supplementary Table S6. It is evident that G2/M genes—annotations mitotic cell cycle, spindle, M phase— as well as DNA replication are mostly positively affected by NF-Y and the E2F1/4 module. Vice versa, in NF-Y repressed categories—nucleosome, protein DNA complex, chromatin organization, ZNF genes—only E2F4 is present: this fits with the dual role of E2F4 as an activator and repressor, and the activating role of E2F1. We find B-Zip TFs JunD, MafK and C/EBPb mostly on NF-Y repressed genes. RFX5 is also present, but its distribution is more widespread. E-box TFs show little polarization with respect to NF-Y function, with the exception of MYC, which is skewed toward activated categories and on RNA metabolism terms, with the exception of mitochondrion. ETS TFs are found on activated categories ATP and nucleoside binding, ribonucleotide complex and translation. As for cofactors, CHD2 is widespread, whereas BRCA1 is absent in the NF-Y activated categories, and present in terms related to nuclear transactions (DNA and RNA metabolism).
Figure 7.

Dependence on NF-Y of genes with promoters bound by NF-Y and other TFs, grouped according to GO categories. Left: GO categories found to be enriched in genes bound by NF-Y in combination with the other TFs in the promoter of HeLa cells (the whole data set is available as Supplementary Table S6). Middle: proportion of genes induced or repressed by NF-Y (induced: showing repression upon NF-Y inactivation; vice versa repressed) in each group. Right: TFs enriched together with NF-Y in the promoters of each group.
DISCUSSION
We analyzed in detail the correlations of NF-Y with the complete set of available ENCODE data, yielding 48 proteins whose binding showed a substantial link to NF-Y, supported both by sequence analysis and peak overlap. A further classification of factors supported by co-association clusters, in vivo ChIP experiments after NF-YB inactivation and protein–protein interaction data, yielded three Groups, which are further discussed.
Group 1
Sequence-specific TFs represent the majority of factors present in Group 1. Results include previously reported observations on co-associations with E-box binding TFs (30), extended to other cell lines. More importantly, several novel associations were brought into light. Sp1 peaks do show a canonical binding site at a preferential distance of 10 bps 5′ and 3′ of a CCAAT box, a distance in line with a general sequence analysis of CCAAT promoters (10), and within the range of the extensive DNA contacts (25/28 bps) made by the HFD subunits of the NF-Y trimer. ChIP-Seq in mouse MEFs and HEK293 cells showed a significant enrichment of CCAAT boxes in Sp2 peaks (47,61), which is thus confirmed by our analysis. Using the elegant system of mouse Sp2 KO ES cells overexpressing different Sp2 mutants, it has been demonstrated that the Q-rich activation domain of Sp2, not the Zn finger DNA-binding domain, is required for NF-Y-mediated recruitment to CCAAT promoters (47). NF-Y and Sp1 interact directly (65–67) and the parts mediating binding are indeed Sp1-B and NF-YA/NF-YC Q-rich activation domains: intriguingly, these domains show a traceable phylogenetic resemblance (68). Both interacting regions of NF-Y undergo alternative splicing (31,69), producing isoforms with different and specific cooperativity with Sp1 family members (70). Our finding that precisely spaced pairs of CCAAT boxes bound by NF-Y are present in Sp2, and to some extent, Sp1 peaks, mostly located within promoters, is a further step in the fine definition of this regulatory module, present in many promoters.
The widespread intersection of FOS with NF-Y sites already reported in K562 (29,30), is confirmed in other cell types. Importantly, we define here the double CCAAT arrangement required in such peaks, which is not found in the peaks of the related FOSL1 and FOSL2, that do not overlap significantly with NF-Y sites. FOS is known to bind as a heterodimer with other members of the B-Zip family to AP1 sites: the lack of AP1 sites in FOS/NF-Y locations indicates that B-Zip partners absent in ENCODE are likely not involved in the interaction. The recruitment of FOS is rather unique among B-Zip proteins, which are mostly found in Group 2 with AP1 sites, and it could be due to protein–protein interactions with NF-Y (29). It is possible that, as for Sp2, activation domains, instead of DNA-binding domains might be involved.
RFX5 is a member of the RFX family binding to the X box, an element originally discovered in MHC Class II genes, along with the Y box (64). The MHC Class II X box is recognized by RFX5, RFX-ANK and RFXAP (71). NF-Y cooperates with RFX5 (55,72), with direct protein–protein interactions (55,56). The relative distance is conserved and functionally essential, and this configuration is inactive without the tissue-specific co-activator CIITA. The X box motif is indeed present in RFX5 peaks (27), but the (double) CCAAT box is highlighted as the primary binding site in our analysis when RFX5 co-localizes with NF-Y. Thus, the RFX5/NF-Y partnership, shown to be functional in highly specific gene sets, is more generally widespread and their overlap is second only to FOS. Surprisingly, the role of NF-Y in such units is not invariably associated to genes whose expression decreases after NF-YA inactivation, as in the case of MHC Class II.
Two more TFs associated to the double CCAAT box motif are IRF3 and PBX3. IRF3 is involved in transcriptional regulation of immune response genes (73), and it is devoid of the expected IRF binding motif (28). The double CCAAT motif can also be observed in stimulated K562 cells data of the related IRF1 (data not shown). IRF3 is present both in the most activated (mitosis, organelle fixation) and repressed (nucleosome, protein DNA complex, ER lumen) functional categories associated with NF-Y, suggesting that it might positively or negatively impact on NF-Y function. PBX3 is a TALE homeodomain TF expressed during development, which controls patterning and differentiation. Recently, PBX3 expression was linked to the development of acute myeloid leukemias (AML), in conjunction with specific HOXAs. CCAAT boxes were also found enriched in the peaks of PBX1, a TF similar to PBX3, when associated with Prep1 (74): hence, this link might hold true also for other family members. Analysis of ENCODE data detected NF-Y binding sites in regions bound by Sp1 and PBX3 (75).
The analysis of ENCODE data has generalized the concept that some TFs are tethered to DNA via association with other TFs, in addition to their own target (26,28). We found here that the double precisely spaced CCAAT module is the landing platform of Group 1 TFs FOS, Sp2, Sp1, RFX5, PBX3 and IRF3, when these TFs bind DNA together with NF-Y. In general, these data support the presence of specific multi-protein complexes associated with the multi-CCAAT platform. Promoters of cell cycle regulated genes with multiple CCAAT boxes were originally described as repressed upon wild-type p53 activation—and vice versa activated by mutp53—in the apparent absence of p53REs (76). The 26–30 bps distance found here corresponds to such promoters, many of which are of cell-cycle genes, and it is specifically predominant, together with the 36 bps distance. TFs found to recognize this NF-Y platform share with p53, and family members, the capacity to influence growth decisions. While Sp1, Sp2 and RFX5 peaks are found with some Sp1 motifs between the two CCAAT, FOS and PBX3 have an enrichment of E-boxes, IRF3 a combination of both TFBSs: this shows that each TF has additional specific requirements within these modules. The 19 bps distance is only found in LTR sequences. Note the complete absence of double CCAAT boxes closer than 19 bps, which fits perfectly with the minimal distance requirement for double NF-Y binding, originally determined by in vitro experiments (77), and recently rationalized by the 3D NF-Y/CCAAT structure (17).
All E2Fs family members analyzed by ENCODE are correlated with NF-Y, not only in cell cycle regulated genes, but also in genes with different functional annotations. E2F4, shows the strongest link, and the requirement of NF-Y for efficient promoter association (Figure 6). The NF-Y-E2F4 partnership is complex and associated with different functional outcomes: repression in nucleosome and protein DNA complex genes, activation in DNA replication and mitosis genes. We find a limited enrichment for the canonical E2F binding sites in E2F1/4/6 sites, in accordance to previous reports (62,78). Several non-mutually exclusive explanations were brought forward: E2Fs could be recruited via indirect tethering by unrelated TFs, such as NF-Y and E-box binding TFs. E2Fs could bind in vivo to variations of the in vitro characterized motif; a third possibility is that E2Fs are part of larger complexes, with different DNA-binding specificity. The case of E2F4 binding to G2/M promoters is likely explicative: they work through multiple evolutionarily conserved CCAAT and CDE-CHR elements, which are controlled by the DREAM complex, of which E2F4 is a subunit (79). Since the DREAM subunits B-MYB, Lin-9, and Lin-54 bind DNA, it is likely that the specificity of E2F4 is modified by these subunits. Thus, the lack of preferential distances between CCAAT boxes and E2F sites should be re-evaluated once the variety of E2F motifs are dissected, and genomic locations of DREAM subunits are collected. A step in this direction was the reported enrichment of CCAAT boxes in the locations bound by FOXM1, a protein that helps DREAM activity (80).
Group 2
In Group 2 the most abundant class of factors are B-Zip TFs: (i) JunD, MafF/K band ATF1/3 which have AP1, CRE or related sequences in the majority of their peaks. (ii) C/EBPb, whose robust overlap with NF-Y was somewhat expected, since several promoters are already known to be co-activated by NF-Y and C/EBPs (81–83). NF-Y was shown to directly interact with several B-Zip TFs like ATF3 (54), c-Jun (84) and ATF2/6 (67,85–88).
A novel class connected with NF-Y is ETS domain proteins, which all recognize a similar, albeit not identical motif (89). All members of this class analyzed by ENCODE (GABP, ELK1, ELF1, ELK4, ETS1, SRF) are present in our list; only some (ELF1, GABP, SRF) show enrichment for CCAAT boxes in their peaks. There are two common features in this family: the first is that none is ubiquitously present: ELF1 is present in 3 of 4 cell lines, GABPA in 1 of 6, ELK4 in 3 of 7, ELK1 and ETS1 in 2 of 3. In most cell lines, there is one or more ETS TF associated with NF-Y, but never all of them. The second is that their binding motif shows no distance bias with respect to the CCAAT box, and indeed their binding appear to be relatively independent from NF-Y, in the ChIP experiments of Figure 6. They are co-associated in functional categories of cytoplasmic transactions, with the exception of DNA repair, in promoters well balanced between NF-Y activation and repression. Interestingly, dissection of the genomic ERK2 pathway in hESCs identified pivotal ELK1 sites, further validated by ChIP-Seq experiments, as well as CCAAT boxes and Sp1, E2F, NRF1 TFBSs (90). Thus, this set of TFs might be particularly relevant in signaling pathways.
The NF-Y link to the zinc finger protein Znf143 is novel and potentially important, as they are both clearly essential for Six5 binding (note their tight clustering in K562 and GM12878 cells shown in Figure 3) with a very precise spacing; the composite sites often include E-boxes in intervening positions. Many of these sites are in repetitive sequences of the LTR ERV9 subfamilies. Interestingly, both MAZ and SIX family members, including Six5, are involved in the differentiation of muscle cells (91,92).
As for cofactors, BRCA1, which is often associated with CoREST and RFX5 in HeLA-S3 data, was implicated in the transcriptional regulation of the GADD45 promoter, notably through the interplay between CCAAT/NF-Y and OCTA/POU2F (93). The NF-Y association in Hela-S3 is in genes involved in nuclear and cytoplasmic transactions, often with PML (RNA-binding, ATP binding, nucleosome and DNA-binding complex), in which NF-Y is generally repressive. BRCA1 is involved in DNA replication and recombination, KDM5B in DNA-repair and indeed required for recruitment of BRCA1 at sites of homologous recombination (94): these links might hint at a possible role of NF-Y in DNA metabolisms other than transcription, an aspect poorly investigated so far, but certainly worth to be explored in the future.
Group 3
GTFs are prominent in this group. They are known to bind near TSSs, and their overlap with NF-Y regions was somewhat expected, given NF-Y typical promoter location at −60/−100 from TSSs. The co-associations of TATA-binding TBP, of the TFIID subunit TAF1 (>60% of overlap in the three cell lines) and of GTF2B (TFIIB), known to associate to TBP/TATA complexes, resulted in fact to be significant. Note that TBP, the one GTF with clear sequence-specificity, is in Group 1. NF-Y physical interactions with several subunits of TFIID were reported (95), although TAF1 was not tested. In most of these NF-Y/GTFs clusters, RNA Pol II is also present (>70%) and the genes are transcriptionally active. Indeed, NF-Y binding sites were among the most enriched ones in RNA Pol II peaks in PscanChIP analysis of 17 out of the 21 ENCODE Pol II data sets (Not shown). In addition, the RNA Pol II associated GTF2F1 (TFIIF) is also well correlated to NF-Y peaks. Note that ChIP experiments after NF-Y removal supported a role of NF-Y in RNA Pol II recruitment to ER-stress promoters (96), suggesting that it is important for the landing of at least some components of the GTF machinery on the core promoter, prior to induction of RNA synthesis.
NRF1 is a b-Zip CNC (Cap-‘n’-Collar) TF important for the activation of genes involved in mitochondrial pathways (97): in ENCODE data, the two binding motifs overlapped significantly in the respective ChIP-Seqs (see also Supplementary Figure S8 (26)), while a study in MCF7 cells showed a lack of CCAAT boxes in NRF1 controlled genes, as well as non overlapping cofactors dependence (8). Our analyses agree upon the modest co-occurrence of NF-Y motifs in NRF1 sites, but we do detect a significant co-occurrence of peaks: we tend to interpret these results as a sign that the two TFs co-regulate selected groups of promoters, among which G2/M genes (8,98).
Of the more than 30 transcriptional co-factors analyzed so far by the ENCODE project, only a few are significantly associated to NF-Y, including the four proteins involved in the regulation of methylations of histone H3K4, major epigenetic marks positioned on open chromatin. Plu1/KDM5B, a demethylase of H3K4me3, is in Group 3. It was shown to be associated to promoters and enhancers of ES cells TFs, notably SOX2, OCT4 and Nanog (99), to prevent spreading of H3K4 methylations to the body of the gene. Given the co-association of NF-Y with such ESCs TFs (34), it is reasonable to suggest a link with KDM5B in such cells as well. The other H3K4me3 regulators are in Group 1 (HCFC1 and CHD2) and Group 2 (CoREST). HCFC1, originally identified as a co-activator of viral proteins, interacts with MLL complexes, the ‘writers’ of these marks (90); E2Fs activity is dependent upon HCFC1, notably in cell-cycle promoters (100,101). HCFC1 peaks were shown to be enriched in Znf143, Thap11, YY1 and GABP motifs (93), and indeed we find here that Znf143, GABP, YY1 and NF-Y peaks significantly overlap. CoREST recognizes nucleosomes through the SWR domain (102) and is part of repressive complexes that demethylate H3K4me2, although it is also associated with androgen-dependent activated genes (103). Finally, CHD2 is a member of a large family of helicases involved in chromatin remodeling; the highly related CHD1 is known to be a ‘reader’ of the H3K4me3 mark (104,105): the overlap with NF-Y is only observed for CHD2, indicating some specificity in the interplay. The strong correlations of NF-Y with epigenetic marks were reported earlier, in genomic studies (29,30,32) and in cause/effect experiments upon NF-Y inactivation (17,38,71). Overall, the data reinforce the role of NF-Y in recruiting proteins that control—positively and negatively—H3K4 methylations.
The conclusions reached in this study will impact the biochemical characterization of NF-Y/TFs interplay on DNA: our recent description of the three dimensional structure of NF-Y bound to a single CCAAT box will be extended to include the double CCAAT platform, according to the rules established here. In addition, the availability of 3D structures of NF-Y, as well as of some of the identified HLH, B-Zip, HD and ZNF TFs, with the respective DNA sites, will allow molecular modeling of the interplays and the reconstruction of interactions by structural biology approaches, according to priorities derived by the categorization described here.
Supplementary Material
FUNDING
Funding for open access charge: Italian Consiglio Nazionale delle Ricerche (CNR) flagship project ‘EPIGEN’ (to G.P.); AIRC [14130 to R.M.].
Conflict of interest statement. None declared.
REFERENCES
- 1.Suzuki Y., Yamashita R., Shirota M., Sakakibara Y., Chiba J., Mizushima-Sugano J., Nakai K., Sugano S. Sequence comparison of human and mouse genes reveals a homologous block structure in the promoter regions. Genome Res. 2004;14:1711–1718. doi: 10.1101/gr.2435604. [DOI] [PMC free article] [PubMed] [Google Scholar]
- 2.Fitzgerald P.C., Shlyakhtenko A., Mir A.A., Vinson C. Clustering of DNA sequences in human promoters. Genome Res. 2004;14:1562–1574. doi: 10.1101/gr.1953904. [DOI] [PMC free article] [PubMed] [Google Scholar]
- 3.Xie X., Lu J., Kulbokas E.J., Golub T.R., Mootha V., Lindblad-Toh K., Lander E.S., Kellis M. Systematic discovery of regulatory motifs in human promoters and 3′ UTRs by comparison of several mammals. Nature. 2005;434:338–345. doi: 10.1038/nature03441. [DOI] [PMC free article] [PubMed] [Google Scholar]
- 4.Häkkinen A., Healy S., Jacobs H.T., Ribeiro A.S. Genome wide study of NF-Y type CCAAT boxes in unidirectional and bidirectional promoters in human and mouse. J. Theor. Biol. 2011;281:74–83. doi: 10.1016/j.jtbi.2011.04.027. [DOI] [PubMed] [Google Scholar]
- 5.Lin J.M., Collins P.J., Trinklein N.D., Fu Y., Xi H., Myers R.M., Weng Z. Transcription factor binding and modified histones in human bidirectional promoters. Genome Res. 2007;17:818–827. doi: 10.1101/gr.5623407. [DOI] [PMC free article] [PubMed] [Google Scholar]
- 6.Vardhanabhuti S., Wang J., Hannenhalli S. Position and distance specificity are important determinants of cis-regulatory motifs in addition to evolutionary conservation. Nucleic Acids Res. 2007;35:3203–3213. doi: 10.1093/nar/gkm201. [DOI] [PMC free article] [PubMed] [Google Scholar]
- 7.Yokoyama K.D., Ohler U., Wray G.A. Measuring spatial preferences at fine-scale resolution identifies known and novel cis-regulatory element candidates and functional motif-pair relationships. Nucleic Acids Res. 2009;37:e92. doi: 10.1093/nar/gkp423. [DOI] [PMC free article] [PubMed] [Google Scholar]
- 8.Benner C., Konovalov S., Mackintosh C., Hutt K.R., Stunnenberg R., Garcia-Bassets I. Decoding a signature-based model of transcription cofactor recruitment dictated by cardinal cis-regulatory elements in proximal promoter regions. PLoS Genet. 2013;9:e1003906. doi: 10.1371/journal.pgen.1003906. [DOI] [PMC free article] [PubMed] [Google Scholar]
- 9.Stergachis A.B., Neph S., Sandstrom R., Haugen E., Reynolds A.P., Zhang M., Byron R., Canfield T., Stelhing-Sun S., Lee K., et al. Conservation of trans-acting circuitry during mammalian regulatory evolution. Nature. 2014;515:365–370. doi: 10.1038/nature13972. [DOI] [PMC free article] [PubMed] [Google Scholar]
- 10.Dolfini D., Zambelli F., Pavesi G., Mantovani R. A perspective of promoter architecture from the CCAAT box. Cell Cycle. 2009;8:4127–4137. doi: 10.4161/cc.8.24.10240. [DOI] [PubMed] [Google Scholar]
- 11.Rhodes D.R., Kalyana-Sundaram S., Mahavisno V., Barrette T.R., Ghosh D., Chinnaiyan A.M. Mining for regulatory programs in the cancer transcriptome. Nat. Genet. 2005;37:579–583. doi: 10.1038/ng1578. [DOI] [PubMed] [Google Scholar]
- 12.Sinha S., Adler A.S., Field Y., Chang H.Y., Segal E. Systematic functional characterization of cis-regulatory motifs in human core promoters. Genome Res. 2008;18:477–488. doi: 10.1101/gr.6828808. [DOI] [PMC free article] [PubMed] [Google Scholar]
- 13.Goodarzi H., Elemento O., Tavazoie S. Revealing global regulatory perturbations across human cancers. Mol. Cell. 2009;36:900–911. doi: 10.1016/j.molcel.2009.11.016. [DOI] [PMC free article] [PubMed] [Google Scholar]
- 14.Balwierz P.J., Pachkov M., Arnold P., Gruber A.J., Zavolan M., van Nimwegen E. ISMARA: automated modeling of genomic signals as a democracy of regulatory motifs. Genome Res. 2014;24:869–884. doi: 10.1101/gr.169508.113. [DOI] [PMC free article] [PubMed] [Google Scholar]
- 15.Dolfini D., Mantovani R. Targeting the Y/CCAAT box in cancer: YB-1 (YBX1) or NF-Y? Cell Death Differ. 2013;20:676–685. doi: 10.1038/cdd.2013.13. [DOI] [PMC free article] [PubMed] [Google Scholar]
- 16.Huber E.M., Scharf D.H., Hortschansky P., Groll M., Brakhage A.A. DNA minor groove sensing and widening by the CCAAT-binding complex. Structure. 2012;20:1757–1768. doi: 10.1016/j.str.2012.07.012. [DOI] [PubMed] [Google Scholar]
- 17.Nardini M., Gnesutta N., Donati G., Gatta R., Forni C., Fossati A., Vonrhein C., Moras D., Romier C., Bolognesi M., et al. Sequence-specific transcription factor NF-Y displays histone-like DNA binding and H2B-like ubiquitination. Cell. 2013;152:132–143. doi: 10.1016/j.cell.2012.11.047. [DOI] [PubMed] [Google Scholar]
- 18.Bhattacharya A., Deng J.M., Zhang Z., Behringer R., de Crombrugghe B., Maity S.N. The B subunit of the CCAAT box binding transcription factor complex (CBF/NF-Y) is essential for early mouse development and cell proliferation. Cancer Res. 2003;63:8167–8172. [PubMed] [Google Scholar]
- 19.Luo R., Klumpp S.A., Finegold M.J., Maity S.N. Inactivation of CBF/NF-Y in postnatal liver causes hepatocellular degeneration, lipid deposition, and endoplasmic reticulum stress. Sci. Rep. 2011;1:136. doi: 10.1038/srep00136. [DOI] [PMC free article] [PubMed] [Google Scholar]
- 20.Bungartz G., Land H., Scadden D.T., Emerson S.G. NF-Y is necessary for hematopoietic stem cell proliferation and survival. Blood. 2012;119:1380–1389. doi: 10.1182/blood-2011-06-359406. [DOI] [PMC free article] [PubMed] [Google Scholar]
- 21.Yamanaka T., Tosaki A., Kurosawa M., Matsumoto G., Koike M., Uchiyama Y., Maity S.N., Shimogori T., Hattori N., Nukina N. NF-Y inactivation causes atypical neurodegeneration characterized by ubiquitin and p62 accumulation and endoplasmic reticulum disorganization. Nat. Commun. 2014;5:3354. doi: 10.1038/ncomms4354. [DOI] [PubMed] [Google Scholar]
- 22.Lu Y.H., Dallner O.S., Birsoy K., Fayzikhodjaeva G., Friedman J.M. Nuclear Factor-Y is an adipogenic factor that regulates leptin gene expression. Mol. Metab. 2015;4:392–405. doi: 10.1016/j.molmet.2015.02.002. [DOI] [PMC free article] [PubMed] [Google Scholar]
- 23.Dolfini D., Gatta R., Mantovani R. NF-Y and the transcriptional activation of CCAAT promoters. Crit. Rev. Biochem. Mol. Biol. 2012;47:29–49. doi: 10.3109/10409238.2011.628970. [DOI] [PubMed] [Google Scholar]
- 24.ENCODE Project Consortium. An integrated encyclopedia of DNA elements in the human genome. Nature. 2012;489:57–74. doi: 10.1038/nature11247. [DOI] [PMC free article] [PubMed] [Google Scholar]
- 25.Gerstein M.B., Kundaje A., Hariharan M., Landt S.G., Yan K.K., Cheng C., Mu X.J., Khurana E., Rozowsky J., Alexander R., et al. Architecture of the human regulatory network derived from ENCODE data. Nature. 2012;489:91–100. doi: 10.1038/nature11245. [DOI] [PMC free article] [PubMed] [Google Scholar]
- 26.Wang J., Zhuang J., Iyer S., Lin X., Whitfield T.W., Greven M.C., Pierce B.G., Dong X., Kundaje A., Cheng Y., et al. Sequence features and chromatin structure around the genomic regions bound by 119 human transcription factors. Genome Res. 2012;22:1798–1812. doi: 10.1101/gr.139105.112. [DOI] [PMC free article] [PubMed] [Google Scholar]
- 27.Wang J., Zhuang J., Iyer S., Lin X.Y., Greven M.C., Kim B.H., Moore J., Pierce B.G., Dong X., Virgil D., et al. Factorbook.org: a Wiki-based database for transcription factor-binding data generated by the ENCODE consortium. Nucleic Acids Res. 2013;41:D171–D176. doi: 10.1093/nar/gks1221. [DOI] [PMC free article] [PubMed] [Google Scholar]
- 28.Kheradpour P., Kellis M. Systematic discovery and characterization of regulatory motifs in ENCODE TF binding experiments. Nucleic Acids Res. 2014;42:2976–2987. doi: 10.1093/nar/gkt1249. [DOI] [PMC free article] [PubMed] [Google Scholar]
- 29.Xie D., Boyle A.P., Wu L., Zhai J., Kawli T., Snyder M. Dynamic trans-acting factor colocalization in human cells. Cell. 2013;155:713–724. doi: 10.1016/j.cell.2013.09.043. [DOI] [PMC free article] [PubMed] [Google Scholar]
- 30.Fleming J.D., Pavesi G., Benatti P., Imbriano C., Mantovani R., Struhl K. NF-Y coassociates with FOS at promoters, enhancers, repetitive elements, and inactive chromatin regions, and is stereo-positioned with growth-controlling transcription factors. Genome Res. 2013;23:1195–1209. doi: 10.1101/gr.148080.112. [DOI] [PMC free article] [PubMed] [Google Scholar]
- 31.Testa A., Donati G., Yan P., Romani F., Huang T.H., Viganò M.A., Mantovani R. Chromatin immunoprecipitation (ChIP) on chip experiments uncover a widespread distribution of NF-Y binding CCAAT sites outside of core promoters. J. Biol. Chem. 2005;280:13606–13615. doi: 10.1074/jbc.M414039200. [DOI] [PubMed] [Google Scholar]
- 32.Ceribelli M., Dolfini D., Merico D., Gatta R., Viganò A.M., Pavesi G., Mantovani R. The histone-like NF-Y is a bifunctional transcription factor. Mol. Cell. Biol. 2008;28:2047–2058. doi: 10.1128/MCB.01861-07. [DOI] [PMC free article] [PubMed] [Google Scholar]
- 33.Sherwood R.I., Hashimoto T., O'Donnell C.W., Lewis S., Barkal A.A., van Hoff J.P., Karun V., Jaakkola T., Gifford D.K. Discovery of directional and nondirectional pioneer transcription factors by modeling DNase profile magnitude and shape. Nat. Biotechnol. 2014;32:171–178. doi: 10.1038/nbt.2798. [DOI] [PMC free article] [PubMed] [Google Scholar]
- 34.Oldfield A.J., Yang P., Conway A.E., Cinghu S., Freudenberg J.M., Yellaboina S., Jothi R. Histone-fold domain protein NF-Y promotes chromatin accessibility for cell type-specific master transcription factors. Mol Cell. 2014;55:708–722. doi: 10.1016/j.molcel.2014.07.005. [DOI] [PMC free article] [PubMed] [Google Scholar]
- 35.Dolfini D., Minuzzo M., Pavesi G., Mantovani R. The short isoform of NF-YA belongs to the embryonic stem cell transcription factor circuitry. Stem Cells. 2012;30:2450–2459. doi: 10.1002/stem.1232. [DOI] [PubMed] [Google Scholar]
- 36.Kabe Y., Yamada J., Uga H., Yamaguchi Y., Wada T., Handa H. NF-Y is essential for the recruitment of RNA polymerase II and inducible transcription of several CCAAT box-containing genes. Mol. Cell. Biol. 2005;25:512–522. doi: 10.1128/MCB.25.1.512-522.2005. [DOI] [PMC free article] [PubMed] [Google Scholar]
- 37.Yu F.X., Luo Y. Tandem ChoRE and CCAAT motifs and associated factors regulate Txnip expression in response to glucose or adenosine-containing molecules. PLoS One. 2009;4:e8397. doi: 10.1371/journal.pone.0008397. [DOI] [PMC free article] [PubMed] [Google Scholar]
- 38.Fossati A., Dolfini D., Donati G., Mantovani R. NF-Y recruits Ash2L to impart H3K4 trimethylation on CCAAT promoters. PLoS One. 2011;6:e17220. doi: 10.1371/journal.pone.0017220. [DOI] [PMC free article] [PubMed] [Google Scholar]
- 39.Lin Y.C., Chen Y.N., Lin K.F., Wang F.F., Chou T.Y., Chen M.Y. Association of p21 with NF-YA suppresses the expression of Polo-like kinase 1 and prevents mitotic death in response to DNA damage. Cell Death Dis. 2014;5:e987. doi: 10.1038/cddis.2013.527. [DOI] [PMC free article] [PubMed] [Google Scholar]
- 40.Tiwari V.K., Stadler M.B., Wirbelauer C., Paro R., Schübeler D., Beisel C. A chromatin-modifying function of JNK during stem cell differentiation. Nat. Genet. 2011;44:94–100. doi: 10.1038/ng.1036. [DOI] [PubMed] [Google Scholar]
- 41.Di Agostino S., Strano S., Emiliozzi V., Zerbini V., Mottolese M., Sacchi A., Blandino G., Piaggio G. Gain of function of mutant p53: the mutant p53/NF-Y protein complex reveals an aberrant transcriptional mechanism of cell cycle regulation. Cancer Cell. 2006;10:191–202. doi: 10.1016/j.ccr.2006.08.013. [DOI] [PubMed] [Google Scholar]
- 42.Weissmueller S., Manchado E., Saborowski M., Morris J.P. 4th, Wagenblast E., Davis C.A., Moon S.H., Pfister N.T., Tschaharganeh D.F., Kitzing T., et al. Mutant p53 drives pancreatic cancer metastasis through cell-autonomous PDGF receptor SH, Pfister. Cell. 2014;157:382–394. doi: 10.1016/j.cell.2014.01.066. [DOI] [PMC free article] [PubMed] [Google Scholar]
- 43.Luo R., Lu J.F., Hu Q., Maity S.N. CBF/NF-Y controls endoplasmic reticulum stress induced transcription through recruitment of both ATF6(N) and TBP. J. Cell. Biochem. 2008;104:1708–1723. doi: 10.1002/jcb.21736. [DOI] [PubMed] [Google Scholar]
- 44.Huang X., Zhang Y., Tang Y., Butler N., Kim J., Guessous F., Schiff D., Mandell J., Abounader R. A novel PTEN/mutant p53/c-Myc/Bcl-XL axis mediates context-dependent oncogenic effects of PTEN with implications for cancer prognosis and therapy. Neoplasia. 2013;15:952–965. doi: 10.1593/neo.13376. [DOI] [PMC free article] [PubMed] [Google Scholar]
- 45.Arampatzi P., Gialitakis M., Makatounakis T., Papamatheakis J. Gene-specific factors determine mitotic expression and bookmarking via alternate regulatory elements. Nucleic Acids Res. 2013;41:2202–2215. doi: 10.1093/nar/gks1365. [DOI] [PMC free article] [PubMed] [Google Scholar]
- 46.Shi Z., Chiang C.I., Labhart P., Zhao Y., Yang J., Mistretta T.A., Henning S.J., Maity S.N., Mori-Akiyama Y. Context-specific role of SOX9 in NF-Y mediated gene regulation in colorectal cancer cells. Nucleic Acids Res. 2015;43:6257–6269. doi: 10.1093/nar/gkv568. [DOI] [PMC free article] [PubMed] [Google Scholar]
- 47.Völkel S., Stielow B., Finkernagel F., Stiewe T., Nist A., Suske G. Zinc finger independent genome-wide binding of Sp2 potentiates recruitment of histone-fold protein Nf-y distinguishing it from Sp1 and Sp3. PLoS Genet. 2015;11:e1005102. doi: 10.1371/journal.pgen.1005102. [DOI] [PMC free article] [PubMed] [Google Scholar]
- 48.Rosenbloom K.R., Armstrong J., Barber G.P., Casper J., Clawson H., Diekhans M., Dreszer T.R., Fujita P.A., Guruvadoo L., Haeussler M., et al. The UCSC Genome Browser database: 2015 update. Nucleic Acids Res. 2015;43:D670–D681. doi: 10.1093/nar/gku1177. [DOI] [PMC free article] [PubMed] [Google Scholar]
- 49.Zambelli F., Pesole G., Pavesi G. PscanChIP: finding over-represented transcription factor-binding site motifs and their correlations in sequences from ChIP-Seq experiments. Nucleic Acids Res. 2013;41:W535–W543. doi: 10.1093/nar/gkt448. [DOI] [PMC free article] [PubMed] [Google Scholar]
- 50.Mathelier A., Zhao X., Zhang A.W., Parcy F., Worsley-Hunt R., Arenillas D.J., Buchman S., Chen C.Y., Chou A., Ienasescu H., et al. JASPAR 2014: an extensively expanded and updated open-access database of transcription factor binding profiles. Nucleic Acids Res. 2014:D142–D147. doi: 10.1093/nar/gkt997. [DOI] [PMC free article] [PubMed] [Google Scholar]
- 51.Mantovani R. A survey of 178 NF-Y binding CCAAT boxes. Nucleic Acids Res. 1998;26:1135–1143. doi: 10.1093/nar/26.5.1135. [DOI] [PMC free article] [PubMed] [Google Scholar]
- 52.Costessi A., Mahrour N., Tijchon E., Stunnenberg R., Stoel M.A., Jansen P.W., Sela D., Martin-Brown S., Washburn M.P., Florens L., et al. The tumour antigen PRAME is a subunit of a Cul2 ubiquitin ligase and associates with active NFY promoters. EMBO J. 2011;30:3786–3798. doi: 10.1038/emboj.2011.262. [DOI] [PMC free article] [PubMed] [Google Scholar]
- 53.Stark C., Breitkreutz B.J., Reguly T., Boucher L., Breitkreutz A., Tyers M. BioGRID: a general repository for interaction datasets. Nucleic Acids Res. 2006;34:D535–D539. doi: 10.1093/nar/gkj109. [DOI] [PMC free article] [PubMed] [Google Scholar]
- 54.Lindaman L.L., Yeh D.M., Xie C., Breen K.M., Coss D. Phosphorylation of ATF2 and interaction with NFY induces c-Jun in the gonadotrope. Mol. Cell Endocrinol. 2013;365:316–326. doi: 10.1016/j.mce.2012.11.012. [DOI] [PMC free article] [PubMed] [Google Scholar]
- 55.Villard J., Peretti M., Masternak K., Barras E., Caretti G., Mantovani R., Reith W. A functionally essential domain of RFX5 mediates activation of major histocompatibility complex class II promoters by promoting cooperative binding between RFX and NF-Y. Mol. Cell. Biol. 2000;20:3364–3376. doi: 10.1128/mcb.20.10.3364-3376.2000. [DOI] [PMC free article] [PubMed] [Google Scholar]
- 56.Jabrane-Ferrat N., Nekrep N., Tosi G., Esserman L.J., Peterlin B.M. Major histocompatibility complex class II transcriptional platform: assembly of nuclear factor Y and regulatory factor X (RFX) on DNA requires RFX5 dimers. Mol. Cell. Biol. 2002;22:5616–5625. doi: 10.1128/MCB.22.15.5616-5625.2002. [DOI] [PMC free article] [PubMed] [Google Scholar]
- 57.Ito Y., Zhang Y., Dangaria S., Luan X., Diekwisch T.G. NF-Y and USF1 transcription factor binding to CCAAT-box and E-box elements activates the CP27 promoter. Gene. 2011;473:92–99. doi: 10.1016/j.gene.2010.11.001. [DOI] [PMC free article] [PubMed] [Google Scholar]
- 58.Zhu J., Zhang Y., Joe G.J., Pompetti R., Emerson S.G. NF-Ya activates multiple hematopoietic stem cell (HSC) regulatory genes and promotes HSC self-renewal. Proc. Natl. Acad. Sci. U.S.A. 2005;102:11728–11733. doi: 10.1073/pnas.0503405102. [DOI] [PMC free article] [PubMed] [Google Scholar]
- 59.van Wageningen S., Breems-de Ridder M.C., Nigten J., Nikoloski G., Erpelinck-Verschueren C.A., Löwenberg B., de Witte T., Tenen D.G., van der Reijden B.A., Jansen J.H. Gene transactivation without direct DNA binding defines a novel gain-of-function for PML-RARalpha. Blood. 2008;111:1634–1643. doi: 10.1182/blood-2007-04-081125. [DOI] [PubMed] [Google Scholar]
- 60.Tanaka Y., Nakamura A., Morioka M.S., Inoue S., Tamamori-Adachi M., Yamada K., Taketani K., Kawauchi J., Tanaka-Okamoto M., Miyoshi J., et al. Systems analysis of ATF3 in stress response and cancer reveals opposing effects on pro-apoptotic genes in p53 pathway. PLoS One. 2011;6:e26848. doi: 10.1371/journal.pone.0026848. [DOI] [PMC free article] [PubMed] [Google Scholar]
- 61.Terrados G., Finkernagel F., Stielow B., Sadic D., Neubert J., Herdt O., Krause M., Scharfe M., Jarek M., Suske G. Genome-wide localization and expression profiling establish Sp2 as a sequence-specific transcription factor regulating vitally important genes. Nucleic Acids Res. 2012;40:7844–7857. doi: 10.1093/nar/gks544. [DOI] [PMC free article] [PubMed] [Google Scholar]
- 62.Lee B.K., Bhinge A.A., Iyer V.R. Wide-ranging functions of E2F4 in transcriptional activation and repression revealed by genome-wide analysis. Nucleic Acids Res. 2011;39:3558–3573. doi: 10.1093/nar/gkq1313. [DOI] [PMC free article] [PubMed] [Google Scholar]
- 63.Barberis A., Superti-Furga G., Busslinger M. Mutually exclusive interaction of the CCAAT-binding factor and of a displacement protein with overlapping sequences of a histone gene promoter. Cell. 1987;50:347–359. doi: 10.1016/0092-8674(87)90489-2. [DOI] [PubMed] [Google Scholar]
- 64.Benoist C., Mathis D. Regulation of major histocompatibility complex class-II genes: X, Y and other letters of the alphabet. Annu. Rev. Immunol. 1990;8:681–715. doi: 10.1146/annurev.iy.08.040190.003341. [DOI] [PubMed] [Google Scholar]
- 65.Roder K., Wolf S.S., Larkin K.J., Schweizer M. Interaction between the two ubiquitously expressed transcription factors NF-Y and Sp1. Gene. 1999;234:61–69. doi: 10.1016/s0378-1119(99)00180-8. [DOI] [PubMed] [Google Scholar]
- 66.Yamada K., Tanaka T., Miyamoto K., Noguchi T. Sp family members and nuclear factor-Y cooperatively stimulate transcription from the rat pyruvate kinase M gene distal promoter region via their direct interactions. J. Biol. Chem. 2000;275:18129–18137. doi: 10.1074/jbc.M001543200. [DOI] [PubMed] [Google Scholar]
- 67.Bandyopadhyay S., Chiang C.Y., Srivastava J., Gersten M., White S., Bell R., Kurschner C., Martin C., Smoot M., Sahasrabudhe S., et al. A human MAP kinase interactome. Nat. Methods. 2010;7:801–805. doi: 10.1038/nmeth.1506. [DOI] [PMC free article] [PubMed] [Google Scholar]
- 68.Kolell K.J., Crawford D.L. Evolution of Sp transcription factors. Mol. Biol. Evol. 2002;19:216–222. doi: 10.1093/oxfordjournals.molbev.a004074. [DOI] [PubMed] [Google Scholar]
- 69.Li X.Y., Hooft van Huijsduijnen R., Mantovani R., Benoist C., Mathis D. Intron-exon organization of the NF-Y genes. Tissue-specific splicing modifies an activation domain. J. Biol. Chem. 1992;267:8984–8990. [PubMed] [Google Scholar]
- 70.Ge Y., Jensen T.L., Matherly L.H., Taub J.W. Synergistic regulation of human cystathionine-beta-synthase-1b promoter by transcription factors NF-YA isoforms and Sp1. Biochim. Biophys. Acta. 2002;1579:73–80. doi: 10.1016/s0167-4781(02)00509-2. [DOI] [PubMed] [Google Scholar]
- 71.Choi N.M., Boss J.M. Multiple histone methyl and acetyltransferase complex components bind the HLA-DRA gene. PLoS One. 2012;7:e37554. doi: 10.1371/journal.pone.0037554. [DOI] [PMC free article] [PubMed] [Google Scholar]
- 72.Caretti G., Cocchiarella F., Sidoli C., Villard J., Peretti M., Reith W., Mantovani R. Dissection of functional NF-Y-RFX cooperative interactions on the MHC class II Ea promoter. J. Mol. Biol. 2000;302:539–552. doi: 10.1006/jmbi.2000.4028. [DOI] [PubMed] [Google Scholar]
- 73.Hiscott J. Triggering the innate antiviral response through IRF-3 activation. J. Biol. Chem. 2007;282:15325–15329. doi: 10.1074/jbc.R700002200. [DOI] [PubMed] [Google Scholar]
- 74.Penkov D., Mateos San Martín D., Fernandez-Díaz L.C., Rosselló C.A., Torroja C., Sánchez-Cabo F., Warnatz H.J., Sultan M., Yaspo M.L., Gabrieli A., et al. Analysis of the DNA-binding profile and function of TALE homeoproteins reveals their specialization and specific interactions with Hox genes/proteins. Cell Rep. 2013;3:1321–1333. doi: 10.1016/j.celrep.2013.03.029. [DOI] [PubMed] [Google Scholar]
- 75.Giannopoulou E.G., Elemento O. Inferring chromatin-bound protein complexes from genome-wide binding assays. Genome Res. 2013;23:1295–1306. doi: 10.1101/gr.149419.112. [DOI] [PMC free article] [PubMed] [Google Scholar]
- 76.Imbriano C., Gnesutta N., Mantovani R. The NF-Y/p53 liaison: well beyond repression. Biochim. Biophys. Acta. 2012;1825:131–139. doi: 10.1016/j.bbcan.2011.11.001. [DOI] [PubMed] [Google Scholar]
- 77.Liberati C., di Silvio A., Ottolenghi S., Mantovani R. NF-Y binding to twin CCAAT boxes: role of Q-rich domains and histone fold helices. J. Mol. Biol. 1999;285:1441–1455. doi: 10.1006/jmbi.1998.2384. [DOI] [PubMed] [Google Scholar]
- 78.Bieda M., Xu X., Singer M.A., Green R., Farnham P.J. Unbiased location analysis of E2F1-binding sites suggests a widespread role for E2F1 in the human genome. Genome Res. 2006;16:595–605. doi: 10.1101/gr.4887606. [DOI] [PMC free article] [PubMed] [Google Scholar]
- 79.Müller G.A., Engeland K. The central role of CDE/CHR promoter elements in the regulation of cell cycle-dependent gene transcription. FEBS J. 2010;277:877–893. doi: 10.1111/j.1742-4658.2009.07508.x. [DOI] [PubMed] [Google Scholar]
- 80.Chen X., Müller G.A., Quaas M., Fischer M., Han N., Stutchbury B., Sharrocks A.D., Engeland K. The forkhead transcription factor FOXM1 controls cell cycle-dependent gene expression. Mol. Cell. Biol. 2013;33:227–236. doi: 10.1128/MCB.00881-12. [DOI] [PMC free article] [PubMed] [Google Scholar]
- 81.Tronche F., Rollier A., Herbomel P., Bach I., Cereghini S., Weiss M., Yaniv M. Anatomy of the rat albumin promoter. Mol. Biol. Med. 1990;7:173–185. [PubMed] [Google Scholar]
- 82.Milos P.M., Zaret K.S. A ubiquitous factor is required for C/EBP-related proteins to form stable transcription complexes on an albumin promoter segment in vitro. Genes Dev. 1992;6:991–1004. doi: 10.1101/gad.6.6.991. [DOI] [PubMed] [Google Scholar]
- 83.Shi X., Metges C.C., Seyfert H.M. Interaction of C/EBP-beta and NF-Y factors constrains activity levels of the nutritionally controlled promoter IA expressing the acetyl-CoA carboxylase-alpha gene in cattle. BMC Mol. Biol. 2012;13:21. doi: 10.1186/1471-2199-13-21. [DOI] [PMC free article] [PubMed] [Google Scholar]
- 84.Su M., Bansal A.K., Mantovani R., Sodek J. Recruitment of nuclear factor Y to the inverted CCAAT element (ICE) by c-Jun and E1A stimulates basal transcription of the bone sialoprotein gene in osteosarcoma cells. J. Biol. Chem. 2005;280:38365–38375. doi: 10.1074/jbc.M501609200. [DOI] [PubMed] [Google Scholar]
- 85.Alonso C.R., Pesce C.G., Kornblihtt A.R. The CCAAT-binding proteins CP1 and NF-I cooperate with ATF-2 in the transcription of the fibronectin gene. J. Biol. Chem. 1996;271:22271–22279. doi: 10.1074/jbc.271.36.22271. [DOI] [PubMed] [Google Scholar]
- 86.Yoshida H., Okada T., Haze K., Yanagi H., Yura T., Negishi M., Mori K. ATF6 activated by proteolysis binds in the presence of NF-Y (CBF) directly to the cis-acting element responsible for the mammalian unfolded protein response. Mol. Celll Biol. 2000;20:6755–6767. doi: 10.1128/mcb.20.18.6755-6767.2000. [DOI] [PMC free article] [PubMed] [Google Scholar]
- 87.Yoshida H., Okada T., Haze K., Yanagi H., Yura T., Negishi M., Mori K. Endoplasmic reticulum stress-induced formation of transcription factor complex ERSF including NF-Y (CBF) and activating transcription factors 6alpha and 6beta that activates the mammalian unfolded protein response. Mol. Cell. Biol. 2001;21:1239–1248. doi: 10.1128/MCB.21.4.1239-1248.2001. [DOI] [PMC free article] [PubMed] [Google Scholar]
- 88.Luo R., Lu J.F., Hu Q., Maity S.N. CBF/NF-Y controls endoplasmic reticulum stress induced transcription through recruitment of both ATF6(N) and TBP. J. Cell. Biochem. 2008;104:1708–1723. doi: 10.1002/jcb.21736. [DOI] [PubMed] [Google Scholar]
- 89.Hollenhorst P.C., McIntosh L.P., Graves B.J. Genomic and biochemical insights into the specificity of ETS transcription factors. Annu. Rev. Biochem. 2011;80:437–471. doi: 10.1146/annurev.biochem.79.081507.103945. [DOI] [PMC free article] [PubMed] [Google Scholar]
- 90.Göke J., Chan Y.S., Yan J., Vingron M., Ng H.H. Genome-wide kinase-chromatin interactions reveal the regulatory network of ERK signaling in human embryonic stem cells. Mol Cell. 2013;50:844–855. doi: 10.1016/j.molcel.2013.04.030. [DOI] [PubMed] [Google Scholar]
- 91.Yajima H., Motohashi N., Ono Y., Sato S., Ikeda K., Masuda S., Yada E., Kanesaki H., Miyagoe-Suzuki Y., Takeda S., et al. Six family genes control the proliferation and differentiation of muscle satellite cells. Exp. Cell Res. 2010;316:2932–2944. doi: 10.1016/j.yexcr.2010.08.001. [DOI] [PubMed] [Google Scholar]
- 92.Himeda C.L., Ranish J.A., Hauschka S.D. Quantitative proteomic identification of MAZ as a transcriptional regulator of muscle-specific genes in skeletal and cardiac myocytes. Mol. Cell. Biol. 2008;28:6521–6535. doi: 10.1128/MCB.00306-08. [DOI] [PMC free article] [PubMed] [Google Scholar]
- 93.Fan W., Jin S., Tong T., Zhao H., Fan F., Antinore M.J., Rajasekaran B., Wu M., Zhan Q. BRCA1 regulates GADD45 through its interactions with the OCT-1 and CAAT motifs. J. Biol. Chem. 2002;277:8061–8067. doi: 10.1074/jbc.M110225200. [DOI] [PubMed] [Google Scholar]
- 94.Li X., Liu L., Yang S., Song N., Zhou X., Gao J., Yu N., Shan L., Wang Q., Liang J., et al. Histone demethylase KDM5B is a key regulator of genome stability. Proc. Natl. Acad. Sci. U.S.A. 2014;111:7096–7101. doi: 10.1073/pnas.1324036111. [DOI] [PMC free article] [PubMed] [Google Scholar]
- 95.Frontini M., Imbriano C., diSilvio A., Bell B., Bogni A., Romier C., Moras D., Tora L., Davidson I., Mantovani R. NF-Y recruitment of TFIID, multiple interactions with histone fold TAF(II)s. J. Biol. Chem. 2002;277:5841–5848. doi: 10.1074/jbc.M103651200. [DOI] [PubMed] [Google Scholar]
- 96.Kabe Y., Yamada J., Uga H., Yamaguchi Y., Wada T., Handa H. NF-Y is essential for the recruitment of RNA polymerase II and inducible transcription of several CCAAT box-containing genes. Mol. Cell. Biol. 2005;25:512–522. doi: 10.1128/MCB.25.1.512-522.2005. [DOI] [PMC free article] [PubMed] [Google Scholar]
- 97.Biswas M., Chan J.Y. Role of Nrf1 in antioxidant response element-mediated gene expression and beyond. Toxicol. Appl. Pharmacol. 2010;244:16–20. doi: 10.1016/j.taap.2009.07.034. [DOI] [PMC free article] [PubMed] [Google Scholar]
- 98.Benatti P., Dolfini D., Viganò A., Ravo M., Weisz A., Imbriano C. Specific inhibition of NF-Y subunits triggers different cell proliferation defects. Nucleic Acids Res. 2011;39:5356–5368. doi: 10.1093/nar/gkr128. [DOI] [PMC free article] [PubMed] [Google Scholar]
- 99.Kidder B.L., Hu G., Zhao K. KDM5B focuses H3K4 methylation near promoters and enhancers during embryonic stem cell self-renewal and differentiation. Genome Biol. 2014;15:R32. doi: 10.1186/gb-2014-15-2-r32. [DOI] [PMC free article] [PubMed] [Google Scholar]
- 100.Tyagi S., Chabes A.L., Wysocka J., Herr W. E2F activation of S phase promoters via association with HCF-1 and the MLL family of histone H3K4 methyltransferases. Mol Cell. 2007;27:107–119. doi: 10.1016/j.molcel.2007.05.030. [DOI] [PubMed] [Google Scholar]
- 101.Zargar Z., Tyagi S. Role of host cell factor-1 in cell cycle regulation. Transcription. 2012;3:187–192. doi: 10.4161/trns.20711. [DOI] [PMC free article] [PubMed] [Google Scholar]
- 102.Yang M., Gocke C.B., Luo X., Borek D., Tomchick D.R., Machius M., Otwinowski Z., Yu H. Structural basis for CoREST-dependent demethylation of nucleosomes by the human LSD1 histone demethylase. Mol Cell. 2006;23:377–387. doi: 10.1016/j.molcel.2006.07.012. [DOI] [PubMed] [Google Scholar]
- 103.Cai C., He H.H., Gao S., Chen S., Yu Z., Gao Y., Chen S., Chen M.W., Zhang J., Ahmed M., et al. Lysine-Specific Demethylase 1 has dual functions as a major regulator of Androgen Receptor transcriptional activity. Cell Rep. 2014;9:1618–1627. doi: 10.1016/j.celrep.2014.11.008. [DOI] [PMC free article] [PubMed] [Google Scholar]
- 104.Flanagan J.F., Mi L.Z., Chruszcz M., Cymborowski M., Clines K.L., Kim Y., Minor W., Rastinejad F., Khorasanizadeh S. Double chromodomains cooperate to recognize the methylated histone H3 tail. Nature. 2005;438:1181–1185. doi: 10.1038/nature04290. [DOI] [PubMed] [Google Scholar]
- 105.Pray-Grant M.G., Daniel J.A., Schieltz D., Yates J.R. III, Grant P.A. Chd1 chromodomain links histone H3 methylation with SAGA- and SLIK-dependent acetylation. Nature. 2005;433:434–438. doi: 10.1038/nature03242. [DOI] [PubMed] [Google Scholar]
Associated Data
This section collects any data citations, data availability statements, or supplementary materials included in this article.