Abstract
MicroRNAs play important roles in a large variety of biological systems and processes through their regulation of target mRNA expression, and show promise as clinical biomarkers. However, their small size presents challenges for tagging or direct detection. Innovation in techniques to sense and quantify microRNAs may aid research into novel aspects of microRNA biology and contribute to the development of diagnostics. By introducing an additional stem loop into the fluorescent RNA Spinach and altering its 3′ and 5′ ends, we have generated a new RNA, Pandan, that functions as the basis for a microRNA sensor. Pandan contains two sequence-variable stem loops that encode complementary sequence for a target microRNA of interest. In its sensor form, it requires the binding of a target microRNA in order to reconstitute the RNA scaffold for fluorophore binding and fluorescence. Binding of the target microRNA resulted in large changes in fluorescence intensity. The median fold change in fluorescence observed for the sensors tested was ∼50-fold. Pandan RNA sensors exhibit good signal-to-noise ratios, and can detect their target microRNAs within complex RNA mixtures.
INTRODUCTION
MicroRNAs (miRNAs) are short, non-coding RNAs that regulate many important biological processes in development, physiology and disease. miRNAs are often involved in regulatory feedback loops, where aberrations in cellular processes trigger miRNAs to act to restore target levels (1,2). Therefore, the ability to respond dynamically to changing conditions is inferred to be an essential function of miRNAs. miRNAs are also an emerging class of biomarkers, which are misregulated in cancer and neurodegenerative diseases. miRNA expression signatures have shown promise for use in prognosis and as predictors of clinical response (3,4). Therefore, tools for the detection and quantification of miRNAs have broad applicability.
Current methods to detect miRNAs include northern blotting, amplification-based methods such as real-time polymerase chain reaction (PCR) (5), rolling circle amplification (6) and isothermal amplification (7,8), deep sequencing (9), as well as hybridization-based techniques such as microarrays (10,11) and in situ hybridization (12). These methods are suitable for the detection of purified RNA in vitro. To study miRNAs in vivo, quencher-fluorophore based systems such as molecular beacons have been used (13,14). These nucleic acid-based probes require additional delivery agents for efficient cellular uptake. For instance, polyethyleneimine-grafted graphene nanoribbons were used to deliver Locked nucleic acid (LNA)-modified molecular beacon probes to detect miR-21 in HeLa cells (15). An alternative approach involves use of genetically encoded sensor transgenes with miRNA target sites introduced into the 3′-untranslated region (UTR) of a Green Fluorescent Protein (GFP) reporter (16). Downregulation of the sensor therefore reports miRNA activity. This approach allows for good spatial resolution to visualize miRNA activity in vivo, but has limited capacity for temporal resolution of miRNA dynamics, due to the relatively slow turnover of the GFP reporter.
Here, we report on the adaptation of a fluorescent RNA–fluorophore complex, Spinach, for use as a miRNA sensor and demonstrate its performance in vitro. Spinach has previously been used as a tag for mRNAs, and has also been adapted for use as sensors for small molecule metabolites (17,18). The RNA scaffold of Spinach forms a binding site for a fluorophore, 3,5-difluoro-4-hydroxybenzylidene imidazolinone (DFHBI), which becomes fluorescent upon binding to the RNA scaffold. We have redesigned Spinach so that folding to create a DFHBI-binding scaffold depends on interaction between a miRNA and a sequence-complementary RNA backbone. We name this sensor family Pandan, after a plant used to provide an aromatic green coloring in Southeast Asian cooking. Binding of the target miRNA to the Pandan sensor reconstitutes an RNA structure capable of binding the DFHBI fluorophore in a manner similar to the Spinach aptamer. This novel aptamer serves as an RNA sensor that directly detects microRNAs by fluorophore binding.
MATERIALS AND METHODS
Design and preparation of sensors
Pandan sensors were designed by encoding complementary sequence for the 5′ region of the target miRNA within SL P3, and the 3′ region of the target miRNA within SL P4 of Pandan, with two unpaired nucleotides in the microRNA between the two portions. The sensors were designed so that microRNA binding would result in a Uracil (U) in the second unpaired base 3' of SL P3. We then used the online mFold server to determine whether the sensor and miRNA pair were predicted to properly fold into the Pandan structure using a sequence where the sensor and microRNA were encoded as a single molecule. Details are provided in Supplementary Sequences and Primers.
Single stranded DNA templates for designed sensors (synthesized by Sigma Aldrich or IDT) were amplified using PCR to create double stranded DNA templates using primers that included a 5′ T7 promoter sequence (5′-GTATAATACGACTCACTATAGGGA-3′). Primer and template sequences are provided in the Supplementary Sequences file. PCR products were purified using PCR purification columns (Qiagen) and used as templates for in vitro T7 transcription (Epicentre) following the manufacturers’ protocols. RNA sensors were extracted with ammonium acetate (5M) and phenol–chloroform, and precipitated with isopropanol using standard procedures. RNA pellets were then suspended in nuclease-free water, and their concentration measured on a Nanodrop instrument. Samples were stored at −80°C.
Fluorescence assay for miRNA detection
Fluorescence detection was carried out as described in (17). Briefly, synthetic target miRNA (1, 0.1 and 0.01 μM; synthesized by IDT) or buffer control was added to a solution of the Pandan sensor (1 μM unless otherwise stated) and DFHBI or DFHBI-1T (10 μM; Lucerna, Technologies New York, NY, USA) in a buffer containing 40 mM HEPES pH 7.4, 125 mM KCl and 1 mM MgCl2. Reactions were incubated at 37°C for 1 h and then loaded onto a 96-well plate (Costar). Fluorescence signal was recorded using a Tecan Safire2 fluorescence microplate reader with the following measurement parameters: excitation wavelength = 460 nm; emission wavelength = 501 nm; slit widths = 10 nm. Experiments were carried out in triplicate for each data point.
Fly RNA extraction and spike in for fluorescence detection
RNA was extracted from 15–30 Canton S white (CS10) male flies using TRIzol reagent (Invitrogen) following the manufacturer's protocol. To detect target miRNA in this complex mixture of extracted RNA, synthetic target miRNA (1, 0.1 or 0.01 μM) (IDT), Pandan sensor (1 μM) and DFHBI or DFHBI-1T (10 μM) were added either to a solution of extracted RNA in a buffer containing 40 mM HEPES pH 7.4, 125 mM KCl and 1 mM MgCl2 or buffer control only without extracted RNA. Reactions were incubated at 37°C for 1 h and fluorescence was recorded using a Tecan Safire2 fluorescence microplate reader with the following measurement parameters: excitation wavelength = 460 nm; emission wavelength = 501 nm; slit widths = 10 nm. Experiments were carried out in triplicate for each data point.
RESULTS
A bimolecular miRNA sensor design
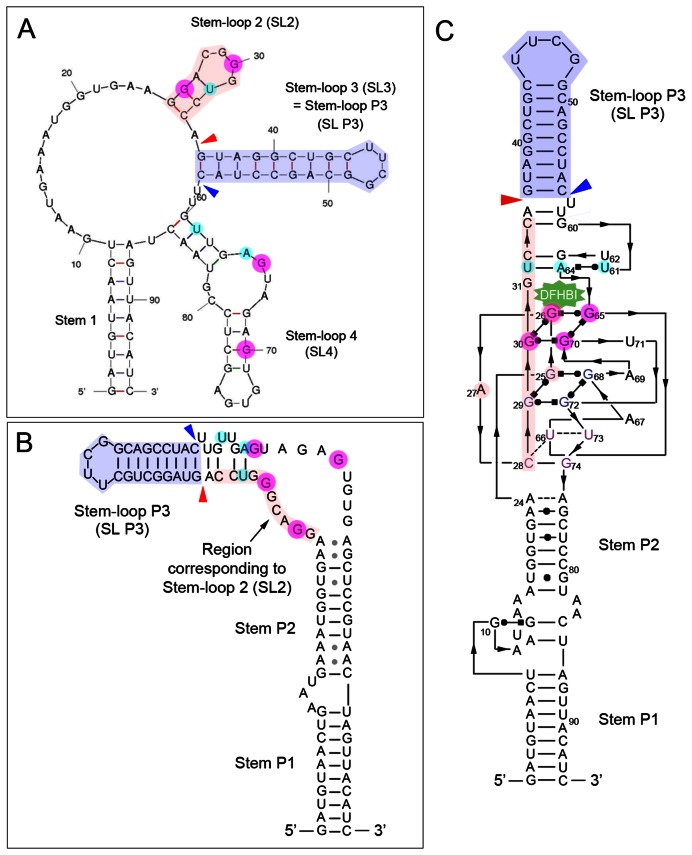
The Spinach aptamer is a single linear RNA molecule that was computationally predicted (mFold) to fold into a structure comprising four stem-loop regions (17)(Figure 1A). The crystal structure of Spinach when bound to the fluorophore DFHBI was then solved and shown to instead consist of a three-tetrad quadruplex flanked by two helices (19,20). The solved structure is diagrammed in simplified 2D form in Figure 1B, (adapted from ref. 19), and in detailed form in Figure 1C (adapted from ref 20). Although the strategy and experiments for the sensor design began with the mFold structure, prior to the publications of the crystal structure, for simplicity the experiments are illustrated in terms of the solved structure. Sensor design and experiments related to the mFold structure are provided as Supplementary Figures. Our experiments described here are based on Spinach2, a variant of Spinach with improved folding and thermostability (21).
Figure 1.
Spinach2 structure. (A–C) Representations of the computationally predicted (A) and solved (B and C) structures of Spinach2. As the helices were differently named in the two solved structures, for consistency, we have adopted ref. (20) and named the paired regions P1, P2 and P3. (A) Computationally predicted (mFold) structure of Spinach2. (B) Simplified 2D representation of the solved crystal structure of Spinach2, drawn based on Huang et al. (19). (C) Detailed 2D representation of the solved crystal structure of Spinach2, drawn based on Deigan-Warner et al. (20). Magenta circled Gs form the top tetrad of the core G-quadruplex region and cyan circles highlight the bases in the base triple, which is required for Spinach folding (19,20). Light purple shading highlight the bases in each structure that correspond to Stem-loop P3, and light pink shading highlight the bases in each structure that correspond to Stem-loop 2 of the predicted structure (A). The red arrowhead in each structure indicates the position where SL P3 5′ was inserted, and the blue arrowhead indicates the position where SL P3 3′ was inserted (refer to text for Figure 2B).
We reasoned that a sensor with fluorescence properties similar Spinach2 could be assembled from two different RNA molecules if the structural elements required for stable complex formation with DHFBI could be reconstituted by base pairing between these two RNA molecules. To make a bimolecular microRNA sensor, part of the structure of Spinach2 would have to be removed and replaced by sequences complementary to the microRNA, so that binding of the microRNA is required for stable complex formation. Previous mutagenesis studies had already shown that SL P3 is required for Spinach function, but that the sequence of the stem could be varied (17,18). Hence, sequences complementary to the microRNA in this duplex region could partially form the basis of a sensor (illustrated in Supplementary Figure S1). This strategy would require three modifications: (i) To circularly permute Spinach2, changing the positions of the 5′ and 3′ ends of the RNA aptamer to reside within SL P3; (ii) To introduce a second sequence-variable stem loop adjacent to SL P3, and (iii) To assemble a functional fluorescent molecule from two different RNAs. As the predicted mFold structure contained two stem loops adjacent to SL P3, a possible strategy for (ii) was to alter one of them (Supplementary Figure S1). Another strategy would be to introduce a new stem-loop. We systematically tested the modifications required.
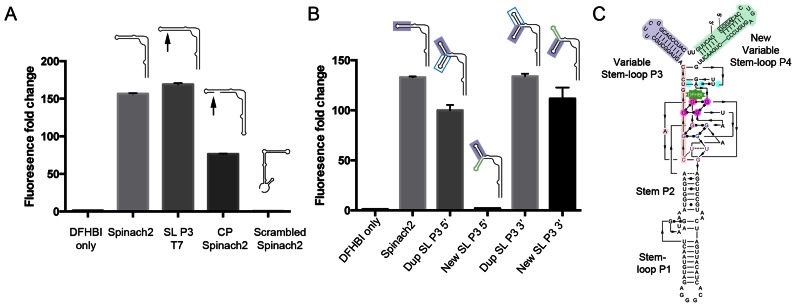
To produce a circularly permuted (CP) version of Spinach2 RNA, with the 5′ end in SL P3, we would need to be able to incorporate part of the T7 transcriptional start site into SL P3 without compromising fluorescence. Extending SL P3 by adding the partial T7 transcriptional start sequence GGGA did not reduce fluorescence (Figure 2A, SL P3 T7). By beginning transcription in SL P3, we synthesized a version of Spinach2 RNA in which the original 3′ and 5′ ends in stem P1 were connected with a short additional loop to produce a CP Spinach2 molecule. CP Spinach2 retained ∼50% of the fluorescence of Spinach2 (Figure 2A, CP Spinach2). An RNA in which the sequence of Spinach2 was randomly rearranged did not fluoresce (Figure 2A, Scrambled Spinach2).
Figure 2.
Features of Pandan sensor design. (A) Fluorescence intensity fold change of Spinach2 and modified versions of Spinach2 compared to the DHFBI-only control. Schematic structures of the different RNAs are shown. Arrows indicate the position of the inserted partial T7 transcriptional start site, GGGA. (B) Fluorescence intensity fold change of sensor designs testing the addition of extra adjacent stem-loop sequences 5′ and 3′ of SL P3 (positions indicated in red and blue arrowheads in Figure 1A–C). Dup SL P3 indicates insertion of a second copy of the SL P3 stem-loop. New SL indicates insertion of an independent randomly chosen sequence of the same length (Details in Supplementary Sequences). (C) Diagram showing the single-molecule version of Pandan with the 5′ and 3′ ends in the added stem-loop P4, based on Deigan-Warner et al. (20). Shading is consistent with Figure 1A–C. The GGGA partial transcriptional start site is boxed. SL P3: Stem-loop P3; SL P3 T7: Spinach2 with an additional GGGA partial T7 transcriptional start site in SL P3; CP Spinach2: circularly permuted (CP) Spinach2. Fluorescence experiments were performed in triplicate. Fluorescence intensity fold change shown is with respect to DFHBI-only controls. Cartoons used in panels A and B are based on the simplified 2D structure from Huang et al. (19) (Figure 1B).
The CP Spinach2 design allowed for the possibility of a bimolecular sensor. To function, the sensor would require a second, adjacent stem loop whose sequence could also be varied. A number of variations were tested using SL2, based on the predicted mFold structure, but without success (see Supplementary Figure S2). The region called Stem loop 4 (SL4) in the predicted structure (Figure 1A) was reported to contain essential nucleotides that cannot be mutated (17). In the solved structure, SL2 and SL4 contain key nucleotides in the core G-quadruplex and base triple that are critical for binding the DFHBI ligand (colored circles in Figure 1A–C)(19,20). Hence, neither of these regions was suitable, leading us to explore other modifications.
A variant that provided the basis for a functional sensor is described in terms of the solved structure (Figure 1B and C). We tested whether insertion of a new stem loop adjacent to SL P3 would be compatible with fluorescence. A second copy of the SL P3 sequence was inserted on the 5′ side of the original SL P3 (Figure 1A–C, red arrowheads) or on the 3′ side of the original SL P3 (Figure 1A–C, blue arrowheads). In both positions, this resulted in a functional fluorescent molecule (Dup SL P3, Figure 2B). Next, we tested adding a stem loop with a different sequence. This was well tolerated when inserted 3′ to SL P3, but not when inserted at 5′ to SL P3 (new SL, Figure 2B) (See Supplementary Sequences for details). We named the predicted three-stem loop fluorescent RNA-complex, Pandan (Figure 2C).
Pandan sensors recognize microRNAs in vitro
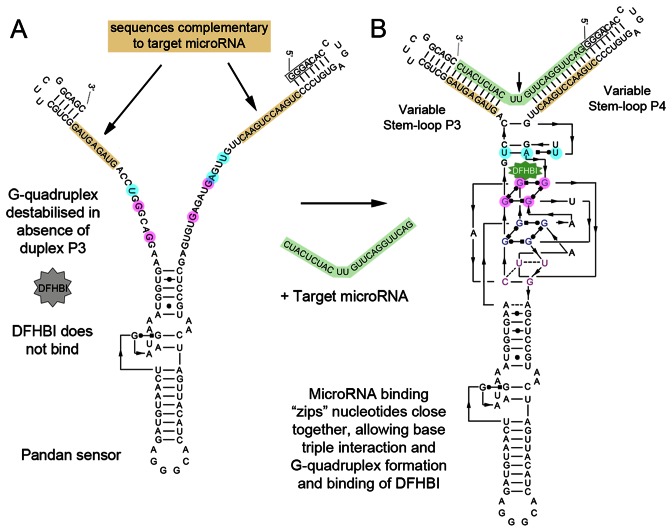
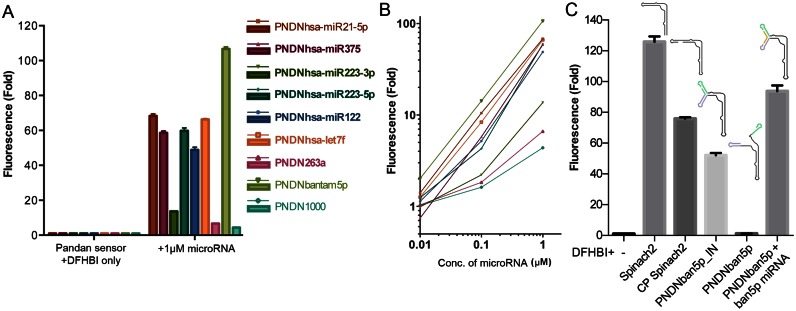
The sequences of both stem-loops P3 and the new additional stem-loop P4 can be varied. This allowed us to encode sequences complementary to target miRNAs into the Pandan sensor backbone (illustrated in Figure 3). We designed Pandan sensors to Drosophila miRNAs dme-bantam-3p, dme-miR-263a and dme-miR-1000, as well as for several human miRNAs (Details in ‘Materials and Methods’ section and Supplementary Sequences). In most cases, the sensor showed little or no fluorescence in the absence of the target miRNA (Supplementary Figure S3). The fluorescence intensity of bound DFHBI increased between ∼4- and ∼100-fold upon addition of target miRNA at 1 μM, compared to just sensor and DFHBI alone (Figure 4A). Fluorescence intensity increased with miRNA concentration (Figure 4B), and the relationship was linear for the sensors that exhibited the brightest fluorescence: PNDN-bantam, PNDN-hsa-miR-21–5p, PNDN-hsa-let7f and PNDN-hsa-miR-375. The Pandan sensor PNDN-bantam-5p showed ∼75% of the fluorescence intensity of Spinach2, on an equimolar basis, in the presence of its target miRNA (Figure 4C).
Figure 3.
Pandan is a bimolecular miRNA sensor. (A) Absence of the target miRNA prevents duplexes P3 and P4 from forming, hence destabilizing the G-quadruplex and base triplet required for proper folding and binding of DFHBI. (B) Pairing between miRNA and sensor backbone in stem-loops P3 and P4 allows for stable complex folding with DFHBI. The arrow indicates the second unpaired nucleotide 3′ of SL P3, 5′ of SL P4, that in all our tested sensors was a Uracil (U). The GGGA partial transcriptional start site is boxed. Shading is consistent with Figure 1A–C. Based on Deigan-Warner et al. (20).
Figure 4.
Sequence-specific miRNA detection by Pandan sensors. (A) Fluorescence intensity fold change of Pandan sensors for several different miRNAs compared to each respective sensor + DFHBI alone. (B) Fluorescence intensity fold change of Pandan sensors as a function of miRNA concentration for miRNAs from (A). (C) Fluorescence intensity fold change of 1 μM bantam-5p Pandan sensor in the absence or presence of 1 μM bantam-5p microRNA, compared to that of 1 μM Spinach2, 1 μM CP Spinach2 (CP Spinach2) and 1 μM PNDNbantam-5p-IN (where the sequence of bantam-5p miRNA is encoded into Pandan as one continuous molecule). PNDNban-5p: Pandan sensor for bantam-5p miRNA. Fluorescence experiments were performed in triplicate. Fluorescence intensity fold change shown is with respect to sensor + DFHBI-only controls (in absence of miRNA).
Supplementary Figures S4 and S5 present tests of additional modifications to the basic sensor design. Extension of the self-pairing region of SL P3 from three to six residues improved low-sensitivity sensors: PNDN-miR-263a increased from ∼7- to ∼27-fold and PNDN-miR-1000 from ∼4- to ∼8-fold, while having less impact on those that were already sensitive (Supplementary Figure S4). Further extension of SL P3 did not further improve sensor signal (Supplementary Figure S5A). Extension of stem loop P4 did not improve sensor signal (Supplementary Figure S5B). Five additional Drosophila miRNA sensors with the extended P3 design showed fluorescence increases from ∼3- to ∼96-fold upon miRNA addition (Supplementary Figure S6). The median increase in fluorescence was 49-fold for the 14 Pandan miRNA sensors tested (Table 1).
Table 1. Raw fluorescence readings in arbitrary units (a.u.) for each of the tested sensors in the absence and presence of 1 μM target miRNA.
| Raw fluorescence (a.u) | ||||
|---|---|---|---|---|
| microRNA | # self-paired bases at 3′ end of SL P3 | Sensor + DFHBI alone | Sensor + DFHBI +miRNA | Fold change |
| dme-bantam-5p | 6 | 395 | 46 464 | 118 |
| dme-bantam-5p | 3 | 434 | 46 278 | 107 |
| dme-miR-184 | 6 | 398 | 38 426 | 97 |
| dme-bantam-3p | 3 | 457 | 43 279 | 95 |
| hsa-miR21–5p | 3 | 425 | 29 018 | 68 |
| hsa-let7f | 3 | 553 | 36 679 | 66 |
| hsa-miR223–5p | 3 | 416 | 24 869 | 60 |
| hsa-miR375 | 3 | 443 | 25 957 | 59 |
| hsa-miR122 | 3 | 424 | 20 706 | 49 |
| dme-miR-1 | 6 | 406 | 19 720 | 49 |
| dme-miR-252 | 6 | 991 | 46 368 | 47 |
| dme-miR-263a | 6 | 416 | 11 172 | 27 |
| hsa-miR223–3p | 3 | 1518 | 20 756 | 14 |
| dme-miR-1000 | 6 | 3343 | 26 788 | 8 |
| dme-miR-263a | 3 | 437 | 2903 | 7 |
| dme-miR-1000 | 3 | 5708 | 24 981 | 4 |
| dme-miR-124 | 6 | 10 522 | 41 931 | 4 |
| dme-miR-14 | 6 | 4708 | 14 175 | 3 |
Because it was reported that the second U downstream of SL P3 cannot be mutated without a decrease in fluorescence (17), we designed the sensors so that microRNA binding would result in a U in this position (see Figure 3, and Supplementary Sequences). Our tested sensors function well when complementary sequence for at least 6 nucleotides on both ends of the microRNA are encoded in the sensor (e.g. dme-miR-1, Table 1). About 89% of all human microRNAs have a Uracil within these parameters (Supplementary Table S1). While the requirement for a U in this position may not be absolute, surprisingly, the identity of this nucleotide can significantly affect detection of the miRNA by the sensor (Supplementary Figure S7).
The low apparent sensitivity of the dme-miR-1000, hsa-miR-223–3p, dme-miR-14 and dme-miR-124 sensors was due to high background fluorescence in the absence of the miRNA. While sensor and DFHBI-only background fluorescence usually ranged from ∼400–500 units for the better performing sensors, for these poor performing ones, background fluorescence ranged from ∼1500–10 000 units (Table 1). This resulted in a low fold change in the presence of the microRNA, because fold change depends on the background in the sensor + DFHBI-only controls. This suggests that these sensors alone can bind and stabilize DFHBI to some extent. For the final poorly performing sensor miR-263a, improper folding may be a possible explanation.
Sequence specificity
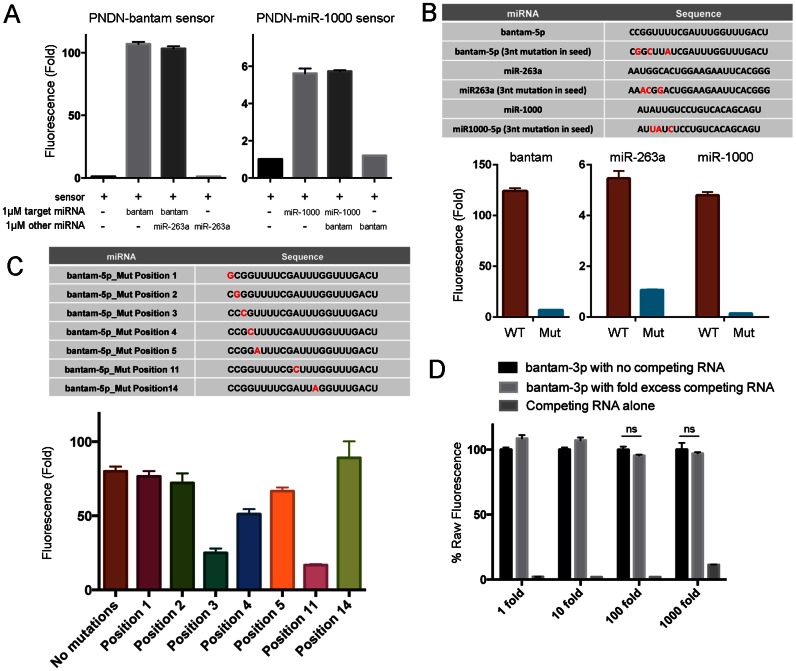
We next investigated the sequence specificity of Pandan sensors. Addition of miR-263a to the bantam-5p-Pandan sensor in the presence of DFHBI did not increase its fluorescence (Figure 5A). Nor did miR-263a reduce the sensitivity of this sensor to bantam-5p miRNA when the two miRNAs were added in equal concentrations. Similar results were obtained when probing the miR-1000 Pandan sensor with bantam-5p miRNA (Figure 5A). Thus, Pandan sensors distinguish between miRNAs with dissimilar sequences.
Figure 5.
Parameters affecting selectivity of Pandan sensors. (A) Fluorescence intensity fold change of Pandan sensors for bantam-5p and miR-1000 miRNAs tested with target and non-target miRNAs. (B and C) Fluorescence intensity of Pandan sensors for bantam-5p, miR-263a and miR-1000 miRNAs tested with perfectly complementarity and sequence modified miRNAs. Panel B shows the effect of changing three residues in the miRNA 5′ end. Panel C shows the effects of single residue changes as a function of position in the miRNA. Sequence changes are shown in red. (D) Performance of the bantam-3p Pandan sensor with increasing fold excess of competing Drosophila total RNA, expressed as a percentage of raw fluorescence of sensor with bantam-3p in the absence of competing RNA. The presence of up to 1000-fold of competing RNA did not decrease the ability of bantam-3p sensor to detect bantam-3p (P > 0.05). Fluorescence experiments were performed in triplicate. Fluorescence intensity fold change shown is with respect to sensor + DFHBI-only controls (in absence of miRNA).
Next, we introduced sequence changes into the test miRNAs to assess the ability of the sensors to discriminate between more closely related sequences. Changing three residues in the 5′ arm of the miRNA strongly reduced sensor fluorescence for the three examples tested (Figure 5B). Single nucleotide mismatches in the microRNA seed reduced bantam-5p sensor activity by ∼10–70%, with the magnitude of the difference being somewhat dependent on the location of the mismatch (Figure 5C). Surprisingly, mismatches near the middle of the microRNA yielded mixed results (Figure 5C). While a comprehensive investigation of sequence modifications was not feasible, these observations suggest the possibility of further improvement to sensor designs for individual target sequences.
For Pandan sensors to be useful for detecting miRNAs in biological samples, the sensor must be able to identify its target RNA in a complex mixture. To test this, we prepared total RNA from adult Drosophila and assayed the ability of the bantam-3p Pandan sensor to detect bantam-3p miRNA spiked into the RNA mixture at a range of concentrations. The presence of up to 1000-fold excess of competing RNA did not decrease the ability of bantam-3p sensor to detect bantam-3p (P > 0.05; Figure 5D).
Pandan sensors detect longer RNAs
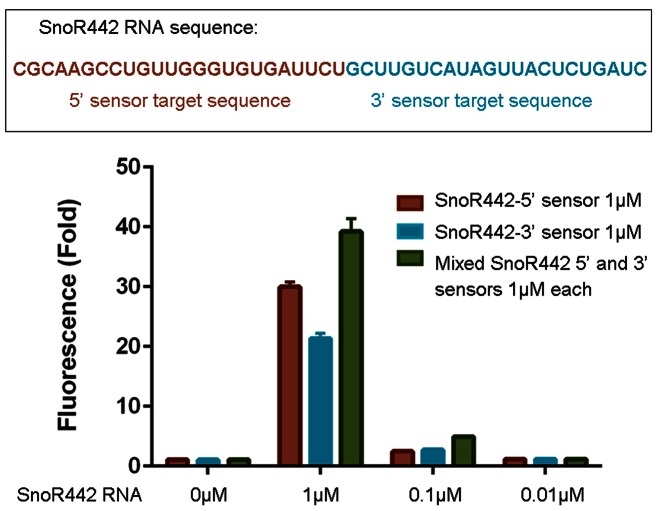
The Pandan sensors described above were designed to allow pairing to the entire 19–25 nucleotides of their respective target miRNAs. To explore whether sensors of this design could be used to detect longer RNA molecules, we prepared sensors for the 46-nucleotide SnoR442 RNA. Pandan sensors complementary to the 5′ or 3′ 23-nucleotide halves of SnoR442 were designed (Figure 6). Both sensors were able to detect SnoR422. The extended unpaired sequence of the target did not appear to compromise sensor binding at either the 5′ or 3′ end. Combining the two sensors had an additive effect on raw fluorescence values (Supplementary Figure S8), and increased fold fluorescence to a moderate degree (Figure 6).
Figure 6.
Pandan sensors for detection of snoRNA. Fluorescence intensity fold change of Pandan sensors for either the 5′ and 3′ halves of SnoR422, shown at different concentrations of added SnoRNA. Fluorescence experiments were performed in triplicate. Fluorescence intensity fold change shown is with respect to sensor + DFHBI-only controls (in absence of miRNA).
DISCUSSION
Based on the Spinach2 aptamer, we have designed a bimolecular microRNA sensor that functions by a conformational change-induced increase in DHFBI fluorescence. Sequence-specific complementary binding of the Pandan sensor to its target miRNA allows the reconstitution of a fluorescent RNA aptamer.
The Pandan aptamer contains two adjacent stem loops (P3 and P4) that are essential for complex stability, but whose sequence can be varied. This structure allows the RNA portion of the RNA-fluorophore complex to be reconstituted by the binding of two separate RNA molecules, one of which can be a short RNA of variable sequence. A similar strategy using a ‘Split-Spinach’ aptamer was recently described as a method for generating RNA fusions to observe RNA dynamics (22).
The Pandan aptamer provides the basis for a series of new microRNA sensors. In our experiments, every microRNA sensor tested was effective, although to varying degrees. We tested Pandan sensors for 14 different miRNAs. Fluorescence ranged from 3- to 118-fold, with a median of 49-fold (Table 1). The best sensors represent a marked improvement over a recently published method using a Spinach-based molecule as a molecular beacon, which showed a maximum of ∼9-fold increase in fluorescence (23), and another method employing a dye and quencher pair, which showed ∼6-fold increase in fluorescence (24). Further improvements to the sensitivity of Pandan sensors should be possible. We were able to make some changes to increase signal strength that were generally applicable, e.g. by extending the length of the stem at the distal end of P3 of the sensor. Based on the crystal structure of Spinach (19,20), the inserted stem-loop P4 of Pandan is located adjacent to the helix formed by stem-loop P3, a few residues distant from the DFHBI-binding three-tetrad quadruplex and base triplet and just upstream of the transition from duplex to quadruplex (Figures 2C and 3). The structural requirements for stem-loops P3 and P4 suggest that the bonding interactions within the G-quadruplex and base triplet are weak, and require the zipper-like function of the flanking duplexes for stability. In Pandan sensors, in the absence of the microRNA, one ‘arm’ of the zipper is absent, destabilizing the G-quadruplex (Figure 3A). We infer that the presence of the miRNA restores quadruplex stability. Given the availability of Pandan structures that perform well and some that do not, modeling these into the solved Spinach structure could provide the basis for a new generation of improved sensor designs.
We showed that Pandan sensors can strongly differentiate between unrelated miRNAs (Figure 5A). For in vivo use, it was important to determine its capability to differentiate between related miRNAs. We found that for bantam-5p miRNA, mutating 3 nucleotides in the seed region of the target microRNA decreased sensor fluorescence by ∼94% (Figure 5B), while single nucleotide mutations in the seed (positions 2–5) decreased fluorescence by 10–70% (Figure 5C). Knowing the inherent limitations, one can use the method to get useful information for many miRNAs and miRNA families whose functions are related.
In summary, Pandan sensors are sensitive, specific and exhibit large fluorescence increases in the presence of their targets. These sensors may have applications in synthetic biology and the strategy of adding adjacent stem loops for the encoding of sequence complementary to the target RNA may be adaptable to other fluorescent RNAs and functional RNA aptamers. Pandan sensors are genetically encodable, and can fluoresce at up to 75% of the brightness of an equimolar amount of Spinach2 (Figure 4C), which has been adapted in vivo as a metabolite sensor and a fluorescent tag. Whether this provides the sensitivity to detect their target microRNAs in vivo, where advanced imaging techniques now allow high resolution imaging of single fluorescent molecules, would depend on the concentration of the microRNA, the effects of the cytoplasm and imaging techniques. This remains to be explored.
Supplementary Material
Acknowledgments
We would like to thank members of the Cohen and Brenner labs for their input and helpful discussions.
Footnotes
Present address: Stephen M. Cohen, Department of Cellular and Molecular Medicine, University of Copenhagen, Blegdamsvej 3, Copenhagen 2200N, Denmark.
FUNDING
Joint Council Office, A*STAR [1331AEG067 to S.A., Y.N.T.]; IMCB core funding; National Medical Research Council Parkinson's Disease TCR Programme Grant (NMRC/TCR/013-NNI/2014 to S.M.C.). Funding for open access charge: National Medical Research Council Parkinson's Disease TCR Programme Grant (NMRC/TCR/013-NNI/2014 to S.M.C.).
Conflict of interest statement. All four authors are inventors on a patent application (provisional patent #10201407990U) related to the Pandan-based microRNA sensors described in this paper.
REFERENCES
- 1.Herranz H., Cohen S.M. MicroRNAs and gene regulatory networks: managing the impact of noise in biological systems. Genes Dev. 2010;24:1339–1344. doi: 10.1101/gad.1937010. [DOI] [PMC free article] [PubMed] [Google Scholar]
- 2.Ebert M.S., Sharp P.A. Roles for microRNAs in conferring robustness to biological processes. Cell. 2012;149:515–524. doi: 10.1016/j.cell.2012.04.005. [DOI] [PMC free article] [PubMed] [Google Scholar]
- 3.Di Leva G., Croce C.M. miRNA profiling of cancer. Curr. Opin. Genet. Dev. 2013;23:3–11. doi: 10.1016/j.gde.2013.01.004. [DOI] [PMC free article] [PubMed] [Google Scholar]
- 4.Maciotta S., Meregalli M., Torrente Y. The involvement of microRNAs in neurodegenerative diseases. Front. Cell Neurosci. 2013;7:1–17. doi: 10.3389/fncel.2013.00265. [DOI] [PMC free article] [PubMed] [Google Scholar]
- 5.Dong H., Lei J., Ding L., Wen Y., Ju H., Zhang X. MicroRNA: function, detection, and bioanalysis. Chem. Rev. 2013;113:6207–6233. doi: 10.1021/cr300362f. [DOI] [PubMed] [Google Scholar]
- 6.Zhou Y., Huang Q., Gao J., Lu J., Shen X., Fan C. A dumbbell probe-mediated rolling circle amplification strategy for highly sensitive microRNA detection. Nucleic Acids Res. 2010;38:e156. doi: 10.1093/nar/gkq556. [DOI] [PMC free article] [PubMed] [Google Scholar]
- 7.Duan R., Zuo X., Wang S., Quan X., Chen D., Chen Z., Jiang L., Fan C., Xia F. Quadratic isothermal amplification for the detection of microRNA. Nat. Protoc. 2014;9:597–607. doi: 10.1038/nprot.2014.036. [DOI] [PubMed] [Google Scholar]
- 8.Jia H., Li Z., Liu C., Cheng Y. Ultrasensitive detection of microRNAs by exponential isothermal amplification. Angew. Chem. Int. Ed. Engl. 2010;49:5498–5501. doi: 10.1002/anie.201001375. [DOI] [PubMed] [Google Scholar]
- 9.Farazi T.A., Horlings H.M., Ten Hoeve J.J., Mihailovic A., Halfwerk H., Morozov P., Brown M., Hafner M., Reyal F., van Kouwenhove M., et al. MicroRNA sequence and expression analysis in breast tumors by deep sequencing. Cancer Res. 2011;71:4443–4453. doi: 10.1158/0008-5472.CAN-11-0608. [DOI] [PMC free article] [PubMed] [Google Scholar]
- 10.Li W., Ruan K. MicroRNA detection by microarray. Anal. Bioanal. Chem. 2009;394:1117–1124. doi: 10.1007/s00216-008-2570-2. [DOI] [PubMed] [Google Scholar]
- 11.Thomson J.M., Parker J., Perou C.M., Hammond S.M. A custom microarray platform for analysis of microRNA gene expression. Nat. Methods. 2004;1:47–53. doi: 10.1038/nmeth704. [DOI] [PubMed] [Google Scholar]
- 12.Kloosterman W.P., Wienholds E., De Bruijn E., Kauppinen S., Plasterk R.H.A. In situ detection of miRNAs in animal embryos using LNA-modified oligonucleotide probes. Nat. Methods. 2006;3:27–29. doi: 10.1038/nmeth843. [DOI] [PubMed] [Google Scholar]
- 13.Hwang D.W., Song I.C., Lee D.S., Kim S. Smart magnetic fluorescent nanoparticle imaging probes to monitor microRNAs. Small. 2010;6:81–88. doi: 10.1002/smll.200901262. [DOI] [PubMed] [Google Scholar]
- 14.Kang W.J., Cho Y.L., Chae J.R., Lee J.D., Choi K.-J., Kim S. Molecular beacon-based bioimaging of multiple microRNAs during myogenesis. Biomaterials. 2011;32:1915–1922. doi: 10.1016/j.biomaterials.2010.11.007. [DOI] [PubMed] [Google Scholar]
- 15.Dong H., Ding L., Yan F., Ji H., Ju H. The use of polyethylenimine-grafted graphene nanoribbon for cellular delivery of locked nucleic acid modified molecular beacon for recognition of microRNA. Biomaterials. 2011;32:3875–3882. doi: 10.1016/j.biomaterials.2011.02.001. [DOI] [PubMed] [Google Scholar]
- 16.Brennecke J., Hipfner D.R., Stark A., Russell R.B., Cohen S.M. bantam encodes a developmentally regulated microRNA that controls cell proliferation and regulates the proapoptotic gene hid in Drosophila. Cell. 2003;113:25–36. doi: 10.1016/s0092-8674(03)00231-9. [DOI] [PubMed] [Google Scholar]
- 17.Paige J.S., Wu K.Y., Jaffrey S.R. RNA mimics of green fluorescent protein. Science. 2011;333:642–646. doi: 10.1126/science.1207339. [DOI] [PMC free article] [PubMed] [Google Scholar]
- 18.Paige J.S., Nguyen-Duc T., Song W., Jaffrey S.R. Fluorescence imaging of cellular metabolites with RNA. Science. 2012;335:1194. doi: 10.1126/science.1218298. [DOI] [PMC free article] [PubMed] [Google Scholar]
- 19.Huang H., Suslov N.B., Li N.S., Shelke S.A., Evans M.E., Koldobskaya Y., Rice P.A., Piccirilli J.A. A G-quadruplex-containing RNA activates fluorescence in a GFP-like fluorophore. Nat. Chem. Biol. 2014;10:686–691. doi: 10.1038/nchembio.1561. [DOI] [PMC free article] [PubMed] [Google Scholar]
- 20.Warner K.D., Chen M.C., Song W., Strack R.L., Thorn A., Jaffrey S.R., Ferre-D'Amare A.R. Structural basis for activity of highly efficient RNA mimics of green fluorescent protein. Nat. Struct. Mol. Biol. 2014;21:658–663. doi: 10.1038/nsmb.2865. [DOI] [PMC free article] [PubMed] [Google Scholar]
- 21.Strack R.L., Disney M.D., Jaffrey S.R. A superfolding Spinach2 reveals the dynamic nature of trinucleotide repeat–containing RNA. Nat. Methods. 2013;10:1219–1224. doi: 10.1038/nmeth.2701. [DOI] [PMC free article] [PubMed] [Google Scholar]
- 22.Rogers T.A., Andrews G.E., Jaeger L., Grabow W.W. Fluorescent monitoring of RNA assembly and processing using the split-spinach aptamer. ACS Synth. Biol. 2015;4:162–166. doi: 10.1021/sb5000725. [DOI] [PubMed] [Google Scholar]
- 23.Bhadra S., Ellington A.D. A spinach molecular beacon triggered by strand displacement. RNA. 2014;20:1183–1194. doi: 10.1261/rna.045047.114. [DOI] [PMC free article] [PubMed] [Google Scholar]
- 24.Yoo B., Kavishwar A., Ghosh S.K., Barteneva N., Yigit M.V., Moore A., Medarova Z. Detection of miRNA expression in intact cells using activatable sensor oligonucleotides. Chem. Biol. 2014;21:199–204. doi: 10.1016/j.chembiol.2013.12.007. [DOI] [PMC free article] [PubMed] [Google Scholar]
Associated Data
This section collects any data citations, data availability statements, or supplementary materials included in this article.


