

Abstract
Carbon isotopic fractionations in the processes of CH4 emission from paddy field remain poorly understood. The δ13C-values of CH4 in association with production, oxidation and transport of CH4 in different pools of a paddy field were determined, and the stable carbon isotope fractionations were calibrated to assess relative contribution of acetate to CH4 production (fac) and fraction of CH4 oxidized (fox) by different pathways. The apparent isotope fractionation for CO2 conversion to CH4 (αapp) was 1.041–1.056 in the soil and 1.046–1.080 on the roots, indicating that fac was 10–60% and 0–50%, respectively. Isotope fractionation associated with CH4 oxidation (αox) was 1.021 ± 0.007 in the soil and 1.013 ± 0.005 on the roots, and the transport fractionation (εtransport) by rice plants was estimated to be −16.7‰ ~ −11.1‰. Rhizospheric fox was about 30–100%, and it was more important at the beginning but decreased fast towards the end of season. Large value of fox was also observed at the soil-water interface and soil and roots surfaces, respectively. The results demonstrate that carbon isotopic fractionations which might be different in different conditions were sensitive to the estimations of fac and fox in paddy field.
Methane (CH4) is the second most important greenhouse gas after carbon dioxide (CO2). On a 100-year horizon, CH4 has 25 times the global warming potential of CO2. Paddy fields are one of the largest anthropogenic sources of atmospheric CH4, contributing to 33–40 Tg yr−1 during the 2000–20091. The global CH4 emission from paddy fields will continually increase by intensification of rice cultivation and expansion of planting area to meet the demands of the growing populations2,3,4. Paddy CH4 emission is an integrated effect of the production, oxidation and transport of CH4 in the field. A better knowledge of these processes affecting CH4 emission may provide more information for effectively mitigating CH4 emission in agricultural ecosystems.
The technique of stable carbon isotopes has been proved to be a useful tool in studying the processes of CH4 emission5,6,7,8,9. Isotope fractionation happens in all the major processes CH4 emission, namely, 12C-substrate is preferentially utilized by methanogens for CH4 production, and once formed, 12CH4 is consumed faster than 13CH4 by methanotrophs, and 12CH4 is transported faster than 13CH4 as well10,11,12. Thereby, measurements of the δ13C in production, oxidation and transport of the CH4 from different pools of the field are benefical to support a process-based model for CH4 emission8,13,14. Moreover, the relative contribution of acetate to CH4 production (fac) and the fraction of CH4 oxidized (fox) can be quantitatively estimated5,6,7 using mass balance equations based on the measurements of δ13C in CH4, CO2 and acetate, and of the isotope fractionation factors ( , αox and εtransport). Investigations on
  ,
,  and εtransport of paddy fields were carried out greatly5,15,16,17,18, however, few data are available on αox for CH4 oxidation by methanotrophs in paddy soils, in particular αox on rice roots19.
Some uncertainties also exist in the δ13CH4 that are used as newly produced δ13CH4 (δ13CH4 (original)) and finally oxidized δ13CH4 (δ13CH4 (oxidized)) in different studies for quantifing fac and fox. For example, former reports in USA using porewater δ13CH4 as δ13CH4 (original)6,7 whereas anaerobically produced δ13CH4 was used in Italy5,20 and China19,21. They believed that porewater CH4 was a poor proxy for δ13CH4 (original) as it was potentially affected by CH4 oxidization and transport in field conditions11,22. Similarly, various δ13CH4, such as rhizospheric δ13CH4, aerobically produced δ13CH4, porewater δ13CH4 or floodwater δ13CH4 sometimes, have been regarded as δ13CH4 (oxidized) for estimation of fox in the rhizosphere or at the soil-water interface5,6,7,9,19,23. More importantly, large differences were observed in the estimated fac and fox if different δ13CH4 (original) and δ13CH4 (oxidized) was assumed in the same study5,7. Therefore, more comparable observations in different conditions with corresponding isotope fractionation factors are needed to discuss δ13CH4 (original) and δ13CH4 (oxidized) in accurate estimations of fac and fox.
In this study, field and incubation experiments were conducted to observe the process of CH4 emission closely related to the production, oxidation and transport of CH4, including CH4 fluxes emitted from the field and via the plants, CH4 concentrations in the aerenchyma of the plants, and in soil pore water and floodwater, CH4 production and oxidation rates in the soil and on the roots, and all the corresponding δ13CH4. The objectives of the present study were (1) to improve our understanding of the processes in CH4 emission by measurements of the stable carbon isotopes, (2) to investigate the isotope fractionation factor αox in the soil and on the roots, and (3) to discuss the availabilities in the estimation of fac and fox associated with different pools of δ13CH4 in the field.
Results
CH4 production and δ13C of CH4 and CO2
In anaerobic incubation, both CH4 production potentials in the soil and on the roots were relatively low on 20 days after rice transplanting (D20), peaked (2.2 μg CH4 g soil−1 d−1 and 11.1 μg CH4 g root−1 d−1) on D50, and then turned downwards gradually to the bottom on D108 (Table 1). For δ13C-value of the produced CH4, it was more and more positive in the soil during the whole observational period, being from −71.1‰ to −53.9‰ (Table 1). For CH4 produced on the roots however, it was most 13C-depleted on D50 and then 13C-enriched again on D88, with δ13C-value ranging between −86.9‰ and −66.6‰ (Table 1). Throughout the whole season, δ13C-value of produced CO2 increased from −18.8‰ to −14.9‰ in the soil while decreased from −15.0‰ to −23.3‰ on the roots (Table 1). CH4 production under aerobic incubation was hardly observed in the soil (0.06 to 0.13 μg CH4 g soil−1 d−1), particularly on the roots, which was lower than 0 μg CH4 g root−1 d−1 over the whole season (Fig. 1a). The δ13C-value of CH4 produced in the soil was relatively stable around −55‰ while on the roots it was about −40‰ (Fig. 1b). Apparently, the δ13C-values of CH4 produced in aerobic incubation were significantly higher (P < 0.05) than those of the CH4 that was produced in anaerobic incubation (Table 1 and Fig. 1).
Table 1. CH4 production potentials (μg CH4 g−1 d−1), δ13C-values (‰) of CH4 and CO2 in the soil and on the roots under anaerobic incubation, and the corresponding apparent fractionation (αapp) between CO2 and CH4 calculated by the ratio of (δ13CO2 + 1000)/(δ13CH4 + 1000).
| Days after rice transplanting (d) |
Production |
δ13CH4 |
δ13CO2 |
αapp |
||||
|---|---|---|---|---|---|---|---|---|
| Soil | Root | Soil | Root | Soil | Root | Soil | Root | |
| 20 | 0.13 ± 0.18 | 3.4 ± 0.7 | −71.1 ± 2.4 | −69.4 ± 2.8 | −18.8 ± 2.9 | −15.0 ± 2.3 | 1.056 ± 0.005 | 1.058 ± 0.002 |
| 50 | 2.15 ± 0.21 | 11.1 ± 2.2 | −64.4 ± 0.4 | −86.9 ± 3.5 | −17.0 ± 1.8 | −14.1 ± 1.7 | 1.051 ± 0.002 | 1.080 ± 0.003 |
| 88 | 0.38 ± 0.12 | 4.5 ± 0.6 | −57.5 ± 1.1 | −66.6 ± 2.7 | −15.1 ± 0.5 | −24.0 ± 2.9 | 1.045 ± 0.001 | 1.046 ± 0.005 |
| 108 | 0.22 ± 0.03 | 3.2 ± 0.9 | −53.9 ± 0.2 | −72.5 ± 2.9 | −14.9 ± 0.4 | −23.3 ± 2.8 | 1.041 ± 0.000 | 1.053 ± 0.001 |
Figure 1.

Temporal variations of CH4 production rates in the soil and on the roots under aerobic (a,b) incubation, and corresponding δ13CH4.
CH4 concentration and δ13C of CH4 and CO2
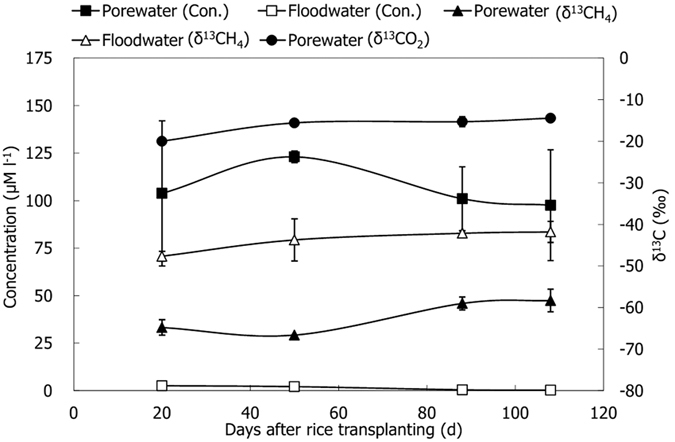
CH4 concentration in soil pore water was more than 100 μM L−1 in most part of the season (Fig. 2), and it was highest (~120 μM L−1) on D50. CH4 concentration in floodwater was in the range of 0.21–2.6 μM L−1, being significantly lower than that of soil pore water over the season (P < 0.01). The δ13C-values of CH4 in soil pore water and floodwater appeared to increase simultaneously (Fig. 2), from ~−70‰ to −60‰ and from ~−50‰ to −40‰, respectively. Obviously, CH4 in soil pore water was more depleted in 13C than that of floodwater CH4 (P < 0.05), indicating that porewater CH4 was intensively affected by CH4 oxidation at the soil-water interface when it released into the atmosphere. CO2 in soil pore water tended to 13C-enriched gradually during the rice season, with δ13C-values ranging from −20.0‰ to −14.5‰ (Fig. 2).
Figure 2. Temporal variations of CH4 concentrations in soil pore water and floodwater, and corresponding δ13C-values of CH4 and CO2.
CH4 oxidation and δ13C of CH4
CH4 oxidation potential in the soil peaked on D50 (6.9 μg CH4 g soil−1 d−1), and then it dropped gradually to the lowest on D108 (Table 2). In contrast, it was highest on the roots (580 μg CH4 g root−1 d−1) on D20 and decreased sharply on D50. After an increase on D88, it decreased again to the lowest on D108 (Table 2). The δ13C-values of CH4 before oxidization were −41.0‰ ~ −38.4‰ in the soil and −40.5‰ ~ −36.0‰ on the roots. After CH4 oxidization, the CH4 both in the soil and on the roots were more enriched in 13C, with δ13C-values of −38.4‰ ~ −32.5‰ and −34.0‰ ~ −26.5‰, respectively (Table 2).
Table 2. CH4 oxidation potentials (μg CH4 g−1 d−1), δ13C-values (‰) of CH4 at time 0 (δ13CH4 (initial)) and at time t (δ13CH4 (final)) in the soil and on the roots under aerobic incubation with high CH4 concentration supplemented, and the corresponding CH4 oxidation fractionation factor (αox) calculated by the Equation (5).
| Days after rice transplanting (d) |
Oxidation |
δ13CH4 (initial) |
δ13CH4 (final) |
αox |
||||
|---|---|---|---|---|---|---|---|---|
| Soil | Root | Soil | Root | Soil | Root | Soil | Root | |
| 20 | 4.4 ± 1.4 | 580 ± 116 | −38.4 ± 1.6 | −38.7 ± 1.9 | −35.6 ± 2.2 | −34.0 ± 2.8 | 1.014 ± 0.002 | 1.019 ± 0.005 |
| 50 | 6.9 ± 1.1 | 335 ± 84 | −41.0 ± 0.4 | −40.4 ± 0.7 | −35.0 ± 1.7 | −26.5 ± 1.9 | 1.020 ± 0.002 | 1.012 ± 0.007 |
| 88 | 5.1 ± 1.9 | 454 ± 68 | −38.7 ± 1.1 | −40.5 ± 2.6 | −32.5 ± 1.0 | −30.6 ± 2.2 | 1.030 ± 0.004 | 1.015 ± 0.003 |
| 108 | 2.3 ± 1.3 | 258 ± 78 | −40.3 ± 0.0 | −36.0 ± 0.2 | −38.4 ± 0.2 | −31.2 ± 3.4 | 1.021 ± 0.009 | 1.008 ± 0.009 |
Plants emitted and aerenchymatic CH4
On the three sampling days (D37, D62 and D98) during the season, CH4 emitted via the plants was relatively stable with δ13C-values of −63.9‰, −62.6‰ and −63.5‰, respectively. For δ13C-values of aerenchymatic CH4, they were −49.2‰, −45.9‰ and −52.4‰, respectively, being significantly higher in comparison of the emitted CH4 (P < 0.05). As a result, the isotope fractionations due to CH4 transport (εtransport) were measured to be −14.7‰, −16.7‰ and −11.1‰, respectively, with a mean value of −14.2‰.
CH4 emission and δ13C of CH4
The CH4 flux varied significantly, with the highest value appeared on D50 and the lowest on D108, ranging from 0.4 to 11.5 mg CH4 m−2 h−1 during the observational period (Fig. 3a). The δ13CH4 (emission) varied between −68.7‰ and −61.5‰ with the variation pattern just opposite to that of CH4 flux (Fig. 3a). It is noteworthy that a significant negative relationship between CH4 flux and corresponding δ13CH4 (emission) was observed (Fig. 3b). Soil temperature ranged from 17.2 °C to 30.5 °C during the rice season, with a value of 24.5 °C on average.
Figure 3.

Temporal variations of CH4 flux and δ13CH4 (a) and they relationship (b).
δ13C of organic carbon in soil and plant samples
The values of δ13C in soil organic carbon did not show much variation during the rice season, being −26.84‰ on D37 and −27.66‰ on D108, respectively. The organic carbon in the plant samples also remained relatively stable over the season, with δ13C-values being −29.19‰ on D37 and −28.70‰ on D108, respectively, although they were slightly lighter than those of the soil organic carbon.
Discussion
CH4 production
The processes of CH4 production, oxidation, transport and emission from paddy field were well presented by the measurements of stable carbon isotopes in CH4 from different pools of the field (Fig. 4). The decomposition of plants debris and root exudates, besides soil organic matters in the bulk soil, is very important to methanogenesis in paddy field24. As a key precursor for methanogens, it was slight 13C-depletion on the roots relative to soil organic carbon (Fig. 4). Previous studies also showed δ13C-value of organic carbon relatively negative in the plant than in the soil5,19. Paddy field CH4 is mainly produced out of either cleavage of acetate (fac) or reduction of H2/CO2 (1 − fac), and the δ13C-value of produced CH4 primarily depends on relative contribution of the two main methanogenic pathways10,25. The fac was calculated by the following mass balance6,7:
Figure 4. Stable carbon isotopes in the processes of CH4 emission from the paddy field.
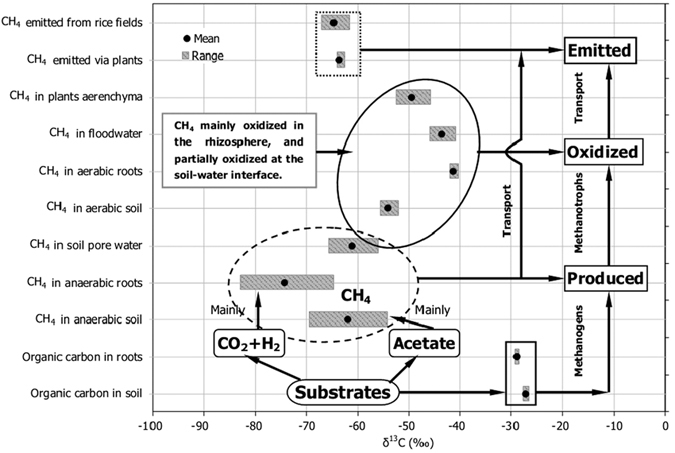
Note: each δ13C-value was given in arithmetic mean of the rice season.
 |
During the process of acetate fermentation forming CH4, isotopic fractionation occurs and the fractionation factor is generally expressed to  . It was found to be −21‰ in pure cultures of acetoclastic Methanosarcina barkeri26 and −18‰ for acetoclastic Methanosaeta concilii15,27. Using
  ‰, Krüger et al.5 estimated δ13C of CH4 produced from acetate (δ13CH4 (acetate)) between −43‰ and −37‰ according to the measurements of δ13Cacetate (−22‰ ~ −16‰) in soil pore water of an Italian rice field. Meanwhile, both values of −43‰ and −37‰ have well been applied in many studies6,7,9,16,19,21. Due to a lack of knowledge on
  and in order to compare the data interpretation with those of above mentioned, both δ13CH4 (acetate) of −43‰ and −37‰ were used in the present study (Table 3).
Table 3. Relative contribution of acetate to total CH4 production (%) in the soil ( f ac a) and on the roots ( f ac b).
| Days after rice transplanting (d) |
faca |
facb |
||||||
|---|---|---|---|---|---|---|---|---|
|
δ13CH4 (acetate) = −37‰ |
δ13CH4 (acetate) = −43‰ |
δ13CH4 (acetate) = −37‰ |
δ13CH4 (acetate) = −43‰ |
|||||
 = 1.050 = 1.050
|
 = 1.060 = 1.060
|
 = 1.050 = 1.050
|
 = 1.060 = 1.060
|
 = 1.070 = 1.070
|
 = 1.080 = 1.080
|
 = 1.070 = 1.070
|
 = 1.080 = 1.080
|
|
| 20 | −21 ± 4 | 8 ± 3 | −27 ± 4 | 9 ± 3 | 24 ± 6 | 37 ± 7 | 28 ± 7 | 41 ± 8 |
| 50 | −2 ± 6 | 23 ± 3 | −3 ± 7 | 28 ± 3 | −20 ± 1 | 0 ± 0 | −23 ± 2 | 1 ± 0 |
| 88 | 18 ± 3 | 39 ± 2 | 24 ± 4 | 48 ± 3 | 42 ± 2 | 50 ± 15 | 47 ± 2 | 56 ± 17 |
| 108 | 32 ± 0 | 50 ± 0 | 42 ± 0 | 61 ± 0 | 29 ± 0 | 39 ± 11 | 33 ± 0 | 44 ± 12 |
faca and facb was calculated with Equation (2) using δ13C-values of CH4 anaerobically produced in the soil and on the roots (Table 1) as originally produced δ13CH4, respectively.
When H2/CO2 reduction produces CH4, isotopic fractionation factor  is defined by Hayes28:
 |
where  is δ13C of the CH4 produced from H2/CO2 reduction. In addition, based on the ratio of δ13CO2 to δ13CH4 in anaerobic incubation (Table 1), an approximation of apparent fractionation (αapp) between CO2 and CH4 can be calculated by using αapp = (δ13CO2 + 1000)/(δ13CH4 + 1000). The αapp is calculated from the isotopic signatures of total CH4 produced from H2/CO2 reduction and acetate cleavage, and theoretically, it is lower than
  . Results of 16 different lake sediments from tropical freshwater wetlands in Brazil29 have well demonstrated that
  (1.075 ± 0.008) is much higher than αapp (1.059 ± 0.009). In this study (Table 1), the αapp decreased gradually from 1.056 on D20 to 1.041 on D108 for the soil. In contrast, it increased sharply from 1.058 on D20 to 1.080 on D50, and then decreased again to 1.053 for the roots. Totally, αapp was relatively lower in the soil (1.041–1.056) than on the roots (1.046–1.080). The
  was hence assumed to be 1.050–1.060 in the soil and 1.070–1.080 on the roots (Table 3). Incubating three different soils, Conrad et al.17 also found that
  was between 1.050 and 1.060 for two paddy soils. Additionally, previous studies approved the relatively larger
  (≥1.070) on the roots than in the soil due to their methanogenic populations were different16,30.
The CH4 produced in anaerobic incubation changed significantly during the rice season, and it was much more 13C-enriched in the soil than on the roots (Table 1). It indicates that methanogenic pathway was changed with rice growing, and also demonstrates that acetate-dependant methanogenesis was more important in the soil. In this study, fac in the soil was initially very low (<10%) on D20, but it increased obviously with the rice growing and reached over 60% on D108. In contrast, fac on the roots was relatively high (~30–40%) on D20. It decreased sharply in the middle of the season (near 0%) and then increased again to about 50% on D108. As a whole, fac was relatively higher in the soil than that on the roots (Table 3). Previous study in Italian paddy soil has also demonstrated that acetoclastic methanogenesis was higher than 60% at the end of the season5. High contribution of H2/CO2-dependent methanogenesis to total CH4 production on rice roots was considerably reported5,9,16,19, and the major reasons were supposed to be the methanogens population on rice roots dominated by Rice Cluster I archaea31,32,33. Methanogenic substrates of organic carbon in the plant appeared to be slightly 13C-depleted relative to those of the bulk soil (Fig. 4), which might be a potential reason for the lower fac in the soil.
On the other hand, Belik et al. and Tyler et al.6,7 estimated fac of the USA paddy fields by using porewater δ13CH4 as δ13C-value of the produced CH4, and they found that it was as high as 80% when  . However, Canadian field data have showed that porewater CH4 is possibly influenced by CH4 oxidation and transport22, and in an Italian paddy field Krüger et al.5 also considered that porewater CH4 was a poor proxy for produced CH4 due to the potential CH4 oxidation therein. Recently, a pot experiment in Germany suggested that porewater CH4 could be used as newly produced CH4 after tillering stage since they were similar in δ13C34. In this study, both porewater δ13CH4 and produced δ13CH4 generally tended to be enhanced during the rice season (Table 1 and Fig. 2), and on average they were similar with each other (Fig. 4). According to δ13C-values of porewater CH4 and CO2 (Fig. 2), it was found that the αapp in soil pore water was from 1.047 to 1.054. Therefore,
  was assumed for comparing with former reports6,7 and present data of the paddy soil. Hydrogenotrophic methanogenesis was estimated to be dominated over the season (~60–80%), which differed much from the field data in USA6,7. More importantly, the methanogenic pathway in soil pore water was different from that in paddy soil (Table 3). Although reasons for the difference in fac between paddy soil and porewater were not clear, it is not recommended here that porewater CH4 was absolutely regarded as newly produced CH4.
CH4 oxidation
The produced CH4 in paddy field is mainly oxidized in the rhizosphere and at the soil-water interface, and accurate estimation of the CH4 oxidation is one of the major aims of this study. Compared to δ13C of newly produced CH4 (δ13CH4 (original)), δ13C of remaining CH4 after it has undergone oxidization (δ13CH4 (oxidized)) was significant 13C-enriched (Fig. 4). Therefore, fraction of the CH4 that is oxidized (fox) in the field can be estimated by the mass balance equation6,7:
 |
In general, anaerobically produced δ13CH4 is regarded as δ13CH4 (original) and δ13CH4 (oxidized) is estimated by the measurements of δ13CH4 (emission) corrected with transport fractionation factor (εtransport) using a semi-empirical equation5,7,16:
 |
In the closed-system incubation, CH4 oxidation fractionation factor αox is known to be calculated according to the Rayleigh equation35,36:
 |
where δ13CH4 (initial) stands for δ13C-value of CH4 at time 0, δ13CH4 (final) for δ13C-value of CH4 at time t, and f (%) for the percentage of CH4 remaining at time t.
To our knowledge, αox = 1.025 − 1.038 at a temperature of 12–35 °C is initially measured in methanotrophs-enriched cultures35 and then widely in landfill cover soils36,37,38, and it has substantially been used in the studies of paddy soil5,6,7,9,20,21,23. Recently, αox = 1.025 − 1.033 was found in a Chinese paddy soil at 28.3 °C19. By far, reports on αox in paddy soil, in particular on rice roots, are very few available. In the present study (Table 2), αox in the soil firstly increased from 1.014 on D20 to the highest value of 1.030 on D88, and then it decreased again to 1.021 on D108. In contrast, αox on the roots generally declined from 1.019 on D20 to the lowest 1.008 on D108. As a whole, it was higher in the soil (1.021 ± 0.007) than on the roots (1.013 ± 0.005) at 24.5 °C, being much lower than those of measured or used in previous studies under a similar temperature as above mentioned. In addition to αox-value of 1.021 ± 0.007 in the soil and 1.013 ± 0.005 on the roots was used, we made an alternative calculation using αox = 1.038 for better comparable to the previous studies (Table 4). Reasons for the difference in αox between paddy soils and rice roots are not understood, but Jahnke et al.39 found that there were complex factors influencing the isotopic fractionation in CH4 oxidation and carbon assimilation in various methanotrophs. Besides, main groups of methanotrophs in rice microcosm (Methylococcaceae and Methylocystaceae) are active, but their dominance may change depending upon substrate supply and nutrient status40,41. Therefore, it is no wonder that our measurement of αox in paddy soil was different from that on rice roots, and that both of them differed much from that found in different environments and habitats as above mentioned. On the other hand, εtransport is equivalent to the difference between emitted and aerenchymatic δ13CH45,7, and it was estimated to be −14.2‰ on average (Detailed descriptions please see below).
Table 4. Fraction of CH4 oxidized (%) in the rhizosphere ( foxa) and at the soil-water interface ( foxb) in field conditions, and at the surfaces of soil ( foxc) and rice roots ( foxd) in lab conditions.
| Days after rice transplanting (d) |
αox = 1.021 |
αox = 1.013 |
αox = 1.038 |
|||||
|---|---|---|---|---|---|---|---|---|
| foxa | foxb | foxc | foxd | foxa | foxb | foxc | foxd | |
| 20 | 108 ± 16 | 88 ± 16 | 78 ± 18 | 235 ± 26 | 61 ± 9 | 49 ± 7 | 44 ± 10 | 82 ± 9 |
| 50 | 51 ± 6 | 116 ± 25 | 61 ± 6 | 372 ± 43 | 29 ± 3 | 65 ± 14 | 34 ± 3 | 130 ± 16 |
| 88 | 42 ± 16 | 86 ± 22 | 27 ± 3 | 209 ± 27 | 23 ± 9 | 48 ± 12 | 15 ± 2 | 73 ± 10 |
| 108 | 33 ± 22 | 84 ± 12 | −4 ± 13 | 244 ± 24 | 19 ± 12 | 47 ± 7 | −2 ± 8 | 86 ± 9 |
foxa was calculated with Equation (5) using δ13C-values of CH4 anaerobically produced in the soil (Table 1) as δ13CH4 (original) and δ13CH4 (emission) (Fig. 3a) minus −14.2‰ as δ13CH4 (oxidized);
Rhizospheric CH4 oxidation was the most important on D20 (Table 4). At that time, almost the produced CH4 was oxidized before it was emitted into the atmosphere. With the rice growing, the fox decreased fast to ~30% in the end. Both CH4 oxidation potentials in the soil and on the roots were highest between D20 and D50, and decreased gradually towards the end of the season (Table 2), which might be the important reason. In situ inhibitor experiments, Krüger et al.42 also found that fox was highest just at the beginning of the season with a peak of ~40%, and then it became negligible at the end of the season. Soon later, it was reported that fox was no more than 50% over the season and it decreased rapidly from the beginning till the end of the season5,20. They further concluded the possible reason was that activities of the methanotrophs were limited by nitrogen consumption with the rice growing under field conditions5,20,42.
When porewater CH4 released into the floodwater of the paddy fields, it was strongly oxidized at the soil-water interface since floodwater CH4 was much more 13C-enriched than porewater CH4 (Fig. 2). So, fox in this oxidizing area, in principle, can be estimated using porewater δ13CH4 as δ13CH4 (original) and floodwater δ13CH4 as δ13CH4 (oxidized). Value of fox was found to be over 80% throughout the whole season, which was generally higher than that of fox in the rhizosphere (Table 4). Although fox at the soil-water interface appeared to be much high, the amount of the CH4 oxidized must be significantly lower than that in the rhizosphere. Because produced CH4 is mostly oxidized in the rhizosphere during the rice-growing season as over 90% of the CH4 emits to the atmosphere through the aerenchyma of the plants while less than 0.1% releases via ebullition and diffusion24,43,44. In addition, it was reported that the absolute CH4 oxidation rate at the soil-water interface was much lower than that in the rhizosphere24,45,46.
Compared to methanogenesis in anaerobic soil, that was in aerobic soil significantly lower in CH4 production rate but more positive in δ13C (Fig. 4). The findings demonstrate that intensive CH4 oxidization happened at the soil surface in lab conditions. As a result, fox at the soil surface (Table 4) was estimated using anaerobically produced δ13CH4 as δ13CH4 (original) and aerobically produced δ13CH4 as δ13CH4 (oxidized)19. It was the highest (~80%) at the beginning of the season and decreased rapidly later (<0%). In field conditions, CH4 oxidation in paddy field without rice plants occurs mainly at the soil-water interface, which is similar to CH4 oxidation under aerobic incubation in lab conditions. Therefore, it is feasible to quantitatively estimate fox in paddy fields during the non-rice-growing season or at the soil-water interface during the rice-growing season based on the difference in δ13CH4 between anaerobic and aerobic incubations. What is more, fox at the root surface was also estimated by comparing δ13C-value of the CH4 produced under aerobic conditions with those under anaerobic conditions (Table 4). It was found that fox at the root surface stayed over 100% throughout the whole season. Even if the αox = 1.038 was used, it was still as high as 100% (Table 4), further suggesting that CH4 oxidation on rice roots was extremely strong indeed. CH4 oxidation rate much higher on the roots (Table 2) was supposed to be the main reason for the fox was higher than that in the soil.
CH4 transport and emission
Transporting CH4 is the last step of CH4 emission from paddy field to the atmosphere. Although CH4 oxidation leads to the produced CH4 obviously enriched in 13C, isotope fractionation in CH4 transport offsets the positive effect on δ13CH4, causing the CH4 13C-depleted again13,22. As a result, the δ13C-values of emitted CH4 were close to the produced δ13CH4 (Fig. 4). The isotope fractionation changes with the efficiency of CH4 transport in growth of the plants5,9,23. In the middle of the season, CH4 transport capacity of the plants should get to highest because of full-developed rice plants and roots. Transport fractionation at that time is believed to be strongest and a value of −16.7‰ for εtransport was measured on D62. At the beginning of the season or aging in the late part of the season, transport fractionation would be relatively weak due to the undeveloped plants with low CH4 transport capacity. Therefore, the εtransport was found to be −14.7‰ on D37 and −11.1‰ on D98. Many reports have shown a similar variation and it is generally between −16‰ and −11‰5,6,7,9,13,19.
Similar to CH4 emission from paddy fields, δ13CH4 (emission) is significantly affected by all each process of CH4 production, oxidation and transport. At the beginning of the season, the high δ13CH4 (emission) was most likely ascribed to the relatively low transport fractionation and the highest fox. Subsequently, it became lowest, which was supposed to be the biggest transport fractionation and significantly decreased fox. At the late period of the season, the emitted CH4 was 13C-enriched again, mainly due to an obvious increase of fac at this moment. The δ13CH4 (emission) was negatively correlated with CH4 emission (Fig. 3b), which further indicates that the higher the CH4 flux, the lower the fox, thus causing the lower the emitted δ13CH4. Similar relationships were also observed in the previous studies9,21,47.
In conclusion, this study well showed each process of CH4 emission by the measurements of δ13CH4 from various pools of the paddy field, and found that stable carbon isotope fractionation occurred in CH4 production, oxidation and transport. Compared to the roots (1.046–1.080 and 1.013 ± 0.005), αapp was lower (1.041–1.056) whereas αox was greater (1.021 ± 0.007) in the soil. This suggests that acetate-dependent methanogenesis was more important in paddy soil whereas CH4 oxidation was much stronger on the roots. Rice plant-mediated CH4 transport fractionation (εtransport) was found to be −16.7‰ ~ −11.1‰. Temporal variation of CH4 emission negatively correlated with δ13CH4 (emission) indicates the important relationships of CH4 emission with production, oxidation and transport of the CH4, which could be demonstrated by the changes of pathway of CH4 production and fraction of CH4 oxidation. Besides related newly produced δ13CH4 and finally oxidized δ13CH4, available carbon fractionation factors were needed to estimate relative contribution of acetate to total CH4 production and fraction of CH4 oxidized.
Methods
Experimental site
The experimental plots are located at Baitu Town, Jurong City, Jiangsu Province, China (31°58′N, 119°18′E). Soil of the field is classified as Typic Haplaquepts, with 11.1 g kg−1 in total C, 1.3 g kg−1 in total N and −26.8‰ in δ13C-value of soil carbon. After wheat was harvested on June 13, 2009, wheat straw with stubble and even wild weeds were all removed from the plots. Then the plots were kept flooded from June 24 to October 15 and drained on October 16 before rice harvest. Seeds of the rice (“Oryza sativa L. Huajing 3”) crop were sown into the nursery bed on May 25, seedlings were transplanted into the field on June 26, and the crop was harvested on November 3. Urea was applied at a rate of 300 kg N ha−1, 50% as basal fertilizer on June 26, 25% as tillering fertilizer on July 17, and 25% as panicle fertilizer on August 16. Ca(H2PO4)2 (450 kg ha−1) and KCL (225 kg ha−1) was applied with urea just as basal fertilizer on June 26.
Field sampling
CH4 flux was monitored using the static chamber technique. The flux chambers (0.5 × 0.5 × 1 m), made of plexiglass, covered six hills of rice plants each. Plastic bases for the chambers were installed before rice transplantation in the plots. Removable wooden boardwalks (2 m long) were set up at the beginning of the rice season to avoid soil disturbance during sampling and measuring. To measure CH4 flux, gas samples were usually collected once every 4–7 days. Four gas samples from each chamber were collected using 18 mL vacuum vials at 15 min intervals between 09:45 and 10:30 in the morning on each sampling day. To determine carbon isotope composition of the CH4 gas (δ13CH4 (emission)), samples were taken at 15–30 day intervals. Only two gas samples were collected using 0.5 L bags (aluminium foil compound membrane, Delin gas packing Co., Ltd, Dalian, China) with a small battery-driven pump47. The first sample was taken after the chamber was closed for 3–5 min, and the second at the end of the 2 h closure period. When CH4 flux was monitored, soil temperature at 10 cm depth was simultaneously measured with a hand-carried digital thermometer (Yokogawa Meter and Instruments Corporation, Japan).
Soil pore water samples, 10 cm in depth, were collected using a Rhizon soil moisture sampler (10 RHIZON SMSMOM, Eijkelkamp Agrisearch Equipment, Giesbeek, Netherlands)47. The samplers were installed (in triplicate) prior to rice transplanting and then left in the soil throughout the whole season. Samples (about 5 mL) were firstly extracted using 18 mL vacuum vials to flush and purge the sampler before sampling. Then about 10 mL of soil solution was drawn into another vial. Simultaneously, 10 mL of floodwater was collected using a plastic syringe and then transferred in to an 18 mL vacuum vial. Subsequently, all sampling vials were equilibrated by filling in pure N2 gas for further analysis with a GC-FID.
CH4 emitted via rice plants and the aerenchymatic CH4 was measured using specially designed PVC bottomless pots19. The pot, 30 cm in height and 17 cm in diameter, was designed to have a water-filled trough around its top, avoiding any possible gas exchange during the sampling times. A PVC plate (18 cm in diameter) with a hole adjustable in diameter to fit the growing plant in the center was placed on top of the pot, allowing the plant to grow through the hole and keeping the plant into two parts. Then, the plant in one pot was cut right above the plate while the plant in the other pot remained intact as control. Finally, chambers (0.3 × 0.3 × 1 m) were laid on the pots, and gas samples in the headspace of the chambers were collected simultaneously with a small battery-driven pump.
Soil cores of the top layer (0–15 cm) were collected at about 15–30-day intervals, and samples of the same plot were first mixed together48. Two samples from the mixture, about 50 g each (dry weight), were then taken and transferred promptly into two 250-mL Erlenmeyer flasks separately. Samples in the flasks were prepared into slurries with N2-flushed de-ionized sterile water at a soil/water ratio of 1:1. During the whole process, N2 was constantly flushed through the samples to remove O2 and CH4. One flask was sealed for anaerobic incubation. Other flask with air headspace was sealed directly for aerobic incubation. Simultaneously, rice plants together with roots were carefully collected from the plots48. The roots were washed clean with N2-flushed demineralized water and cut off at 1–2 cm from the root with a razor blade. The fresh roots, about 20 g each portion, were put into flasks, separately, for further preparation and processing in the same way as for the soil samples. All the flasks were sealed with rubber stoppers fitted with silicon septum that allowed sampling of headspace gas. Finally, they were stored under N2 at 4 °C and transported back to the lab as soon as possible for further analysis. A small portion of the soil and plant samples were dried for 72 h at 60 °C for determination of isotopic composition of the organic carbon.
Lab incubations
CH4 production potentials were measured under anaerobic incubation. The flasks were flushed with N2 consecutively for six times through double-ended needles connecting a vacuum pump to purge the air in the flasks of residual CH4 and O2. Simultaneously, methanogenesis was determined aerobically using flasks with air headspace directly. They were incubated in darkness at a temperature the same as measured in the field for 50 h. Gas samples were analyzed 1 h and 50 h later after heavily shaking the flasks by hand. CH4 production rates were calculated using the linear regression of CH4 increasing with the incubation time.
CH4 oxidation potentials were determined under aerobic incubation with high concentration of CH4 supplemented, using equipment the same as described above. Firstly, pure CH4 was injected into each flask to make a high concentration inside (~10,000 μL L−1). Then, the flasks were incubated in darkness under the same temperature as measured in the field and shaken at 120 r.p.m. CH4 depletion was measured by sampling the headspace gas in the flask after vigorous shaking for subsequent analysis. The first sample was collected generally 30 min after pure CH4 was injected. Samples were then taken at 2–3 h intervals during the first 8 h of the experiment. The flasks were left over night and sampled the next day at 2 h intervals again. CH4 oxidation rates were calculated by linear regression of CH4 depletion with incubation time.
Chemical measurements
CH4 concentrations were analyzed with a gas chromatograph (Shimadzu GC-12A, Kyoto, Japan) equipped with a flame ionization detector. For analysis of carbon isotope composition, the continuous flow technique and a Finnigan MAT 253 isotope ratio mass spectrometer was used (Thermo Finnigan, Bremen, Germany)47,49. CO2 in gas samples was directly analyzed while CH4 in gas samples was converted into CO2 and separated primarily on a PreCon (pre-concentration device). Then, the gas was piped into a GC equipped with a Pora PLOT Q column (25 m length; 0.35 mm i.d.) at 25 °C under 2.0 × 10⁵ Pa for further separation. The separated gases were finally transferred into the mass spectrometer for δ13C determination. The reference and carrier gases used were CO2 (99.999% in purity and −23.73‰ in δ13CPDB-value) and He (99.999% in purity, 20 mL min−1), respectively. The precision of the repeated analysis was ±0.2‰ when 2.02 μL L−1 CH4 was injected. The dried soil and plant samples were analyzed for carbon isotope composition with a Finnigan MAT-251 Isotope Ratio Mass Spectrometer (Thermo Finnigan, Bremen, Germany).
Statistical analyses
Statistical analysis was done using the SPSS 18.0 software for Windows (SPSS Inc., Chicago). Differences between the four treatments were determined through one-way analysis of variance (ANOVA) and least significant difference (LSD) test. Relationships were assessed using correlation analysis. Significant differences and correlations were set at P < 0.05.
Additional Information
How to cite this article: Zhang, G. et al. Carbon isotope fractionation reveals distinct process of CH4 emission from different compartments of paddy ecosystem. Sci. Rep. 6, 27065; doi: 10.1038/srep27065 (2016).
Acknowledgments
The authors are grateful to our anonymous reviewers for their helpful comments. Many thanks are also given to Prof. Jia ZJ for his valuable suggestions. This research work was financially supported by the “Strategic Priority Research Program” of the Chinese Academy of Sciences (XDB15020103), the National Key Technology Research and Development Program (2013BAD11B02), the National Natural Sciences Foundation of China (41571232, 41271259, 41201243), and Foundation of the State Key Laboratory of Soil and Sustainable Agriculture (Y412010003).
Footnotes
Author Contributions G.Z. and H.X. conceived and designed the research; G.Z., J.M., H.Y. and X.F. performed the experiment; G.Z., J.M. and H.X. analyzed data; G.Z. and H.X. wrote the main manuscript text; G.Z., J.M. and H.X. reviewed the manuscript.
References
- Ciais P. et al. (ed [ Stocker T. F., Qin D., Plattner G.-K., Tignor M., Allen S. K., Boschung J., Nauels A., Xia Y., Bex V. & Midgley P. M. ]) (Cambridge University Press, Cambridge, United Kingdom and New York, NY, USA, 2013).
- Bouwman A. F. Agronomic aspects of wetland rice cultivation and associated methane emissions. Biogeochemistry 15, 65–88 (1991). [Google Scholar]
- Ali M. A., Lee C. H., Lee Y. B. & Kim P. J. Silicate fertilization in no-tillage rice farming for mitigation of methane emission and increasing rice productivity. Agr Ecosyst Environ 132, 16–22 (2009). [Google Scholar]
- Linquist B., van Groenigen K. J., Adviento-Borbe M. A., Pittelkow C. & van Kessel C. An agronomic assessment of greenhouse gas emissions from major cereal crops. Global Change Biol 18, 194–209 (2012). [Google Scholar]
- Krüger M., Eller G., Conrad R. & Frenzel P. Seasonal variation in pathways of CH4 production and in CH4 oxidation in rice fields determined by stable carbon isotopes and specific inhibitors. Global Change Biol 8, 265–280 (2002). [Google Scholar]
- Bilek R. S., Tyler S. C., Sass R. L. & Fisher F. M. Differences in CH4 oxidation and pathways of production between rice cultivars deduced from measurements of CH4 flux and d13C of CH4 and CO2. Global Biogeochem Cy 13, 1029–1044 (1999). [Google Scholar]
- Tyler S. C., Bilek R. S., Sass R. L. & Fisher F. M. Methane oxidation and pathways of production in a Texas paddy field deduced from measurements of flux, δ13C, and δD of CH4. Global Biogeochem Cy 11, 323–348 (1997). [Google Scholar]
- Bergamaschi P. Seasonal variations of stable hydrogen and carbon isotope ratios in methane from a Chinese rice paddy. J Geophys Res 102, 25383–25393 (1997). [Google Scholar]
- Zhang G. B. et al. Methanogenic pathway and fraction of CH4 oxidized in paddy fields: Seasonal variation and effect of water management in winter fallow season. PLoS one 8, e73982 (2013). [DOI] [PMC free article] [PubMed] [Google Scholar]
- Whiticar M. J. Carbon and hydrogen isotope systematics of bacterial formation and oxidation of methane. Chem Geol 161, 291–314 (1999). [Google Scholar]
- Chanton J. P. The effect of gas transport on the isotope signature of methane in wetlands. Org Geochem 36, 753–768 (2005). [Google Scholar]
- Venkiteswaran J. J. & Schiff S. L. Methane oxidation: isotopic enrichment factors in freshwater boreal reservoirs. Appl Geochem 20, 683–690 (2005). [Google Scholar]
- Chanton J. P., Whiting G. J., Blair N. E., Lindau C. W. & Bollich P. K. Methane emission from rice: Stable isotopes, diurnal variations, and CO2 exchange. Global Biogeochem Cy 11, 15–27 (1997). [Google Scholar]
- Marik T., Fischer H., Conen F. & Smith K. Seasonal variations in stable carbon and hydrogen isotope ratios in methane from rice fields. Global Biogeochem Cy 16, Artn 1094 (2002). [Google Scholar]
- Fey A., Claus P. & Conrad R. Temporal change of 13C-isotope signatures and methanogenic pathways in rice field soil incubated anoxically at different temperatures. Geochim Cosmochim Ac 68, 293–306 (2004). [Google Scholar]
- Conrad R., Klose M. & Claus P. Pathway of CH4 formation in anoxic rice field soil and rice roots determined by 13C-stable isotope fractionation. Chemosphere 47, 797–806 (2002). [DOI] [PubMed] [Google Scholar]
- Conrad R., Klose M., Lu Y. & Chidthaisong A. Methanogenic pathway and archaeal communities in three different anoxic soils amended with rice straw and maize straw. Fron microb 3, 4–4 (2012). [DOI] [PMC free article] [PubMed] [Google Scholar]
- Conrad R. & Klose M. Stable carbon isotope discrimination in rice field soil during acetate turnover by syntrophic acetate oxidation or acetoclastic methanogenesis. Geochim Cosmochim Ac 75, 1531–1539 (2011). [Google Scholar]
- Zhang G. B. et al. Pathway of CH4 production, fraction of CH4 oxidized, and 13C isotope fractionation in a straw incorporated rice field. Biogeosciences 10, 3375–3389 (2013). [Google Scholar]
- Krüger M. & Frenzel P. Effects of N-fertilisation on CH4 oxidation and production, and consequences for CH4 emissions from microcosms and rice fields. Global Change Biol 9, 773–784 (2003). [Google Scholar]
- Zhang G. B. et al. Intermittent irrigation changes production, oxidation, and emission of CH4 in paddy fields determined with stable carbon isotope technique. Soil Biol Biochem 52, 108–116 (2012). [Google Scholar]
- Popp T. J., Chanton J. P., Whiting G. J. & Grant N. Methane stable isotope distribution at a Carex dominated fen in north central Alberta. Global Biogeochem Cy 13, 1063–1077 (1999). [Google Scholar]
- Conrad R. & Klose M. Effect of potassium phosphate fertilization on production and emission of methane and its 13C-stable isotope composition. Soil Biol Biochem 37, 2099–2108 (2005). [Google Scholar]
- Kimura M., Murase J. & Lu Y. H. Carbon cycling in rice field ecosystems in the context of input, decomposition and translocation of organic materials and the fates of their end products (CO2 and CH4). Soil Biol Biochem 36, 1399–1416 (2004). [Google Scholar]
- Whiticar M. J., Faber E. & Schoell M. Biogenic methane formation in marine and freshwater environments: CO2 reduction vs. acetate fermentation—isotopic evidence. Geochim Cosmochim Ac 50, 693–709 (1986). [Google Scholar]
- Gelwicks J. T., Risatti J. B. & Hayes J. M. Carbon isotope effects associated with aceticlastic methanogenesis. Appl Environ Microb 60, 467–472 (1994). [DOI] [PMC free article] [PubMed] [Google Scholar]
- Valentine D. L., Chidthaisong A., Rice A., Reeburgh W. S. & Tyler S. C. Carbon and hydrogen isotope fractionation by moderately thermophilic methanogens. Geochim Cosmochim Ac 68, 1571–1590 (2004). [Google Scholar]
- Hayes J. M. Factors controlling 13C contents of sedimentary organic compounds: principles and evidence. Mar Geol 113, 111–125 (1993). [Google Scholar]
- Conrad R. et al. Stable carbon isotope discrimination and microbiology of methane formation in tropical anoxic lake sediments. Biogeosciences 8, 795–814 (2011). [Google Scholar]
- Conrad R., Klose M. & Claus P. Phosphate inhibits acetotrophic methanogenesis on rice roots. Appl Environ Microb 66, 828–831 (2000). [DOI] [PMC free article] [PubMed] [Google Scholar]
- Conrad R., Erkel C. & Liesack W. Rice Cluster I methanogens, an important group of Archaea producing greenhouse gas in soil. Curr Opin Biotech 17, 262–267 (2006). [DOI] [PubMed] [Google Scholar]
- Lu Y. H. & Conrad R. In situ stable isotope probing of methanogenic archaea in the rice rhizosphere. Science 309, 1088–1090 (2005). [DOI] [PubMed] [Google Scholar]
- Lu Y. H., Lueders T., Friedrich M. W. & Conrad R. Detecting active methanogenic populations on rice roots using stable isotope probing. Environ Microbiol 7, 326–336 (2005). [DOI] [PubMed] [Google Scholar]
- Yuan Q., Pump J. & Conrad R. Partitioning of CH4 and CO2 production originating from rice straw, soil and root organic carbon in rice microcosms. PloS one 7, e49073 (2012). [DOI] [PMC free article] [PubMed] [Google Scholar]
- Coleman D. D., Risatti J. B. & Schoell M. Fractionation of carbon and hydrogen isotopes by methane-oxidizing bacteria. Geochim Cosmochim Ac 45, 1033–1037 (1981). [Google Scholar]
- Liptay K., Chanton J., Czepiel P. & Mosher B. Use of stable isotopes to determine methane oxidation in landfill cover soils. J Geophys Res 103, 8243–8250 (1998). [Google Scholar]
- Chanton J. P. & Liptay K. Seasonal variation in methane oxidation in a landfill cover soil as determined by an in situ stable isotope technique. Global Biogeochem Cy 14, 51–60 (2000). [Google Scholar]
- Chanton J. P., Powelson D. K., Abichou T., Fields D. & Green R. Effect of temperature and oxidation rate on carbon-isotope fractionation during methane oxidation by landfill cover materials. Environ Sci Technol 42, 7818–7823 (2008). [DOI] [PubMed] [Google Scholar]
- Jahnke L. L., Summons R. E., Hope J. M. & Des Marais D. J. Carbon isotopic fractionation in lipids from methanotrophic bacteria II: The effects of physiology and environmental parameters on the biosynthesis and isotopic signatures of biomarkers. Geochim Cosmochim Ac 63, 79–93 (1999). [DOI] [PubMed] [Google Scholar]
- Bodelier P. L. E., Roslev P., Henckel T. & Frenzel P. Stimulation by ammonium-based fertilizers of methane oxidation in soil around rice roots. Nature 403, 421–424 (2000). [DOI] [PubMed] [Google Scholar]
- Eller G. & Frenzel P. Changes in activity and community structure of methane-oxidizing bacteria over the growth period of rice. Appl Environ Microb 67, 2395–2403 (2001). [DOI] [PMC free article] [PubMed] [Google Scholar]
- Krüger M., Frenzel P. & Conrad R. Microbial processes influencing methane emission from rice fields. Global Change Biol 7, 49–63 (2001). [Google Scholar]
- Holzapfel-pschorn A., Conrad R. & Seiler W. Effects of vegetation on the emission of methane from submerged paddy soil. Plant Soil 92, 223–233 (1986). [Google Scholar]
- Schütz H., Seiler W. & Conrad R. Processes involved in formation and emission of methane in rice paddies. Biogeochemistry 7, 33–53 (1989). [Google Scholar]
- Gilbert B. & Frenzel P. Methanotrophic bacteria in the rhizosphere of rice microcosms and their effect on porewater methane concentration and methane emission. Biol Fert Soils 20, 93–100 (1995). [Google Scholar]
- Kumaraswamy S. et al. Spatial distribution of methane-oxidizing activity in a flooded rice soil. Plant Soil 191, 241–248 (1997). [Google Scholar]
- Zhang G. B. et al. Carbon isotopic composition, methanogenic pathway, and fraction of CH4 oxidized in a rice field flooded year-round. J Geophys Res 116, G04025 (2011). [Google Scholar]
- Zhang G. B., Zhang X. Y., Ma J., Xu H. & Cai Z. C. Effect of drainage in the fallow season on reduction of CH4 production and emission from permanently flooded rice fields. Nutr Cycl Agroecosys 89, 81–91 (2011). [Google Scholar]
- Cao Y. C., Sun G. Q., Han Y., Sun D. L. & Wang X. Determination of N, C and O stable isotope ratios in N2O, CH4 and CO2 at natural abundance levels by mass spectrometer. Ac Pedol Sin (In Chinese) 45, 249–258 (2008). [Google Scholar]