

Abstract
It is often of interest to decompose the total effect of an exposure into a component that acts on the outcome through some mediator and a component that acts independently through other pathways. Said another way, we are interested in the direct and indirect effects of the exposure on the outcome. Even if the exposure is randomly assigned, it is often infeasible to randomize the mediator, leaving the mediator-outcome confounding not fully controlled. We develop a sensitivity analysis technique that can bound the direct and indirect effects without parametric assumptions about the unmeasured mediator-outcome confounding.
Keywords: Bounding factor, Causal inference, Collider, Natural direct effect, Natural indirect effect
1. Introduction
Researchers often conduct mediation analysis to assess the extent to which an effect of an exposure on the outcome is mediated through a particular pathway and the extent to which the effect operates directly. Mediation analysis initially developed within genetics and psychology based on linear structural equation models (Wright, 1934; Baron & Kenny, 1986), and has been formalized by the notions of natural direct and indirect effects under the potential outcomes framework (Robins & Greenland, 1992; Pearl, 2001) and the decision-theoretic framework (Didelez et al., 2006; Geneletti, 2007). However, identification of natural direct and indirect effects used in that literature relies on strong assumptions, including the assumption of no unmeasured mediator-outcome confounding (Pearl, 2001; Imai et al., 2010; VanderWeele, 2010). Even if we can rule out unmeasured exposure-mediator and exposure-outcome confounding by randomly assigning the exposure, full control of mediator-outcome confounding is often impossible because it is infeasible to randomize the mediator. Therefore, it is crucial in applied mediation analyses to investigate the sensitivity of the conclusions to unmeasured mediator-outcome confounding. Previous sensitivity analysis techniques rely on restrictive modelling assumptions (Imai et al., 2010), use sensitivity parameters involving counterfactual terms (Tchetgen Tchetgen & Shpitser, 2012), or require the specification of a large number of sensitivity parameters (VanderWeele, 2010). Other work (Sjölander, 2009; Robins & Richardson, 2010) has provided bounds for natural direct and indirect effects without imposing assumptions, but these consider the most extreme scenarios and the bounds are often too broad to be useful in practice. We develop a sensitivity analysis technique which has only two sensitivity parameters and does not make any modelling assumptions or any assumptions about the type of the unmeasured mediator-outcome confounder or confounders. Our results imply Cornfield-type inequalities (Cornfield et al., 1959; Ding & VanderWeele, 2014) that the unmeasured confounder must satisfy to reduce the observed natural direct effect to a certain level or explain it away.
2. Notation and framework for mediation analysis
Let  denote the exposure,
  the outcome,
 the mediator,
  a set of observed baseline covariates
not affected by the exposure, and
a set of observed baseline covariates
not affected by the exposure, and  a set of unmeasured baseline covariates
not affected by the exposure. In order to define causal effects, we invoke the potential
outcomes framework (Neyman, 1923; Rubin, 1974) and apply it in the context of
mediation (Robins & Greenland, 1992; Pearl, 2001). If a hypothetical intervention on
a set of unmeasured baseline covariates
not affected by the exposure. In order to define causal effects, we invoke the potential
outcomes framework (Neyman, 1923; Rubin, 1974) and apply it in the context of
mediation (Robins & Greenland, 1992; Pearl, 2001). If a hypothetical intervention on
 is well-defined, we let
  and
and
 denote the potential values of the outcome and the
mediator that would have been observed had the exposure
denote the potential values of the outcome and the
mediator that would have been observed had the exposure  been set to level
 . If hypothetical interventions on
 and
and  are both well-defined, we further let
 denote the potential value of the outcome that would
have been observed had the exposure
denote the potential value of the outcome that would
have been observed had the exposure  been set to level
 and the mediator
  been set to level
 (Robins &
Greenland, 1992; Pearl, 2001).
Following Pearl (2009) and VanderWeele (2015), we need the following
consistency assumption for all
(Robins &
Greenland, 1992; Pearl, 2001).
Following Pearl (2009) and VanderWeele (2015), we need the following
consistency assumption for all  and
and  :
:  and
and
 if
if  ; and
; and  if
if
 and
and  . We further need the composition
assumption that
. We further need the composition
assumption that  for
for  .
.
We will assume that the exposure  is binary, but all the results in this
paper are also applicable to a categorical or continuous exposure and could be used to
compare any two levels of
is binary, but all the results in this
paper are also applicable to a categorical or continuous exposure and could be used to
compare any two levels of  . In the main text we consider a binary outcome
 , but in §6 we note
that all the results hold for count and continuous positive outcomes and time-to-event
outcomes with rare events. The mediator
, but in §6 we note
that all the results hold for count and continuous positive outcomes and time-to-event
outcomes with rare events. The mediator  , the observed covariates
 , and the unmeasured confounder or confounders
 can be of general types, i.e., categorical, continuous or
mixed, and scalar or vector. For notational simplicity, in the main text we assume that
can be of general types, i.e., categorical, continuous or
mixed, and scalar or vector. For notational simplicity, in the main text we assume that
 are categorical, and in the Supplementary Material we present
results for general types.
are categorical, and in the Supplementary Material we present
results for general types.
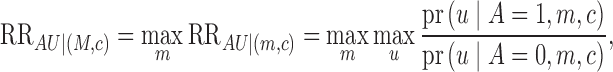
On the risk ratio scale, the conditional natural direct and indirect effects, comparing the
exposure levels  and
and  within the observed covariate level
 , are defined as
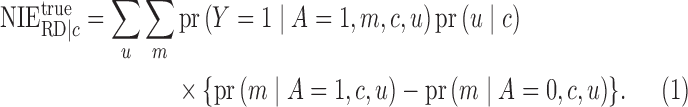
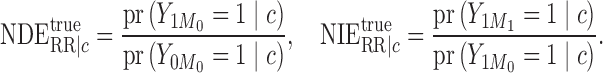 |
(1) |
The conditional natural direct effect compares
the distributions of the potential outcomes when the exposure level changes from
 to
to  but the mediator is fixed at
 The conditional natural indirect effect compares the
distributions of the potential outcomes when the exposure level is fixed at
The conditional natural indirect effect compares the
distributions of the potential outcomes when the exposure level is fixed at
 but the mediator changes from
  to
to
 The conditional total effect can be decomposed as a
product of the conditional direct and indirect effects as follows:
The conditional total effect can be decomposed as a
product of the conditional direct and indirect effects as follows:
 |
On the risk difference scale, the conditional natural direct and indirect effects are defined as
 |
(2) |
 |
(3) |
and the conditional total effect has the decomposition
 |
3. Identification of conditional natural direct and indirect effects
Here we follow the identification strategy of Pearl
(2001) for natural direct and indirect effects. A number of authors have provided
other subtly different sufficient conditions (see, e.g., Imai et al., 2010; Vansteelandt & VanderWeele, 2012; Lendle
et al., 2013). Let  denote independence of
random variables. To identify the conditional natural direct and indirect effects by the
joint distribution of the observed variables
denote independence of
random variables. To identify the conditional natural direct and indirect effects by the
joint distribution of the observed variables  , Pearl (2001) assumed that for all
  and
and
 ,
,
 |
(4) |
The four assumptions in (4) require that the observed covariates
 control exposure-outcome confounding, control
mediator-outcome confounding, control exposure-mediator confounding, and ensure cross-world
counterfactual independence, respectively; on a nonparametric structural equation model
(Pearl, 2009), this fourth assumption is
essentially that none of the mediator-outcome confounders are themselves affected by the
exposure (Pearl, 2001; VanderWeele, 2015). In particular, on the risk ratio scale, we can
identify the conditional natural direct and indirect effects by
control exposure-outcome confounding, control
mediator-outcome confounding, control exposure-mediator confounding, and ensure cross-world
counterfactual independence, respectively; on a nonparametric structural equation model
(Pearl, 2009), this fourth assumption is
essentially that none of the mediator-outcome confounders are themselves affected by the
exposure (Pearl, 2001; VanderWeele, 2015). In particular, on the risk ratio scale, we can
identify the conditional natural direct and indirect effects by
 |
(5) |
 |
(6) |
On the risk difference scale, we can identify the conditional natural direct and indirect effects by
 |
(7) |
 |
(8) |
Proofs of (5)–(8) can be found in Pearl (2001) and VanderWeele (2015).
If we replace  in definitions (1)–(3) by
  , with
  being a
random draw from the conditional distribution
being a
random draw from the conditional distribution  , then we can
drop the cross-world counterfactual independence assumption
, then we can
drop the cross-world counterfactual independence assumption  (VanderWeele,
2015). This view is related to the decision-theoretic framework without using
potential outcomes (Didelez et al., 2006; Geneletti, 2007). We show in the Supplementary Material that because
the alternative frameworks lead to the same empirical identification formulae as in (5)–(8), all our results below can be applied.
(VanderWeele,
2015). This view is related to the decision-theoretic framework without using
potential outcomes (Didelez et al., 2006; Geneletti, 2007). We show in the Supplementary Material that because
the alternative frameworks lead to the same empirical identification formulae as in (5)–(8), all our results below can be applied.
4. Sensitivity analysis with unmeasured mediator-outcome confounding
4.1. Unmeasured mediator-outcome confounding
The assumptions in (4) are strong and
untestable. If the exposure is randomly assigned given the values of the observed
covariates  , as in completely randomized experiments or randomized
block experiments, then the first and third assumptions of (4) hold automatically owing to the randomization. In observational
studies, we may have background knowledge to collect adequate covariates
, as in completely randomized experiments or randomized
block experiments, then the first and third assumptions of (4) hold automatically owing to the randomization. In observational
studies, we may have background knowledge to collect adequate covariates
 to control the exposure-outcome and exposure-mediator
confounding such that the first and third assumptions in (4) are plausible. However, direct intervention on the mediator is
often infeasible, and it may not be possible to randomize. Therefore, the second
assumption in (4), the absence of
mediator-outcome confounding, may be violated in practice. Furthermore, the fourth
assumption in (4) cannot be guaranteed
even under randomization of both
to control the exposure-outcome and exposure-mediator
confounding such that the first and third assumptions in (4) are plausible. However, direct intervention on the mediator is
often infeasible, and it may not be possible to randomize. Therefore, the second
assumption in (4), the absence of
mediator-outcome confounding, may be violated in practice. Furthermore, the fourth
assumption in (4) cannot be guaranteed
even under randomization of both  and
and  , and thus it is
fundamentally untestable (Robins & Richardson,
2010).
, and thus it is
fundamentally untestable (Robins & Richardson,
2010).
For sensitivity analysis, we assume that  jointly ensure (4), that is,
 |
(9) |
When  controls the exposure-mediator and exposure-outcome
confounding, we further assume that
controls the exposure-mediator and exposure-outcome
confounding, we further assume that
 |
(10) |
The independence relationships
in (9) impose no restrictions on the
unmeasured confounders  , and they become assumptions if we require at least
one of the sensitivity parameters introduced in §4.2
to be finite. Figure 1 illustrates such a
scenario with the assumptions in (9)
and (10) holding, where
, and they become assumptions if we require at least
one of the sensitivity parameters introduced in §4.2
to be finite. Figure 1 illustrates such a
scenario with the assumptions in (9)
and (10) holding, where
 contains the common causes of the mediator and the
outcome, and
contains the common causes of the mediator and the
outcome, and  and
and  are conditionally independent given
 In §6 and the
Supplementary Material, we
comment on the applicability of our results under violations of the assumption in (10).
In §6 and the
Supplementary Material, we
comment on the applicability of our results under violations of the assumption in (10).
Fig. 1.

Directed acyclic graph with mediator-outcome confounding within strata of observed
covariates  .
.
Under the assumptions in (9) and
(10), we can express conditional
natural direct and indirect effects using the joint distribution of
 . In particular, on the risk ratio scale,
 |
(11) |
 |
(12) |
On the risk difference scale,
 |
(13) |
 |
(14) |
The proofs of (11)–(14) follow from Pearl
(2001) and VanderWeele (2015).
Unfortunately, however, (11)–(14) depend not only on the joint
distribution of the observed variables  but also on the distribution
of the unobserved variable
but also on the distribution
of the unobserved variable  . In the following, we will give sharp bounds on the
true conditional direct and indirect effects in terms of the observed conditional natural
direct and indirect effects and two measures of the mediator-outcome confounding that can
be taken as sensitivity parameters.
. In the following, we will give sharp bounds on the
true conditional direct and indirect effects in terms of the observed conditional natural
direct and indirect effects and two measures of the mediator-outcome confounding that can
be taken as sensitivity parameters.
4.2. Sensitivity parameters and the bounding factor
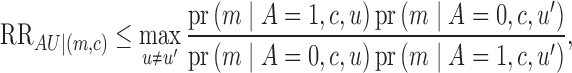
First, we introduce a conditional association measure between  and
and
 given
given  , and define our first
sensitivity parameter as
, and define our first
sensitivity parameter as
 |
where  is the maximum divided by the minimum of
the probabilities
is the maximum divided by the minimum of
the probabilities  over
over
 . When
  is binary,
  reduces to the usual conditional risk
ratio of
reduces to the usual conditional risk
ratio of  on
on  , and
, and  is the maximum of these conditional risk ratios over
 If
If  and
and  are conditionally
independent given
are conditionally
independent given  , then
Second, we introduce a conditional association measure between  and
and
 given
given  . As illustrated in Fig. 1, although
  , an
association between
, an
association between  and
and  conditional on
 arises from conditioning on the common descendant
 of
of  and
and  , also called the
collider bias. Our second sensitivity parameter will assess the magnitude of this
association generated by collider bias. We define our second sensitivity parameter as
, also called the
collider bias. Our second sensitivity parameter will assess the magnitude of this
association generated by collider bias. We define our second sensitivity parameter as
 |
(15) |
where  is the maximum of the risk ratio of
  on
on  taking value
 given
given  and
and  . When
 is binary,
 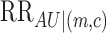 reduces to the
usual conditional risk ratio of
reduces to the
usual conditional risk ratio of  on
on  given
given
 and
and  . The second sensitivity parameter
can be viewed as the maximum of the collider bias ratios conditioning over the stratum
. The second sensitivity parameter
can be viewed as the maximum of the collider bias ratios conditioning over the stratum
 . We give an alternative form
 |
(16) |
which is the
maximum conditional relative risk of  on
on  within stratum
 divided by the unconditional relative risk of
 on
on  . The relative risk unconditional on
 is identifiable from the observed data, and therefore
the second sensitivity parameter depends crucially on the relative risk conditional on
is identifiable from the observed data, and therefore
the second sensitivity parameter depends crucially on the relative risk conditional on
 .
.
Nonparametrically, we can specify the second sensitivity parameter using expression
(15) or (16). If we would like to impose
parametric assumptions, for example that  follows a
log-linear model, then it reduces to a function of the regression coefficients, which will
depend explicitly on the
follows a
log-linear model, then it reduces to a function of the regression coefficients, which will
depend explicitly on the  -
- and
and  -
- associations, as shown in the Supplementary Material.
To aid interpretation, Lemma S4 in the Supplementary Material shows that
 |
which measures the
interaction of  and
and  on
on  taking value
 given
given  on the risk ratio scale (Piegorsch et al., 1994; Yang et al., 1999).
To further aid specification of this second parameter, we note that Greenland (2003) showed that, depending on the magnitude of the
association, in most but not all settings the magnitude of the ratio association measure
relating  and
and  introduced by conditioning on
 is smaller than the ratios relating
 and
and  and relating
 and
and  . Thus, the lower of these two ratios
can help to specify the second parameter. In particular, when the exposure is weakly
associated with the mediator, the collider bias is small. If
. Thus, the lower of these two ratios
can help to specify the second parameter. In particular, when the exposure is weakly
associated with the mediator, the collider bias is small. If  ,
then the collider bias is zero, i.e.,
,
then the collider bias is zero, i.e., 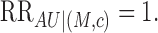
Finally, we introduce the bounding factor
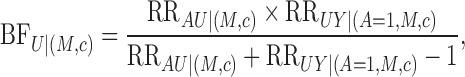 |
which is symmetric and monotone in both
 and
and  , and is no larger than either
sensitivity parameter. If one of the sensitivity parameters equals unity, then the
bounding factor also equals unity. The bounding factor, a measure of the strength of
unmeasured mediator-outcome confounding, plays a central role in bounding the natural
direct and indirect effects in the following theorems.
, and is no larger than either
sensitivity parameter. If one of the sensitivity parameters equals unity, then the
bounding factor also equals unity. The bounding factor, a measure of the strength of
unmeasured mediator-outcome confounding, plays a central role in bounding the natural
direct and indirect effects in the following theorems.
4.3. Bounding natural direct and indirect effects on the risk ratio scale
Theorem 1 —
Under the assumptions in (9) and (10), the true conditional natural direct effect on the risk ratio scale has the sharp bound
.
The sharp bound is attainable when  is binary,
  is degenerate, and some other conditions hold as
discussed in the Supplementary
Material. Theorem 1 provides an easy-to-use sensitivity analysis technique. After
specifying the strength of the unmeasured mediator-outcome confounder, we can calculate
the bounding factor and then divide the point and interval estimates of the conditional
natural direct effect by this bounding factor. This yields lower bounds on the conditional
natural direct effect estimates. We can analogously apply the theorems below.
is degenerate, and some other conditions hold as
discussed in the Supplementary
Material. Theorem 1 provides an easy-to-use sensitivity analysis technique. After
specifying the strength of the unmeasured mediator-outcome confounder, we can calculate
the bounding factor and then divide the point and interval estimates of the conditional
natural direct effect by this bounding factor. This yields lower bounds on the conditional
natural direct effect estimates. We can analogously apply the theorems below.
As shown in §2, the conditional total effect can be decomposed as the product of the conditional natural direct and indirect effects on the risk ratio scale, which, coupled with Theorem 1, implies the following bound on the conditional natural indirect effects.
Theorem 2 —
Under the assumptions in (9) and (10), the true conditional natural indirect effect on the risk ratio scale has the sharp bound
.
Even if a researcher does not feel comfortable specifying the sensitivity parameters, Theorems 1 and 2 can still be used to report how large the sensitivity parameters would have to be for an estimate or lower confidence limit to lie below its null hypothesis value. We illustrate this in §§4.5 and 5.
If the natural direct effect averaged over  is of interest, the true
unconditional natural direct effect must be at least as large as the minimum of
is of interest, the true
unconditional natural direct effect must be at least as large as the minimum of
 over
over
 . If we further assume a common conditional natural
direct effect among levels of
. If we further assume a common conditional natural
direct effect among levels of  , as in the log-linear or logistic
model for rare outcomes (cf. VanderWeele,
2015), then the true unconditional natural direct effect must be at least as
large as the maximum of
, as in the log-linear or logistic
model for rare outcomes (cf. VanderWeele,
2015), then the true unconditional natural direct effect must be at least as
large as the maximum of  over
over  . Similar arguments hold for the unconditional natural
indirect effect.
. Similar arguments hold for the unconditional natural
indirect effect.
4.4. Bounding natural direct and indirect effects on the risk difference scale
Theorem 3 —
Under the assumptions in (9) and (10), the true conditional natural direct effect on the risk difference scale has the sharp bound

Because the conditional total effect can be decomposed as the sum of the conditional natural direct and indirect effects on the risk difference scale as shown in §2, the identifiability of the conditional total effect and Theorem 3 imply the following bound on the conditional natural indirect effect.
Theorem 4 —
Under the assumptions in (9) and (10), the true conditional natural indirect effect on the risk difference scale has the sharp bound

Because of the linearity of the risk difference, the true unconditional direct and
indirect effects can be obtained by averaging the bounds in Theorems 3 and 4 over the
distribution of the observed covariates 
4.5. Cornfield-type inequalities for unmeasured mediator-outcome confounding
We can equivalently state Theorem 1 in terms of the smallest value of the bounding factor
to reduce an observed conditional natural direct effect to a true conditional causal
natural direct effect, i.e., 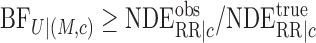 , which further implies the following
Cornfield-type inequalities (Cornfield et al.,
1959; Ding & VanderWeele, 2014).
, which further implies the following
Cornfield-type inequalities (Cornfield et al.,
1959; Ding & VanderWeele, 2014).
Theorem 5 —
Under the assumptions in (9) and (10), to reduce an observed conditional natural direct effect
to a true conditional natural direct effect
, both
and
must exceed
and the larger of them must exceed

To explain away an observed conditional natural direct effect  , i.e.,
  ,
both sensitivity parameters must exceed
,
both sensitivity parameters must exceed  ,
and the maximum of them must exceed
,
and the maximum of them must exceed  In Theorem S1 in the Supplementary Material, we present
the inequalities derived from Theorem 3 on the risk difference scale.
In Theorem S1 in the Supplementary Material, we present
the inequalities derived from Theorem 3 on the risk difference scale.
5. Illustration
VanderWeele et al. (2012) conducted mediation
analysis to assess the extent to which the effect that variants on chromosome 15q25.1 have
on lung cancer is mediated through smoking and the extent to which it operates through other
causal pathways. The exposure levels correspond to changes from zero to two C alleles;
smoking intensity is measured by the square root of number of cigarettes smoked per day; and
the outcome is the lung cancer indicator. The analysis of VanderWeele et al. (2012) was on the odds ratio scale using a lung
cancer case-control study, but for a rare disease the odds ratios approximate risk ratios.
After controlling for observed sociodemographic covariates, they found that the natural
direct effect estimate is  with 95% confidence interval
 , and the natural indirect effect estimate is
 with 95% confidence interval
  . Their analysis used logistic regression models,
requiring all the odds ratios to be the same across different levels of the measured
covariates.
. Their analysis used logistic regression models,
requiring all the odds ratios to be the same across different levels of the measured
covariates.
The evidence for the indirect effect is weak, because the confidence interval covers the
null hypothesis of no effect. However, the direct effect deviates significantly from the
null. According to §4.5, to reduce the point estimate
of the conditional natural direct effect to below unity, both  and
and  must exceed
  , and the maximum of them must
exceed
, and the maximum of them must
exceed  . For a binary
confounder
. For a binary
confounder  under parametric models with main effects, to explain
away the direct effect estimate it would generally have to (Greenland, 2003, cf. Supplementary Material) increase the likelihood of
under parametric models with main effects, to explain
away the direct effect estimate it would generally have to (Greenland, 2003, cf. Supplementary Material) increase the likelihood of
 and increase
  by at least
  -fold, and
it would have to increase at least one of
-fold, and
it would have to increase at least one of  and
and  by
by
 -fold. To reduce the lower confidence limit to below
unity, both sensitivity parameters must exceed
-fold. To reduce the lower confidence limit to below
unity, both sensitivity parameters must exceed  , and the maximum of them must
exceed
, and the maximum of them must
exceed  For a binary
confounder
For a binary
confounder  under parametric models with main effects, to explain
away the lower confidence limit for the direct effect it would generally have to increase
the likelihood of
under parametric models with main effects, to explain
away the lower confidence limit for the direct effect it would generally have to increase
the likelihood of  and increase
  by at least
 -fold, and it would have to increase at least one of
 and
and  by
by  -fold. This
would constitute fairly substantial confounding.
-fold. This
would constitute fairly substantial confounding.
Previous studies have found that the exposure-mediator association in this context is weak
(Saccone et al., 2010). Suppose that the risk
ratio relating  and
and  is less than
  . If we
assume that the collider bias is smaller than this in magnitude, e.g.,
. If we
assume that the collider bias is smaller than this in magnitude, e.g.,
 , as indicated by Greenland (2003), then
  must be at least
as large as
must be at least
as large as  to reduce the point estimate to below unity, and be at
least as large as
to reduce the point estimate to below unity, and be at
least as large as  to reduce the lower confidence limit to below unity. In
general, when
to reduce the lower confidence limit to below unity. In
general, when  is relatively small, we require an extremely
large
is relatively small, we require an extremely
large  to reduce the conditional natural direct
effect estimate to below unity. In fact, if
to reduce the conditional natural direct
effect estimate to below unity. In fact, if  is smaller than the
lower confidence limit of the conditional natural direct effect, it is impossible to reduce
it to below unity because the bounding factor is always smaller than
is smaller than the
lower confidence limit of the conditional natural direct effect, it is impossible to reduce
it to below unity because the bounding factor is always smaller than
 .
.
6. Discussion
Theorems 1–5 are most useful when the conditional natural direct effect is greater than unity. We can also simply relabel the exposure levels and all the results will still hold.
In §4 we derived sensitivity analysis formulae for causal parameters on the risk ratio and risk difference scales. If we have rare outcomes, as in most case-control studies, we can approximate causal parameters on the odds ratio scale by those on the risk ratio scale, and all the results about risk ratio also apply to the odds ratio. We have illustrated this in §5. Furthermore, we comment in the Supplementary Material that similar results hold for count and continuous positive outcomes and rare time-to-event outcomes, if we replace the relative risks on the outcome by the hazard ratios and mean ratios.
The assumption  may be violated if
  affects
 simultaneously, i.e., if unmeasured
exposure-mediator, exposure-outcome and mediator-outcome confounding all exist. Even if
simultaneously, i.e., if unmeasured
exposure-mediator, exposure-outcome and mediator-outcome confounding all exist. Even if
 is violated, we show in Theorem S2 in the Supplementary Material that Theorems 1
and 3 can be interpreted as the bounds of the conditional natural direct effects for the
unexposed population, which is also of interest in other contexts (Vansteelandt & VanderWeele, 2012; Lendle et al., 2013).
is violated, we show in Theorem S2 in the Supplementary Material that Theorems 1
and 3 can be interpreted as the bounds of the conditional natural direct effects for the
unexposed population, which is also of interest in other contexts (Vansteelandt & VanderWeele, 2012; Lendle et al., 2013).
Supplementary material
Supplementary material available at Biometrika online includes proofs of the theorems and more details about the discussions in §§3, 4.2, 4.5 and 6.
Supplementary Material
Acknowledgments
The authors thank the editor, associate editor and two referees for helpful comments. This research was funded by the U.S. National Institutes of Health.
References
- Baron R. M. & Kenny D. A. (1986). The moderator-mediator variable distinction in social psychological research: Conceptual, strategic, and statistical considerations. J. Pers. Soc. Psychol. 51, 1173–82. [DOI] [PubMed] [Google Scholar]
- Cornfield J., Haenszel W., Hammond E. C., Lilienfeld A. M., Shimkin M. B. & Wynder E. L. (1959). Smoking and lung cancer: Recent evidence and a discussion of some questions. J. Nat. Cancer Inst. 22, 173–203. [PubMed] [Google Scholar]
- Didelez V., Dawid A. P. & Geneletti S. (2006). Direct and indirect effects of sequential treatments. In Proc. 22nd Conf. Uncert. Artif. Intel., R. Dechter & T. S. Richardson, eds. Corvallis: Association for Uncertainty in Artificial Intelligence Press, pp. 138–46.
- Ding P. & VanderWeele T. J. (2014). Generalized Cornfield conditions for the risk difference. Biometrika 101, 971–7. [Google Scholar]
- Geneletti S. (2007). Identifying direct and indirect effects in a non-counterfactual framework. J. R. Statist. Soc. B 69, 199–215. [Google Scholar]
- Greenland S. (2003). Quantifying biases in causal models: Classical confounding vs collider-stratification bias. Epidemiology 14, 300–6. [PubMed] [Google Scholar]
- Imai K., Keele L. & Yamamoto T. (2010). Identification, inference and sensitivity analysis for causal mediation effects. Statist. Sci. 25, 51–71. [Google Scholar]
- Lendle S. D., Subbaraman M. S. & van der Laan M. J. (2013). Identification and efficient estimation of the natural direct effect among the untreated. Biometrics 69, 310–7. [DOI] [PMC free article] [PubMed] [Google Scholar]
- Neyman J. (1923). On the application of probability theory to agricultural experiments. Essay on principles. Section 9. Statist. Sci. 5, 465–72. [Google Scholar]
- Pearl J. (2001). Direct and indirect effects. In Proc. 17th Conf. Uncert. Artif. Intel., J. S. Breese & D. Koller, eds. San Francisco: Morgan Kaufmann, pp. 411–20.
- Pearl J. (2009). Causality: Models, Reasoning and Inference. Cambridge: Cambridge University Press. [Google Scholar]
- Piegorsch W. W., Weinberg C. R. & Taylor J. A. (1994). Non-hierarchical logistic models and case-only designs for assessing susceptibility in population-based case-control studies. Statist. Med. 13, 153–62. [DOI] [PubMed] [Google Scholar]
- Robins J. M. & Greenland S. (1992). Identifiability and exchangeability for direct and indirect effects. Epidemiology 3, 143–55. [DOI] [PubMed] [Google Scholar]
- Robins J. M. & Richardson T. S. (2010). Alternative graphical causal models and the identification of direct effects. In Causality and Psychopathology: Finding the Determinants of Disorders and Their Cures, P. Shrout, ed. Oxford: Oxford University Press, pp. 103–58.
- Rubin D. B. (1974). Estimating causal effects of treatments in randomized and nonrandomized studies. J. Educ. Psychol. 66, 688–701. [Google Scholar]
- Saccone N. L., Culverhouse R. C., Schwantes-An T.-H., Cannon D. S., Chen X., Cichon S., Giegling I., Han S., Han Y., Keskitalo-Vuokko K.. et al. (2010). Multiple independent loci at chromosome 15q25.1 affect smoking quantity: A meta-analysis and comparison with lung cancer and COPD. PLoS Genetics 6, e1001053. [DOI] [PMC free article] [PubMed] [Google Scholar]
- Sjölander A. (2009). Bounds on natural direct effects in the presence of confounded intermediate variables. Statist. Med. 28, 558–71. [DOI] [PubMed] [Google Scholar]
- Tchetgen Tchetgen E. J. & Shpitser I. (2012). Semiparametric theory for causal mediation analysis: Efficiency bounds, multiple robustness and sensitivity analysis. Ann. Statist. 40, 1816–45. [DOI] [PMC free article] [PubMed] [Google Scholar]
- VanderWeele T. J. (2010). Bias formulas for sensitivity analysis for direct and indirect effects. Epidemiology 21, 540–51. [DOI] [PMC free article] [PubMed] [Google Scholar]
- VanderWeele T. J. (2015). Explanation in Causal Inference: Methods for Mediation and Interaction. Oxford: Oxford University Press. [Google Scholar]
- VanderWeele T. J., Asomaning K., Tchetgen Tchetgen E. J., Han Y., Spitz M. R., Shete S., Wu X., Gaborieau V., Wang Y., McLaughlin J.. et al. (2012). Genetic variants on 15q25.1, smoking, and lung cancer: An assessment of mediation and interaction. Am. J. Epidemiol. 175, 1013–20. [DOI] [PMC free article] [PubMed] [Google Scholar]
- Vansteelandt S. & VanderWeele T. J. (2012). Natural direct and indirect effects on the exposed: Effect decomposition under weaker assumptions. Biometrics 68, 1019–27. [DOI] [PMC free article] [PubMed] [Google Scholar]
- Wright S. (1934). The method of path coefficients. Ann. Math. Statist. 5, 161–215. [Google Scholar]
- Yang Q., Khoury M. J., Sun F. & Flanders W. D. (1999). Case-only design to measure gene-gene interaction. Epidemiology 10, 167–70. [PubMed] [Google Scholar]
Associated Data
This section collects any data citations, data availability statements, or supplementary materials included in this article.