

Abstract
Objectives
Data are presented from the Survey of Antibiotic Resistance (SOAR) for respiratory tract infection pathogens collected in 2011–13 from Turkey.
Methods
MICs were determined using Etest®. Susceptibility was assessed using CLSI, EUCAST and pharmacokinetic/pharmacodynamic (PK/PD) interpretive criteria.
Results
Rates of antibiotic susceptibility were very low among 333 isolates of Streptococcus pneumoniae tested: penicillin 38% using CLSI (oral) and EUCAST breakpoints; erythromycin 51% using CLSI and EUCAST criteria; and cefuroxime 64.6% using CLSI and PK/PD and 46.9% using EUCAST. Of the isolates, >90% were susceptible to amoxicillin/clavulanic acid, ceftriaxone (except using EUCAST criteria: 76%), levofloxacin and high-dose intravenous penicillin. Among 339 Haemophilus influenzae isolates, 6.8% were β-lactamase positive while 9.1% were β-lactamase negative but ampicillin resistant (BLNAR) by CLSI (14.7% by EUCAST) criteria. Amoxicillin/clavulanic acid susceptibility was ∼90% by CLSI (with or without BLNAR adjustment, EUCAST and high-dose PK/PD) but lower, at 82.9%, by EUCAST with BLNAR adjustment. Levofloxacin susceptibility was 96% using all three breakpoints. Dramatic differences in rates of susceptibility, depending on the breakpoints used, were seen for cefaclor [94% by CLSI (86.4% BLNAR adjusted), 23% by PK/PD] and cefuroxime [97% by CLSI (89.1% BLNAR adjusted), 85% by PK/PD, 15% by EUCAST (13.0% BLNAR adjusted)]. Streptococcus pyogenes (n = 222) and Moraxella catarrhalis (n = 40) isolates remained highly susceptible to amoxicillin/clavulanic acid, cephalosporins and levofloxacin, with only erythromycin susceptibility dropping below 95% for S. pyogenes.
Conclusions
Overall, amoxicillin/clavulanic acid and levofloxacin were the most active antibiotics based on all three breakpoints against these pathogens. Although susceptibility was not universally low in Turkey, high resistance rates were found in S. pneumoniae and, when using PK/PD and EUCAST breakpoints, in other respiratory pathogens.
Introduction
Community-acquired pneumonia (CAP) remains a significant health problem, posing a high clinical and economic burden. Of deaths in children under 5 years old, 15% globally are caused by acute respiratory infections.1 The incidence of CAP has been rising in Europe and is expected to increase further due to the ageing of the population.2 Although some have seen no correlation between mortality due to CAP and antimicrobial resistance,3 others found that penicillin resistance was related to increased mortality in hospitalized patients with pneumococcal pneumonia4 and that macrolide resistance in respiratory pathogens was related to treatment failures in children.5 Antimicrobial use has been identified as the main driver of development of resistance.6–8 In a recent study, Turkey has been identified as the country with the highest antibiotic use out of 42 countries in the broader European region.9 Monitoring of resistance in Turkey is crucial in order to identify the impact of this high use on antimicrobial resistance, to support infection control efforts, and to aid in the selection of appropriate antimicrobial agents for the treatment of patients. Knowledge of resistance patterns is especially important for CAP, since it is usually treated empirically without identification of the causative agent or its antibiogram.
The Survey of Antibiotic Resistance (SOAR) is an ongoing surveillance study of key respiratory pathogens. SOAR has been monitoring antimicrobial resistance in the Middle East, Africa, Latin America, Asia-Pacific and the Commonwealth of Independent States countries since 2002. For this report, recent SOAR data from hospital sites in Turkey are analysed to provide a picture of the current antimicrobial susceptibility situation. These results could prove very useful as baseline and benchmark measures in the efforts by the Turkish government to reduce use of antimicrobials and consequently decrease resistance.
Materials and methods
Collaborating centres
Isolates were collected from outpatients who attended five main centres, which collected the majority of the isolates (Ege University, Izmir; Hacettepe University, Ankara; Istanbul University, Istanbul; Marmara University, Istanbul; and Ondokuz Mayıs University, Samsun) and four satellite centres, which sent some isolates to the main centres (Erciyes University, Kayseri; Istanbul GATA, Istanbul; Selçuk University, Konya; and Akdeniz University, Antalya).
Clinical isolates
A total of 934 clinical respiratory isolates (192 from Izmir; 231 from Ankara; 426 from Istanbul; 85 from Samsun), comprising 333 isolates of S. pneumoniae, 222 isolates of S. pyogenes, 339 isolates of H. influenzae and 40 isolates of M. catarrhalis were analysed. Of the 934 isolates, the majority (909, 97.3%) were collected from 2011 to 2013. Sixteen S. pneumoniae isolates were collected in 2010. One S. pneumoniae isolate, seven H. influenzae isolates and one M. catarrhalis isolate were collected in 2014. Paediatric patients (≤12 years old) accounted for 332 (35.6%) isolates, adult patients (13–64 years old) for 440 (47.1%) isolates and the elderly (≥65 years) for 162 (17.3%) isolates. Isolates originated from a variety of infection sources, including blood, bronchial aspirate, bronchoalveolar lavage, middle ear effusion, pleural aspirate, sputum, throat swab (S. pyogenes only) and tracheal aspirate. Organisms were identified using conventional methods (optochin susceptibility/bile solubility for S. pneumoniae, X/V factor requirement for H. influenzae, bacitracin susceptibility for S. pyogenes and tributyrin test for M. catarrhalis) or by automated systems. Duplicate isolates from the same patient were not included.
Susceptibility testing
MICs were determined in selected local laboratories using an antibiotic gradient test (Etest®) susceptibility method according to the manufacturer's instructions (bioMérieux, Marcy l'Etoile, France). Disc diffusion susceptibility testing was carried out according to CLSI methodology.10 Susceptibility of S. pneumoniae and S. pyogenes to penicillin, amoxicillin/clavulanic acid, cefaclor, cefpodoxime, ceftriaxone, cefuroxime, clindamycin and levofloxacin was evaluated by Etest®. Susceptibility of H. influenzae to amoxicillin/clavulanic acid, ampicillin, azithromycin, cefaclor, cefpodoxime, ceftriaxone, cefuroxime and levofloxacin was evaluated by Etest®. Susceptibility of M. catarrhalis to amoxicillin/clavulanic acid, azithromycin, cefaclor, cefuroxime and levofloxacin was evaluated by Etest®. Erythromycin was evaluated by disc diffusion. CLSI breakpoints were applied11 except for macrolides and clindamycin, where bioMérieux Etest® breakpoints for incubation in CO2 were used, and breakpoints issued in 2012 were used for M. catarrhalis.12 In addition, susceptibility based on EUCAST and pharmacokinetic/pharmacodynamic (PK/PD) breakpoints were analysed where applicable to assess whether adoption of these breakpoints would affect susceptibility.13,14 EUCAST and PK/PD breakpoints were not evaluated for macrolides or clindamycin because, unlike CLSI, these are not adjusted for incubation in CO2 by bioMérieux. Breakpoints are shown in Table 1.
Table 1.
MIC breakpoints (mg/L) used for S. pneumoniae, S. pyogenes, H. influenzae and M. catarrhalis isolates
| Breakpoints (S/I/R) |
|||||||||
|---|---|---|---|---|---|---|---|---|---|
|
S. pneumoniae |
S. pyogenes |
H. influenzae |
M. catarrhalis |
All species |
|||||
| Antimicrobial | CLSI | EUCAST | CLSI | EUCAST | CLSI | EUCAST | CLSI | EUCAST | PK/PD (S only) |
| AMCa | ≤2/4/≥8 | NA | NA | NA | ≤4/–/≥8 | ≤2/–/≥4 | ≤4/–/≥8 | ≤1/–/≥2 | ≤2 (≤4) |
| Ampicillin | NT | NT | NT | NT | ≤1/2/≥4 | ≤1/–/≥2 | NT | NT | NA |
| Azithromycinb | NT | NT | NT | NT | ≤8/–/–b | NA | NA | NA | NA |
| Cefaclor | ≤1/2/≥4 | ≤0.03/0.06–0.5/≥1 | NA | NA | ≤8/16/≥32 | NA | ≤8/16/≥32 | NA | ≤0.5 |
| Cefpodoxime | ≤0.5/1/≥2 | ≤0.25/0.5/≥1 | NA | NA | ≤2/–/– | ≤0.25/0.5/≥0.1 | NA | NA | ≤0.5 |
| Ceftriaxone | ≤1/2/≥4 | ≤0.5/1–2/≥4 | ≤0.5/–/– | NA | ≤2/–/– | ≤0.12/–/≥0.25 | NT | NT | ≤1 |
| Cefuroximec | ≤1/2/≥4 | ≤0.25/0.5/≥1 | NA | NA | ≤4/8/≥16 | ≤0.12/0.25–1/≥2 | ≤4/8/≥16 | ≤0.12/0.25–4/≥8 | ≤1 |
| Clindamycinb | ≤0.5/1/≥2 | NA | ≤0.5/1/≥2 | NA | NA | NA | NT | NT | NA |
| Levofloxacin | ≤2/4/≥8 | ≤2/–/≥4 | ≤2/4/≥8 | ≤1/2/≥4 | ≤2/–/– | ≤1/–/≥2 | ≤2/–/– | ≤1/–/≥2 | ≤2 |
| Penicillin (oral) | ≤0.06/0.12–1/≥2 | ≤0.06/0.12–2/≥4 | ≤0.12/–/– | ≤0.25/–/≥0.5 | NA | NA | NA | NA | NA |
| Penicillin (iv)d | ≤2/4/≥8 | see notee | NA | NA | NA | NA | NA | NA | NA |
AMC, amoxicillin/clavulanic acid; PK/PD, pharmacokinetic/pharmacodynamic; S, susceptible; I, intermediate; R, resistant; NA, not applicable; NT, not tested.
aThis agent was tested at a 2 : 1 amoxicillin to clavulanic acid ratio; breakpoints are expressed as the amoxicillin component. PK/PD breakpoint based on high dose (4 g of amoxicillin with 250 mg of clavulanic acid per day for adults) is shown in parentheses.
bbioMérieux Etest® breakpoints for incubation in CO2 (only available for H. influenzae).
cBreakpoints used are for cefuroxime axetil.
dParenteral non-meningitis breakpoints. EUCAST do not give iv breakpoints.
eEUCAST give iv susceptible breakpoints for pneumonia based on three dosage regimens: 1.2 g × 4 (MIC ≤0.5 = susceptible), 1.2 g × 6 or 2.4 g × 4 (MIC ≤1 mg/L = susceptible) and 2.4 g × 6 (MIC ≤2 mg/L = susceptible).
The presence of β-lactamase was tested for all isolates of H. influenzae and M. catarrhalis by a chromogenic cephalosporin (nitrocefin) disc method.
Quality control and data analysis
Quality control strains Staphylococcus aureus ATCC 29213, S. pneumoniae ATCC 49619, H. influenzae ATCC 49247, H. influenzae ATCC 49766, Escherichia coli ATCC 25922 and E. coli ATCC 32518 were included on each day of testing. Results of susceptibility testing were accepted if the results of the control strains were within published limits. Differences in susceptibility between age groups were assessed for statistical significance with Fisher's exact test using XLSTAT version 2011.1.05. A P value <0.05 was considered statistically significant.
Results
S. pneumoniae
Of the 333 S. pneumoniae isolates collected in Turkey, 203 isolates were from sputum (61.0%), 88 from tracheal aspirate, bronchoalveolar lavage, or bronchial aspirate (26.4%), 38 from blood (11.4%), 3 from pleural aspirate (0.9%) and 1 from middle ear effusion (0.3%). Paediatric patients contributed 98 (29.4%) of the isolates, adults 172 (51.7%) and the elderly 63 (18.9%) of the isolates.
Summary MIC and susceptibility data for S. pneumoniae are shown in Table 2. MIC distribution data are given in Table 3 and Figure 1. By CLSI penicillin intravenous (iv) (non-meningitis) breakpoints, 97.3% (324/333) of S. pneumoniae were penicillin susceptible, 2.1% (7/333) were penicillin intermediate and 0.6% (2/333) were penicillin resistant. However, the proportion of penicillin-susceptible isolates was only 38.1% (127/333) based on CLSI penicillin oral and EUCAST oral breakpoints. By EUCAST dose-dependent breakpoints penicillin susceptibility ranged from 59.7% (low dose) to 97.3% (high dose). The proportion of penicillin-intermediate isolates was 48.3% (161/333) by CLSI penicillin oral breakpoints and 59.2% (197/333) by EUCAST breakpoints, while penicillin-resistant isolates accounted for 13.5% (45/333) and 2.7% (9/333) by these respective breakpoints (Table 2).
Table 2.
MIC and susceptibility results for S. pneumoniae isolates
| Susceptibility (%) |
||||||||||||
|---|---|---|---|---|---|---|---|---|---|---|---|---|
| MIC (mg/L) |
CLSI |
PK/PD |
EUCAST |
|||||||||
| Antimicrobial | n | 50% | 90% | min | max | %S | %I | %R | %S | %S | %I | %R |
| AMCa | 333 | 0.25 | 2 | ≤0.015 | 8 | 91.3 | 7.8 | 0.9 | 91.3 (99.1) | NA | NA | NA |
| Cefaclor | 333 | 1 | 32 | 0.03 | >256 | 54.4 | 5.1 | 40.5 | 39.0 | 0.3 | 38.7 | 61 |
| Cefpodoxime | 333 | 0.5 | 4 | ≤0.015 | 32 | 58.3 | 6.9 | 34.8 | 58.3 | 45.7 | 12.6 | 41.7 |
| Ceftriaxone | 333 | 0.25 | 1 | 0.004 | 8 | 97.3 | 1.8 | 0.9 | 97.3 | 76.0 | 23.1 | 0.9 |
| Cefuroxime | 333 | 0.5 | 4 | ≤0.015 | 16 | 64.6 | 25.2 | 10.2 | 64.6 | 46.9 | 3.3 | 49.9 |
| Clindamycin | 333 | 0.12 | >256 | ≤0.015 | >256 | 64.9 | 0.3 | 34.8 | NA | NA | NA | NA |
| Levofloxacin | 333 | 1 | 2 | 0.25 | >32 | 98.2 | 0.6 | 1.2 | 98.2 | 98.2 | — | 1.8 |
| Penicillin (oral) | 333 | 0.25 | 2 | 0.008 | 8 | 38.1 | 48.3 | 13.5 | NA | 38.1 | 59.2 | 2.7 |
| Penicillin (iv) | 333 | 0.25 | 2 | 0.008 | 8 | 97.3 | 2.1 | 0.6 | NA | 59.7–97.3 | NA | NA |
| Erythromycinb | 321c | NT | NT | NT | NT | 51.1 | 3.1 | 45.8 | NA | 50.8 | 1.9 | 47.3 |
AMC, amoxicillin/clavulanic acid; 50%, concentration required to inhibit 50% of isolates; 90%, concentration required to inhibit 90% of isolates; min, minimum MIC observed; max, maximum MIC observed; S, susceptible; I, intermediate; R, resistant; NA, not applicable; NA, no breakpoint data available (NA for clindamycin by EUCAST because Etest® breakpoints in CO2 not available); NT, not tested for MIC.
aPK/PD susceptibility at high dose is shown in parentheses.
bUsing S/I/R zone diameters (mm) of CLSI (≤15/16–20/≥21) and EUCAST (≤18/19–21/≥22).
cErythromycin was not tested against 12 of the isolates.
Table 3.
Distribution of S. pneumoniae MICs
| Number of isolates at MIC (mg/L) |
|||||||||||||||||||||
|---|---|---|---|---|---|---|---|---|---|---|---|---|---|---|---|---|---|---|---|---|---|
| Drug | n | 0.004 | 0.008 | ≤0.015 | 0.015 | 0.03 | 0.06 | 0.12 | 0.25 | 0.5 | 1 | 2 | 4 | 8 | 16 | 32 | >32 | 64 | 128 | 256 | >256 |
| AMC | 333 | 0 | 0 | 80 | 0 | 44 | 22 | 12 | 12 | 27 | 57 | 50 | 26 | 3 | 0 | 0 | 0 | 0 | 0 | 0 | 0 |
| Cefaclor | 333 | 0 | 0 | 0 | 0 | 1 | 3 | 36 | 68 | 22 | 51 | 17 | 14 | 14 | 44 | 40 | 0 | 14 | 4 | 0 | 5 |
| Cefpodoxime | 333 | 0 | 0 | 35 | 0 | 71 | 9 | 22 | 15 | 42 | 23 | 79 | 34 | 1 | 1 | 1 | 0 | 0 | 0 | 0 | 0 |
| Ceftriaxone | 333 | 6 | 39 | 0 | 58 | 21 | 12 | 20 | 20 | 77 | 71 | 6 | 2 | 1 | 0 | 0 | 0 | 0 | 0 | 0 | 0 |
| Cefuroxime | 333 | 0 | 0 | 96 | 0 | 7 | 11 | 21 | 21 | 11 | 48 | 84 | 31 | 1 | 2 | 0 | 0 | 0 | 0 | 0 | 0 |
| Clindamycin | 333 | 0 | 0 | 2 | 0 | 22 | 90 | 61 | 37 | 4 | 1 | 1 | 0 | 0 | 0 | 1 | 0 | 2 | 0 | 5 | 107 |
| Levofloxacin | 333 | 0 | 0 | 0 | 0 | 0 | 0 | 0 | 5 | 97 | 170 | 55 | 2 | 0 | 1 | 0 | 3 | 0 | 0 | 0 | 0 |
| Penicillin | 333 | 0 | 2 | 0 | 31 | 83 | 11 | 16 | 24 | 32 | 89 | 36 | 7 | 2 | 0 | 0 | 0 | 0 | 0 | 0 | 0 |
AMC, amoxicillin/clavulanic acid.
Figure 1.
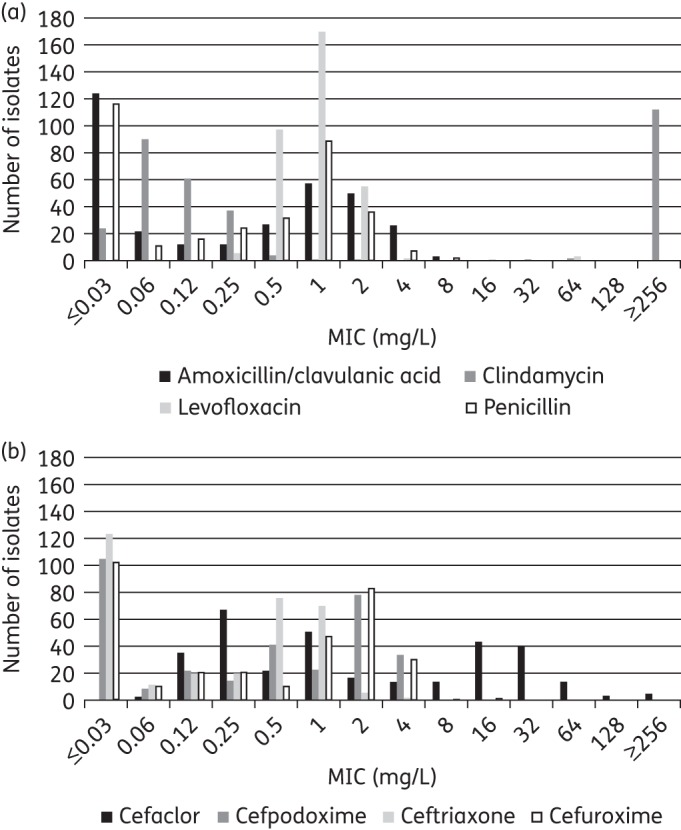
MIC distribution for (a) amoxicillin/clavulanic acid, clindamycin, levofloxacin and penicillin and (b) cefaclor, cefpodoxime, ceftriaxone and cefuroxime against all S. pneumoniae.
The most active agent by all three breakpoints was levofloxacin, with 98.2% of isolates susceptible (327/333), while 91.3% were susceptible to amoxicillin/clavulanic acid (and by inference amoxicillin) by CLSI and the low-dose PK/PD breakpoints, although this increased to 99.1% using the high-dose PK/PD breakpoint. Ceftriaxone was the most active cephalosporin, with 97.3% of isolates susceptible by CLSI and PK/PD breakpoints and 76.0% by EUCAST. The other tested cephalosporins showed lower susceptibility by at least 30 percentage points, especially cefaclor, at 54.4% susceptible by CLSI breakpoints, 39.0% susceptible by PK/PD and 0.3% susceptible by EUCAST breakpoints. CLSI guidelines indicate that isolates susceptible to penicillin G (MIC ≤0.06 mg/L) can be reported as susceptible to amoxicillin, amoxicillin/clavulanate, ceftriaxone, cefpodoxime, ceftriaxone and cefuroxime. Data from this study confirmed this, as all penicillin-susceptible S. pneumoniae were also susceptible to the β-lactams listed above, except for three isolates that were penicillin susceptible but cefaclor intermediate (data not shown). However, the reverse was not found. Of the 206 penicillin non-susceptible isolates, 197 were ceftriaxone susceptible (95.6%), 177 were amoxicillin/clavulanic acid susceptible (85.9%), 88 were cefuroxime susceptible (42.7%), 67 were cefpodoxime susceptible (32.5%) and 57 were cefaclor susceptible (27.7%). A similar ‘expert rule’ is provided by EUCAST but for penicillins only, i.e. amoxicillin/clavulanic acid (amoxicillin) in this study. However, unlike CLSI, individual breakpoints are not provided by EUCAST for amoxicillin/clavulanic acid to make this comparison.
Only around half the isolates were susceptible to erythromycin (51.1% by CLSI and 50.8% by EUCAST criteria, Table 2).
Prevalence of antibiotic susceptibility among penicillin-susceptible, -intermediate and -resistant S. pneumoniae isolates based on CLSI penicillin oral breakpoints
Amoxicillin/clavulanic acid and all tested cephalosporins except cefaclor were also fully active against 127 penicillin-susceptible S. pneumoniae (PSSP) isolates (Figure 2); susceptibility to cefaclor and clindamycin was seen in 97.6% of isolates, while erythromycin showed 92.6% susceptibility. Among 161 penicillin-intermediate S. pneumoniae (PISP) isolates ≥90% susceptibility was only seen with amoxicillin/clavulanic acid (95%), ceftriaxone (99.4%) and levofloxacin (96.9%). All other antimicrobials showed susceptibility rates of <50%. Amoxicillin/clavulanic acid, ceftriaxone and levofloxacin were active against 53.3%, 82.2% and 97.8% of penicillin-resistant S. pneumoniae (PRSP) isolates (n = 45), respectively. All other antimicrobials showed susceptibility <30% for PRSP.
Figure 2.
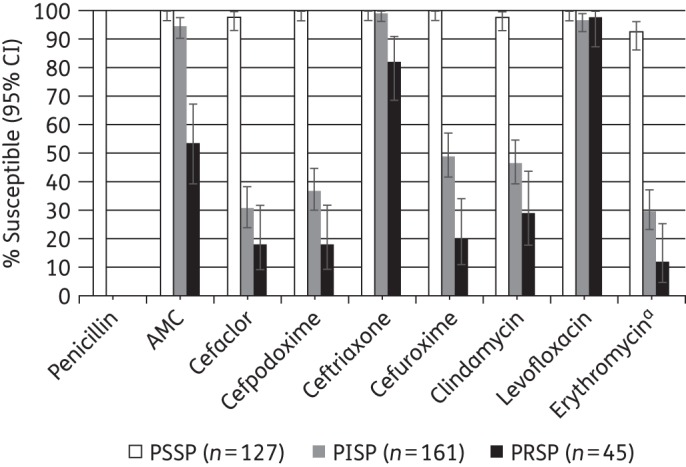
Percentage susceptible rates (with 95% CI) for antimicrobials according to CLSI breakpoints against PSSP, PISP and PRSP isolates. Penicillin susceptibility category is based on oral penicillin CLSI breakpoints. aSample sizes for erythromycin: PSSP, n = 122; PISP, n = 156; PRSP, n = 43. AMC, amoxicillin/clavulanic acid.
Prevalence of antibiotic susceptibility among PSSP, PISP and PRSP isolates based on EUCAST penicillin breakpoints
The 127 PSSP isolates were also fully susceptible to ceftriaxone and levofloxacin, 96.1% susceptible to cefpodoxime, 97.6% susceptible to cefuroxime and clindamycin and 92.6% susceptible to erythromycin by EUCAST breakpoints (Figure 3). Cefaclor susceptibility was only 0.8%. For 197 PISP isolates, levofloxacin was the only antimicrobial with a susceptibility rate >90%; 63.5% were susceptible to ceftriaxone while all other agents tested were active against <45% of isolates. Only nine isolates were PRSP by the EUCAST breakpoint. Susceptibility of these isolates was very low to all agents except levofloxacin (88.9% susceptible), but, as expected, confidence intervals were very wide (Figure 3).
Figure 3.
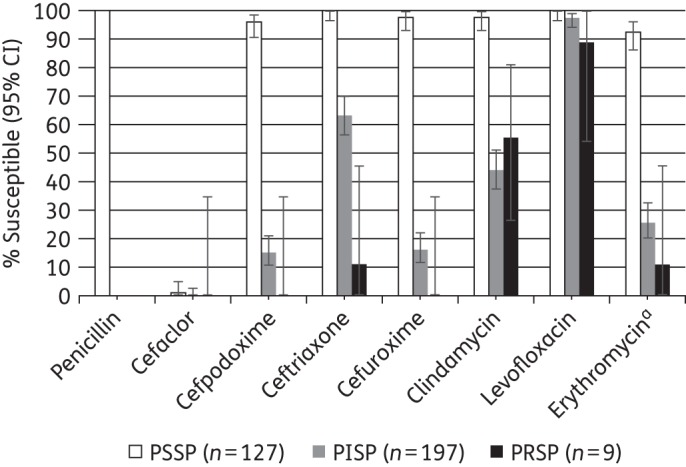
Percentage susceptible rates (with 95% CI) for antimicrobials according to EUCAST breakpoints against PSSP, PISP and PRSP isolates. Penicillin susceptibility category based on EUCAST breakpoints. aSample sizes for erythromycin: PSSP, n = 122; PISP, n = 190; PRSP, n = 9.
S. pyogenes
All 222 S. pyogenes isolates were from throat swabs. The majority of isolates were from paediatric patients (n = 154, 69.3%), while adult patients contributed 59 isolates (26.6%) and elderly patients the remaining 9 isolates (4.1%).
Summary MIC and susceptibility data for S. pyogenes are shown in Table 4. MIC distribution data are given in Table 5. S. pyogenes was 100% susceptible by CLSI and EUCAST breakpoints to penicillin, with inferred susceptibility to amoxicillin/clavulanic acid (amoxicillin) and the cephalosporins. Clindamycin susceptibility was 98.7% by bioMérieux Etest® breakpoints, levofloxacin susceptibility was 98.2% by CLSI and PK/PD breakpoints and 92.3% by EUCAST, while erythromycin susceptibility was 94.1% by CLSI and EUCAST criteria (Table 4).
Table 4.
MIC and susceptibility results for S. pyogenes isolates
| Susceptibility |
||||||||||||
|---|---|---|---|---|---|---|---|---|---|---|---|---|
| MIC (mg/L) |
CLSIa |
PK/PD |
EUCASTa |
|||||||||
| Antimicrobial | n | 50% | 90% | min | max | %S | %I | %R | %S | %S | %I | %R |
| AMCb | 222 | ≤0.015 | 0.03 | ≤0.015 | 0.06 | 100 | — | — | 100 (100) | 100 | — | — |
| Cefaclor | 222 | 0.06 | 0.12 | ≤0.015 | 0.25 | 100 | — | — | 100 | 100 | — | — |
| Cefpodoxime | 222 | ≤0.015 | 0.03 | ≤0.015 | 0.5 | 100 | — | — | 100 | 100 | — | — |
| Ceftriaxone | 222 | 0.015 | 0.03 | ≤0.002 | 0.12 | 100 | — | — | 100 | 100 | — | — |
| Cefuroxime | 222 | ≤0.015 | ≤0.015 | ≤0.015 | 0.12 | 100 | — | — | 100 | 100 | — | — |
| Clindamycin | 222 | 0.06 | 0.12 | ≤0.015 | >256 | 98.7 | 0.4 | 0.9 | NA | NA | NA | NA |
| Levofloxacin | 222 | 0.5 | 1 | 0.03 | 4 | 98.2 | 1.8 | 0 | 98.2 | 92.3 | 5.9 | 1.8 |
| Penicillin | 222 | 0.015 | 0.03 | 0.002 | 0.12 | 100 | — | — | NA | 100 | — | 0 |
| Erythromycinc | 222 | NT | NT | NT | NT | 94.1 | 3.6 | 2.3 | NA | 94.1 | 3.2 | 2.7 |
AMC, amoxicillin/clavulanic acid; 50%, concentration required to inhibit 50% of isolates; 90%, concentration required to inhibit 90% of isolates; min, minimum MIC observed; max, maximum MIC observed; S, susceptible; I, intermediate; R, resistant; NA, not applicable; NA, no breakpoint data available (NA for clindamycin by PK/PD and EUCAST because Etest® breakpoints in CO2 not available); NT, not tested for MIC.
aPenicillin G results were used to infer susceptibility to other penicillins and cephalosporins according to CLSI and EUCAST guidelines.
bPK/PD susceptibility at high dose is shown in parentheses.
cUsing the S/I/R interpretive criteria for zone diameters (mm) of CLSI (≤15/16–20/≥21) and EUCAST (≤17/18–20/≥21).
Table 5.
Distribution of S. pyogenes MICs
| Number of isolates at MIC (mg/L) |
|||||||||||||||||||||
|---|---|---|---|---|---|---|---|---|---|---|---|---|---|---|---|---|---|---|---|---|---|
| Drug | n | ≤0.002 | 0.004 | 0.008 | ≤0.015 | 0.015 | 0.03 | 0.06 | 0.12 | 0.25 | 0.5 | 1 | 2 | 4 | 8 | 16 | 32 | 64 | 128 | 256 | >256 |
| AMC | 222 | 0 | 0 | 0 | 115 | 0 | 98 | 9 | 0 | 0 | 0 | 0 | 0 | 0 | 0 | 0 | 0 | 0 | 0 | 0 | 0 |
| Cefaclor | 222 | 0 | 0 | 0 | 26 | 0 | 59 | 85 | 51 | 1 | 0 | 0 | 0 | 0 | 0 | 0 | 0 | 0 | 0 | 0 | 0 |
| Cefpodoxime | 222 | 0 | 0 | 0 | 184 | 0 | 33 | 2 | 1 | 1 | 1 | 0 | 0 | 0 | 0 | 0 | 0 | 0 | 0 | 0 | 0 |
| Ceftriaxone | 222 | 3 | 8 | 49 | 0 | 97 | 53 | 9 | 3 | 0 | 0 | 0 | 0 | 0 | 0 | 0 | 0 | 0 | 0 | 0 | 0 |
| Cefuroxime | 222 | 0 | 0 | 0 | 216 | 0 | 4 | 1 | 1 | 0 | 0 | 0 | 0 | 0 | 0 | 0 | 0 | 0 | 0 | 0 | 0 |
| Clindamycin | 222 | 0 | 0 | 0 | 11 | 0 | 43 | 62 | 84 | 15 | 4 | 1 | 0 | 1 | 0 | 0 | 0 | 0 | 0 | 0 | 1 |
| Levofloxacin | 222 | 0 | 0 | 0 | 0 | 0 | 1 | 2 | 0 | 38 | 98 | 66 | 13 | 4 | 0 | 0 | 0 | 0 | 0 | 0 | 0 |
| Penicillin | 222 | 1 | 3 | 12 | 0 | 97 | 95 | 7 | 7 | 0 | 0 | 0 | 0 | 0 | 0 | 0 | 0 | 0 | 0 | 0 | 0 |
AMC, amoxicillin/clavulanic acid.
H. influenzae
Most H. influenzae isolates were from sputum (243/339, 71.7%), 43 isolates were from tracheal aspirate (12.7%), 43 from bronchoalveolar lavage (12.7%), 7 from bronchial aspirate (2.1%) and 3 from blood (0.9%). Paediatric patients contributed 76 isolates (22.4%), while adult patients accounted for 192 isolates (56.6%) and elderly patients for 71 isolates (20.9%).
Overall, 6.8% (23/339) of isolates were β-lactamase positive and 93.2% were β-lactamase negative. Of these 316 β-lactamase-negative isolates, 31 (9.1% of all H. influenzae) were β-lactamase negative, ampicillin resistant (BLNAR, ampicillin MIC ≥4 mg/L) according to the CLSI definition and 50 (14.7%) were BLNAR according to the EUCAST definition (ampicillin MIC ≥2 mg/L). For analysis, the BLNAR strains were included with the other β-lactamase-negative isolates.
Summary MIC and susceptibility data for H. influenzae are shown in Table 6. MIC distribution data are given in Table 7 and Figure 4. Amoxicillin/clavulanic acid susceptibility in vitro was 91.7% for H. influenzae by CLSI and high-dose PK/PD breakpoints, and was slightly reduced to 87.9% using low-dose PK/PD and EUCAST criteria. When adjusted for the presence of BLNAR strains, clinical susceptibility by CLSI remained at 90% but susceptibility by EUCAST criteria was reduced to 82.9% due to the stricter BLNAR definition. Susceptibility was very similar for the β-lactamase-negative subset. The 23 β-lactamase-positive isolates showed high susceptibility to amoxicillin/clavulanic acid by CLSI and high-dose PK/PD criteria (95.7%), but susceptibility was reduced to 78.3% using low-dose PK/PD and EUCAST breakpoints (Table 6).
Table 6.
MIC and susceptibility results for H. influenzae isolates
| Susceptibility |
|||||||||||||
|---|---|---|---|---|---|---|---|---|---|---|---|---|---|
| MIC (mg/L) |
CLSI |
PK/PD |
EUCAST |
||||||||||
| Antimicrobial | Isolate group | n | 50% | 90% | min | max | %S | %I | %R | %S | %S | %I | %R |
| AMCa,b | All | 339 | 1 | 4 | ≤0.015 | >256 | 91.7 (90.0)c | — | 8.3 (10.0)c | 87.9 (91.7) | 87.9 (82.9)c | — | 12.1 (17.1)c |
| BL− | 316 | 0.5 | 4 | ≤0.015 | >256 | 91.5 | — | 8.5 | 88.6 (91.5) | 88.6 | — | 11.4 | |
| BL+ | 23 | 2 | 4 | 0.5 | 8 | 95.7 | — | 4.3 | 78.3 (95.7) | 78.3 | — | 21.7 | |
| Ampicillind | all | 339 | 0.5 | 32 | ≤0.015 | >256 | 78.5 | 5.6 | 15.9 | NA | 78.5 | — | 21.5 |
| BL− | 316 | 0.5 | 2 | ≤0.015 | >256 | 84.2 | 6.0 | 9.8 | NA | 84.2 | — | 15.8 | |
| BL+ | 23 | 32 | >256 | 4 | >256 | 0 | 0 | 100 | NA | 0 | — | 100 | |
| Azithromycine,f | all | 230 | 2 | 4 | ≤0.015 | 256 | 99.6 | — | — | NA | NA | NA | NA |
| BL− | 214 | 2 | 4 | ≤0.015 | 256 | 99.5 | — | — | NA | NA | NA | NA | |
| BL+ | 16 | 2 | 4 | 0.5 | 4 | 100 | — | — | NA | NA | NA | NA | |
| Cefaclorb | all | 339 | 2 | 8 | ≤0.015 | >256 | 93.8 (86.4)c | 1.8 (1.5)c | 4.4 (12.1)c | 23.0 | NA | NA | NA |
| BL− | 316 | 2 | 8 | ≤0.015 | >256 | 94.4 | 1.9 | 4.7 | 23.7 | NA | NA | NA | |
| BL+ | 23 | 2 | 8 | 0.03 | 8 | 100 | 0 | 0 | 13.0 | NA | NA | NA | |
| Cefpodoxime | all | 339 | 0.12 | 0.5 | ≤0.015 | >256 | 98.2 | — | — | 95.0 | 86.4 | 8.5 | 5.1 |
| BL− | 316 | 0.12 | 0.5 | ≤0.015 | >256 | 98.1 | — | — | 95.3 | 86.7 | 8.5 | 4.8 | |
| BL+ | 23 | 0.12 | 0.5 | 0.03 | 1 | 100 | — | — | 91.3 | 82.6 | 8.7 | 8.7 | |
| Ceftriaxone | all | 339 | 0.008 | 0.03 | ≤0.002 | >256 | 98.8 | — | — | 98.8 | 97.9 | — | 2.1 |
| BL− | 316 | 0.008 | 0.03 | ≤0.002 | >256 | 98.7 | — | — | 98.7 | 98.1 | — | 1.9 | |
| BL+ | 23 | ≤0.015 | 0.03 | ≤0.002 | 0.5 | 100 | — | — | 100 | 95.7 | — | 4.3 | |
| Cefuroximeb,g | all | 339 | 0.5 | 2 | ≤0.015 | >256 | 97.4 (89.1)c | 0.6 (0.3)c | 2.1 (10.6)c | 84.7 | 14.8 (13.0)c | 69.9 (61.1)c | 15.3 (26.0)c |
| BL− | 316 | 0.5 | 2 | ≤0.015 | >256 | 97.2 | 0.6 | 2.2 | 84.5 | 15.5 | 69.0 | 15.5 | |
| BL+ | 23 | 0.5 | 2 | 0.12 | 4 | 100 | 0 | 0 | 87.0 | 4.3 | 82.6 | 13.0 | |
| Levofloxacin | all | 339 | 0.015 | 0.06 | ≤0.002 | >32 | 96.5 | — | — | 96.5 | 96.2 | — | 3.8 |
| BL− | 316 | 0.015 | 0.06 | ≤0.002 | >32 | 96.5 | — | — | 96.5 | 96.2 | — | 3.8 | |
| BL+ | 23 | 0.03 | 0.5 | 0.008 | 8 | 95.7 | — | — | 95.7 | 95.7 | — | 4.3 | |
AMC, amoxicillin/clavulanic acid; BL−, β-lactamase negative; BL+, β-lactamase positive; 50%, concentration required to inhibit 50% of isolates; 90%, concentration required to inhibit 90% of isolates; min, minimum MIC observed; max, maximum MIC observed; S, susceptible; I, intermediate; R, resistant; NA, not applicable; NA, no breakpoint data available (NA for azithromycin by PK/PD and EUCAST because Etest® breakpoints in CO2 not available).
aPK/PD susceptibility at high dose is shown in parentheses.
bIn clinical settings, isolates of BLNAR are considered resistant to amoxicillin/clavulanic acid, cefaclor and cefuroxime (see main text).
cClinical susceptibility to amoxicillin/clavulanic acid, cefaclor and cefuroxime reduced (data in parenthesis) due to corrections according to BLNAR (see main text).
dIn clinical settings, all β-lactamase-positive H. influenzae should be considered resistant.
ebioMérieux Etest® breakpoints for incubation in CO2 used for macrolides.
fAzithromycin QC data were out of range for some MIC batches, so these isolates (n = 109) are not included.
gBreakpoints used are for cefuroxime axetil.
Table 7.
Distribution of H. influenzae MICs
| Number of isolates at MIC (mg/L) |
||||||||||||||||||||||
|---|---|---|---|---|---|---|---|---|---|---|---|---|---|---|---|---|---|---|---|---|---|---|
| Drug | n | ≤0.002 | 0.004 | 0.008 | ≤0.015 | 0.015 | 0.03 | 0.06 | 0.12 | 0.25 | 0.5 | 1 | 2 | 4 | 8 | 16 | 32 | >32 | 64 | 128 | 256 | >256 |
| AMC | 339 | 0 | 0 | 0 | 13 | 0 | 6 | 10 | 19 | 41 | 78 | 84 | 47 | 13 | 8 | 1 | 1 | 0 | 0 | 0 | 0 | 18 |
| Ampicillin | 339 | 0 | 0 | 0 | 8 | 0 | 8 | 8 | 26 | 88 | 82 | 46 | 19 | 4 | 5 | 7 | 5 | 0 | 3 | 0 | 0 | 30 |
| Azithromycina | 230 | 0 | 0 | 0 | 4 | 0 | 0 | 1 | 3 | 11 | 24 | 58 | 93 | 33 | 2 | 0 | 0 | 0 | 0 | 0 | 1 | 0 |
| Cefaclor | 339 | 0 | 0 | 0 | 6 | 0 | 9 | 5 | 9 | 18 | 31 | 76 | 107 | 31 | 26 | 6 | 8 | 0 | 2 | 0 | 0 | 5 |
| Cefpodoxime | 339 | 0 | 0 | 0 | 17 | 0 | 45 | 96 | 87 | 48 | 29 | 10 | 1 | 0 | 1 | 0 | 2 | 0 | 0 | 0 | 0 | 3 |
| Ceftriaxone | 339 | 63 | 94 | 94 | 0 | 48 | 25 | 6 | 2 | 0 | 3 | 0 | 0 | 1 | 1 | 0 | 0 | 0 | 0 | 0 | 0 | 2 |
| Cefuroxime | 339 | 0 | 0 | 0 | 10 | 0 | 9 | 12 | 19 | 81 | 92 | 64 | 30 | 13 | 2 | 2 | 2 | 0 | 1 | 0 | 0 | 2 |
| Levofloxacin | 339 | 14 | 22 | 36 | 0 | 127 | 96 | 18 | 3 | 3 | 6 | 1 | 1 | 3 | 1 | 3 | 1 | 4 | 0 | 0 | 0 | 0 |
AMC, amoxicillin/clavulanic acid.
aAzithromycin QC data were out of range for some MIC batches, so these isolates (n = 109) are not included.
Figure 4.
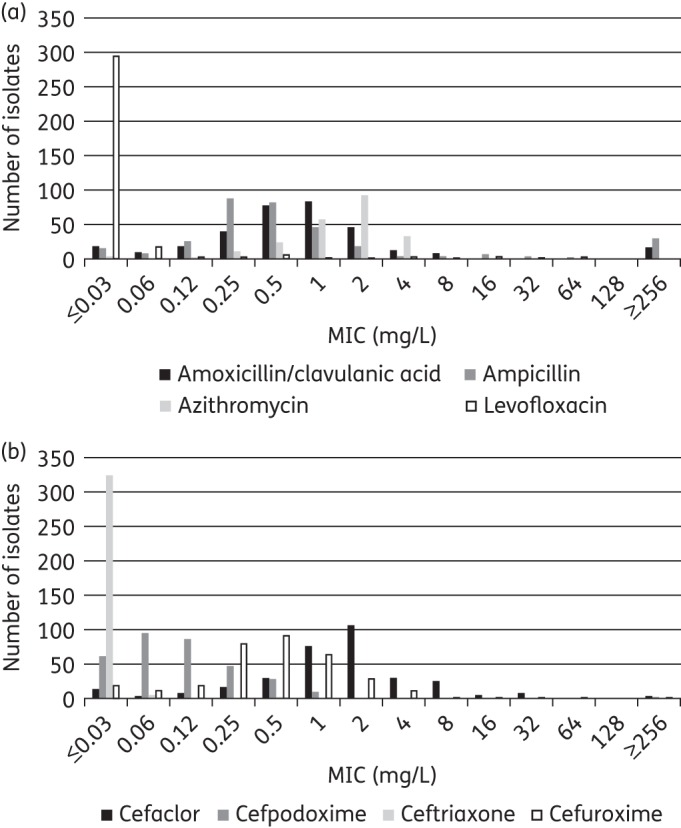
MIC distribution for (a) amoxicillin/clavulanic acid, ampicillin, azithromycin and levofloxacin, and (b) cefaclor, cefpodoxime, ceftriaxone, and cefuroxime against H. influenzae.
Overall, 78.5% of H. influenzae isolates were susceptible to ampicillin using CLSI or EUCAST breakpoints. As would be expected, ampicillin was inactive against the β-lactamase-positive strains, and the β-lactamase-negative susceptibility rate was also reduced to 84.2% due to the BLNAR isolates included in this group.
High susceptibility was observed for azithromycin (99.6% using CLSI breakpoints, including 100% of β-lactamase-positive isolates) and ceftriaxone (∼98% and above by all breakpoints). Rates of susceptibility to cefpodoxime and cefuroxime were also >95% by CLSI criteria (but susceptibility to cefuroxime reduced to 89.1% using the CLSI breakpoints adjusted for BLNAR). However, using EUCAST breakpoints the values were reduced to 86.4% for cefpodoxime and 14.8% for cefuroxime (13% using BLNAR adjusted EUCAST criteria). Cefaclor showed a dramatic drop in susceptibility when comparing CLSI and PK/PD breakpoints (93.8% and 23.0%, respectively, Table 6).
Susceptibility to levofloxacin was very similar across breakpoints, with 96.5% susceptible using CLSI and PK/PD breakpoints and 96.2% by the EUCAST breakpoints. These values were slightly reduced in β-lactamase-positive strains, which were 95.7% susceptible using all three breakpoints (Table 6).
M. catarrhalis
The specimen sources for the 40 M. catarrhalis isolates were sputum (n = 29, 72.5%), tracheal aspirate (n = 8, 20.0%), blood (n = 2, 5.0%), and bronchoalveolar lavage (n = 1, 2.5%). Nineteen isolates came from elderly patients (47.5%), 17 from adult patients (42.5%) and 4 from paediatric patients (10.0%). All but 1 of the 40 isolates were β-lactamase positive.
Summary MIC and susceptibility data for M. catarrhalis are shown in Table 8. MIC distribution data are given in Table 9. M. catarrhalis isolates were 100% susceptible to amoxicillin/clavulanic acid and levofloxacin using all types of breakpoints. Susceptibility to cefuroxime was 100% by CLSI and 90% by PK/PD breakpoints but only 7.5% by EUCAST. The susceptibility to cefaclor was much lower using PK/PD breakpoints (32.5%), but remained at 100% using CLSI criteria (Table 8).
Table 8.
MIC and susceptibility results for M. catarrhalis isolates
| Susceptibility |
||||||||||||
|---|---|---|---|---|---|---|---|---|---|---|---|---|
| MIC (mg/L) |
CLSI |
PK/PD |
EUCAST |
|||||||||
| Antimicrobial | n | 50% | 90% | min | max | %S | %I | %R | %S | %S | %I | %R |
| AMCa | 40 | 0.25 | 0.5 | ≤0.015 | 0.5 | 100 | — | 0 | 100 (100) | 100 | — | 0 |
| Azithromycinb | 33 | 0.12 | 0.5 | 0.03 | 0.5 | NA | — | — | NA | NA | NA | NA |
| Cefaclor | 40 | 1 | 1 | 0.25 | 2 | 100 | 0 | 0 | 32.5 | NA | NA | NA |
| Cefuroxime | 40 | 1 | 1 | ≤0.015 | 2 | 100 | 0 | 0 | 90 | 7.5 | 92.5 | 0 |
| Levofloxacin | 40 | 0.06 | 0.06 | 0.015 | 1 | 100 | — | — | 100 | 100 | — | 0 |
AMC, amoxicillin/clavulanic acid; 50%, concentration required to inhibit 50% of isolates; 90%, concentration required to inhibit 90% of isolates; min, minimum MIC observed; max, maximum MIC observed; S, susceptible; I, intermediate; R, resistant; NA, not applicable; NA, no breakpoint data available (NA for azithromycin because Etest® breakpoints in CO2 not available).
aPK/PD susceptibility at high dose is shown in parentheses.
bAzithromycin QC data were out of range for some MIC batches, so these isolates (n = 7) are not included.
Table 9.
Distribution of M. catarrhalis MICs
| Number of isolates at MIC (mg/L) |
||||||||||
|---|---|---|---|---|---|---|---|---|---|---|
| Drug | n | ≤0.015 | 0.015 | 0.03 | 0.06 | 0.12 | 0.25 | 0.5 | 1 | 2 |
| AMC | 40 | 2 | 0 | 5 | 5 | 7 | 16 | 5 | 0 | 0 |
| Azithromycina | 33 | 0 | 0 | 6 | 8 | 13 | 1 | 5 | 0 | 0 |
| Cefaclor | 40 | 0 | 0 | 0 | 0 | 0 | 3 | 10 | 24 | 3 |
| Cefuroxime | 40 | 2 | 0 | 1 | 0 | 0 | 3 | 5 | 25 | 4 |
| Levofloxacin | 40 | 0 | 3 | 13 | 22 | 0 | 0 | 1 | 1 | 0 |
AMC, amoxicillin/clavulanic acid.
aAzithromycin QC data were out of range for some MIC batches, so these isolates (n = 7) are not included.
Age group analysis
Susceptibility was compared across age groups using CLSI breakpoints. Statistically significant differences were found for S. pneumoniae (Figure 5). Cefaclor, cefpodoxime, cefuroxime and penicillin (using oral breakpoints) were significantly less active against isolates from children than those from adults and elderly patients (P < 0.05). No significant differences between age groups were found in the susceptibility of S. pyogenes, H. influenzae or M. catarrhalis to any of the tested antimicrobials.
Figure 5.
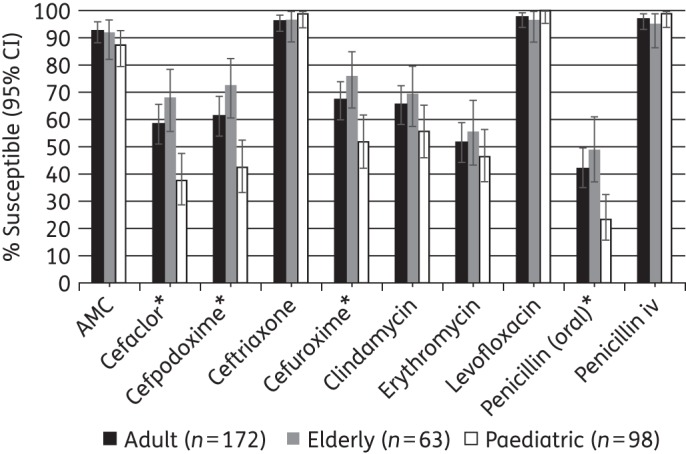
Percentage susceptible rates (with 95% CI) for antimicrobials against S. pneumoniae by age group according to CLSI breakpoints. *Susceptibility was significantly lower in children compared with adults and the elderly (P < 0.05). AMC, amoxicillin/clavulanic acid.
Site analysis
To assess variability between sites in Turkey, susceptibility to S. pneumoniae and H. influenzae by CLSI breakpoints was compared across sites where the number of isolates collected per species was ≥30 (Figures 6 and 7). S. pneumoniae isolates from the Ege University Hospital in Izmir had significantly higher susceptibility to amoxicillin/clavulanic acid, cefaclor, cefpodoxime and cefuroxime (all 100% susceptible by CLSI breakpoints) than isolates from all other sites (which showed ≤92%, ≤49%, ≤58% and ≤64% susceptibility to the four drugs, respectively), while Marmara University in Istanbul had a greater proportion of isolates susceptible to clindamycin (78%) and erythromycin (68%) than the other sites, with susceptibility rates at these sites of ≤63% and ≤47%, respectively (P < 0.05).
Figure 6.
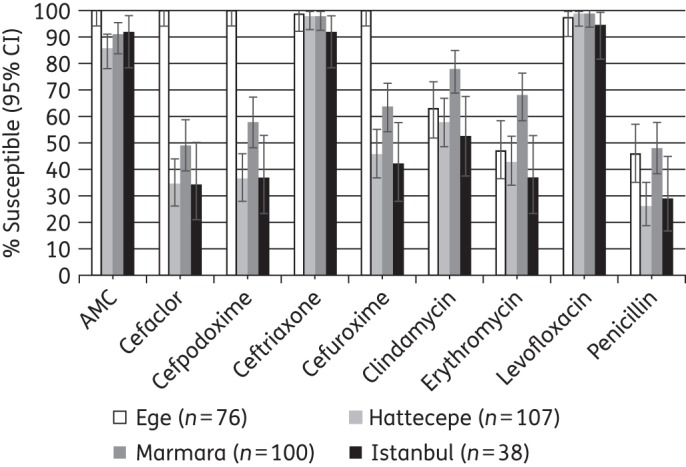
Percentage susceptible rates (with 95% CI) for antimicrobials against S. pneumoniae by site according to CLSI breakpoints. AMC, amoxicillin/clavulanic acid.
Figure 7.
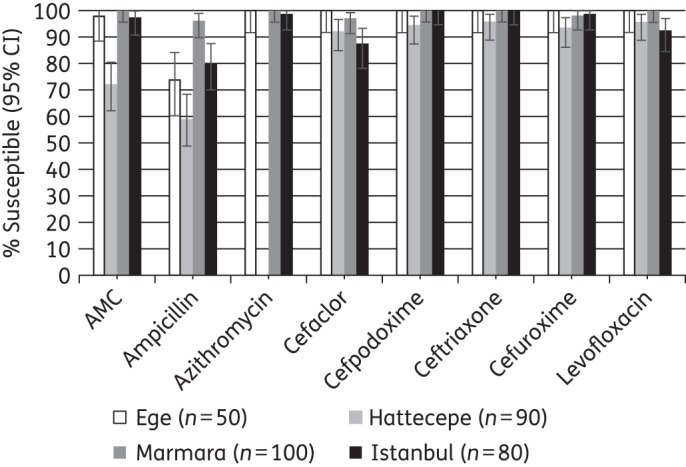
Percentage susceptible rates (with 95% CI) for antimicrobials against H. influenzae by site according to CLSI breakpoints. AMC, amoxicillin/clavulanic acid.
For S. pyogenes, only erythromycin showed significant differences between sites, with Ege University Hospital showing significantly lower susceptibility than the other sites (80% versus ≥96% susceptible, P < 0.05).
Isolates of H. influenzae from Hacettepe University in Ankara showed significantly lower susceptibility to amoxicillin/clavulanic acid (72%) than those from other sites (≥97% susceptible) and significantly lower susceptibility to ampicillin (59%) than isolates from Marmara and Istanbul University (≥80% susceptible) but not from Ege (74% susceptible).
Discussion
Just as Turkey has been identified to be an outlier when it comes to antibiotic use, the country also showed resistance patterns for some key respiratory pathogens that were exceptional in Europe. The most dramatic differences between the antimicrobial activity results in Turkey and those in other countries were found for S. pneumoniae. Penicillin non-susceptibility, at 61.8%, in Turkey was much higher than the rate for Europe as a whole (11.9%) and for the European countries with the highest rates (Malta 38.9%, Romania 37.2% and Bulgaria 28.6%) described in the 2012 EARS-Net report.15 Penicillin non-susceptible rates in Turkey were already high in studies of isolates collected between 2002 and 2003 (31.2% intermediate) and between 2004 and 2005 (24.6% intermediate and 7.6% resistant) as part of an earlier SOAR study.16–18 However, it appears that in the intervening years susceptibility to penicillin has decreased even further; SOAR data from Turkey between 2007 and 2009 reported penicillin susceptibility as 47.2%.18 Furthermore, macrolide non-susceptibility in Turkey was much higher than the European average (49% versus 17%),15 and has also increased significantly compared with earlier reports from Turkey. In the current study, 45.8% of isolates were erythromycin resistant by CLSI breakpoints compared with 15.6% in SOAR 2004–05 and 13.7% in a study of healthy schoolchildren in Turkey between 2002 and 2003.16,19 A similarly large decrease in activity was found for cefaclor (85.3% susceptible in SOAR 2002–03,18 78.7% susceptible in SOAR 2004–0516 and 53.5% susceptible in SOAR 2007–0918 versus 54.4% in the current study), while the decrease in susceptibility to amoxicillin/clavulanic acid was much lower (100% in SOAR 2002–03,18 98.7% in SOAR 2004–0516 and 97.7% in SOAR 2007–0918 versus 91.3% in the current study). Susceptibility to amoxicillin/clavulanic acid by CLSI breakpoints was similar to levels found in Europe overall (91.9%).20 The susceptibility increased to 99.1%, when the higher-dose PK/PD breakpoints were used. The only other agents for which rates of susceptibility were >95% in Turkey were ceftriaxone, levofloxacin and high-dose penicillin (iv). While a global study found significantly higher penicillin and erythromycin resistance in infants compared with adults and the elderly,21 our findings were similar to another Turkish study, in that penicillin susceptibility was significantly lower in children, but there was no significant difference in macrolide susceptibility between age groups.16 When analysing data by site, susceptibility was generally high to amoxicillin/clavulanic acid, ceftriaxone and levofloxacin and generally low to penicillin. Susceptibility was also low to cefaclor, cefpodoxime and cefuroxime in all sites except Ege, where full susceptibility was observed. Similarly, low susceptibility to erythromycin and clindamycin was observed in all sites except Marmara.
Antibiotic susceptibility of S. pyogenes from Turkey remained high. Non-susceptible strains were only seen for clindamycin, levofloxacin and erythromycin. For erythromycin, 2.3% and 3.6% of isolates were reported as resistant and intermediate, respectively. This level of non-susceptibility was also seen on an individual site basis, except for Ege, where erythromycin resistance was 5.8% and intermediate 13.7%. This compares favourably to European countries such as Spain (21.3% resistant)22 and France (22.4% resistant).23 However, Turkish macrolide resistance rates were reported at 1.9% in 2002,24 3.3% in 200419 and 9% in 2010.25 Since this may constitute an increasing trend, continued monitoring is recommended. The non-susceptibility to levofloxacin of 1.8% using CLSI breakpoints and 7.7% using EUCAST are interesting findings, since fluoroquinolone resistance has not been extensively studied in S. pyogenes and reports of resistance have been rare.26 One Spanish study found 3.5% of isolates resistant to ciprofloxacin by CLSI criteria,27 while none was non-susceptible to levofloxacin in a Canadian study using CLSI breakpoints (but 4.4% had an MIC of 2 mg/L, which would be considered intermediate by EUCAST criteria).25 The clinical significance of this non-susceptibility is unclear since there have been few reports of clinical failures associated with resistance.25
Rates of β-lactamase-positive H. influenzae vary widely worldwide, with findings as high as 52.4% reported recently in Korea.28 In contrast, the rate of β-lactamase-positive H. influenzae remains low in Turkey. The figure of 6.8% found in this study is similar to rates of 6.1% found in a Turkish study between 2002 and 200317 and 5.5% reported by Sener et al.16 in 2004–05. However, Sener et al.16 found only 0.5% BLNAR strains and SOAR 2007–09 data from Turkey found 2.2% BLNAR strains,18 whereas in the current study 9.1% of all H. influenzae were BLNAR (CLSI definition). Accordingly, the amoxicillin/clavulanic acid activity of 91.7% found in this study using CLSI and high-dose PK/PD breakpoints (90% using the CLSI BLNAR-adjusted breakpoint) was lower than the 99.5% and 97.6%, respectively, reported by Sener et al.16 in 2007 and was also lower than the 100% of H. influenzae isolates reported as susceptible to amoxicillin/clavulanic acid based on CLSI breakpoints in SOAR data from Turkey between 2007 and 2009 (BLNAR-adjusted breakpoints were not used during the study period).18 It is also somewhat lower than the susceptibility of 94.1% found for Europe as a whole for isolates collected in 2008–09.20 Analysis by site showed that this low amoxicillin/clavulanic acid susceptibility was driven by isolates from one site only (Hacettepe University). Of further interest is a comparatively high rate of 3.5% non-susceptibility to levofloxacin. Worldwide resistance rates are <1%, with 0% found recently in Europe and the USA29,30 and 0% in Turkey reported in 2003.31 However, rates of up to 24% were reported from Taiwan in 2010.32 These Taiwanese levofloxacin-resistant strains were found mainly in elderly patients; however, in the Turkish isolates there was no significant difference in levofloxacin susceptibility across age groups. For some antimicrobials H. influenzae susceptibility varied dramatically when using different breakpoints. CLSI breakpoints indicate good activity (94% susceptibility) of cefaclor against H. influenzae (86.4% of isolates susceptible using BLNAR-adjusted CLSI breakpoints), while the PK/PD breakpoint resulted in a dramatically lower susceptibility rate of 23%. Similarly, cefuroxime showed susceptibility of 97% by CLSI criteria (89% when adjusted according to BLNAR), 85% by PK/PD and only 15% by EUCAST (13% when adjusted according to BLNAR). Better alignment of these breakpoints would help clinicians in making their daily treatment decisions as well as microbiologists and epidemiologists in comparing susceptibility results across laboratories and countries that are using different breakpoints and sometimes even switch over time.
M. catarrhalis isolates remained 100% susceptible using CLSI criteria to almost all of the agents tested in this study. But again cefaclor showed a dramatic discrepancy between susceptibility by the CLSI breakpoint (100%) and PK/PD criteria (32.5%). Even more so, EUCAST susceptible breakpoints for cefuroxime axetil against M. catarrhalis are 5-fold lower than CLSI, producing a dramatic reduction in susceptibility (100% susceptible by CLSI versus 7.5% by EUCAST). This discrepancy was addressed by Marchese et al.,33 further highlighting the need to align the different MIC interpretive criteria.
The data from this study confirm that isolates of S. pneumoniae susceptible to penicillin G are also susceptible to other penicillins as inferred by CLSI and EUCAST guidelines and cephalosporins as inferred by CLSI guidelines. Interestingly, the data from this study found the reverse was not correct using CLSI breakpoints; i.e. penicillin-non-susceptible S. pneumoniae were susceptible to other β-lactams—the most significant being ceftriaxone. Therefore, either the β-lactam breakpoints are not correct or the CLSI cross-resistance statement within the β-lactam class is not correct. This warrants further investigation.
The data from the SOAR study in Turkey showed that between 2003–03, 2004–05 and 2007–09 there was a statistically significant reduction in susceptibility of S. pneumoniae to penicillin, cefaclor and clarithromycin but not to amoxicillin/clavulanic acid (amoxicillin). Changes of susceptibility rates among H. influenzae between 2002 and 2009 did not show any statistical significance for ampicillin, amoxicillin/clavulanic acid and clarithromycin. However, there was a significant decrease in susceptibility to cefaclor.18
Turkey has the highest antibiotic use in Europe and is also ranked in the top 9 among 42 countries in the region when examining drug classes individually (fourth in use of penicillins, first in cephalosporins, ninth in macrolides and fourth in quinolones).9 Since it has been shown that antimicrobial use is a main driver of resistance,6–8 it comes as no surprise that this excessive use of many different antibiotics in Turkey goes along with both high-level and broad resistance across several drugs in S. pneumoniae. However, other pathogens showed a more varied resistance pattern. For example, macrolide susceptibility was reduced in M. catarrhalis but not in H. influenzae; the BLNAR rate in H. influenzae was relatively high in Turkey, while the rate of β-lactamase-positive isolates remained low. Furthermore, antimicrobial susceptibility also varied across participating sites, as mentioned above. The effect of high use of antimicrobials on resistance patterns appears to be complex.
In response to the recent finding of high antibiotic use, the Turkish government has developed a national action plan aimed at the reduction of antibiotic consumption over the next several years. This represents an important chance to evaluate the impact of such an intervention both on actual use and on antimicrobial resistance. The results of both the report on antibiotic consumption and this susceptibility study provide baseline values and benchmarks against which changes can be measured. Continued surveillance of both antimicrobial use and susceptibility is crucial to objectively assess progress in reduction of drug use and improvements in susceptibility, providing important learning opportunities for Turkey and for all other countries interested in tackling excessive consumption of antibiotics and increasing resistance.
Funding
This study was funded by GlaxoSmithKline.
Transparency declarations
This article is part of a Supplement sponsored by GlaxoSmithKline. D. Torumkuney and H. Gorur are employees of GlaxoSmithKline. D. Torumkuney also holds shares in GlaxoSmithKline. I. Morrissey is an employee of IHMA, a medical communication and consultancy company, who participated in the exploration, interpretation of the results and preparation of this manuscript on behalf of GSK. IHMA also provided medical writing support in the form of writing assistance, collating author's comments, grammatical editing and referencing that was paid for by GSK. All other authors declare that they have no conflict of interest.
Editorial assistance was provided by Tracey Morris, Livewire Editorial Communications.
Acknowledgements
We would like to thank Duygu Percin (Erciyes University, Kayseri), Oral Oncul [Department of Infectious Diseases and Clinical Microbiology, Gulhane Military Medical Academy, Haydarpasa Training and Research Hospital (GATA), Istanbul], Dilara Ogunc (Akdeniz University Medical Faculty, Antalya), Inci Tuncer (Selcuk University Medical Faculty, Konya) for collecting isolates, Sibylle Lob (International Health Management Associates Inc.) for assistance with data analysis and drafting the manuscript, and Dr Keith Barker (GSK) and Devrim Ulusal (GSK) for reviewing the manuscript.
References
- 1.World Health Organization. World Health 2014. Part III. Global Health Indicators. http://www.who.int/gho/publications/world_health_statistics/EN_WHS2014_Part3.pdf?ua=1.
- 2.Torres A, Blasi F, Peetermans WE et al. The aetiology and antibiotic management of community-acquired pneumonia in adults in Europe: a literature review. Eur J Clin Microbiol Infect Dis 2014; 33: 1065–79. [DOI] [PMC free article] [PubMed] [Google Scholar]
- 3.Welte T, Torres A, Nathwani D. Clinical and economic burden of community-acquired pneumonia among adults in Europe. Thorax 2012; 67: 71–9. [DOI] [PubMed] [Google Scholar]
- 4.Tleyjeh IM, Tlaygeh HM, Hejal R et al. The impact of penicillin resistance on short-term mortality in hospitalized adults with pneumococcal pneumonia: a systematic review and meta-analysis. Clin Infect Dis 2006; 42: 778–97. [DOI] [PubMed] [Google Scholar]
- 5.Jacobs MR, Johnson CE. Macrolide resistance: an increasing concern for treatment failure in children. Pediatr Infect Dis 2003; 22: S131–8. [DOI] [PubMed] [Google Scholar]
- 6.Riedel S, Beekmann SE, Heilmann KP et al. Antimicrobial use in Europe and antimicrobial resistance in Streptococcus pneumoniae. Eur J Clin Microbiol Infect Dis 2007; 26: 485–90. [DOI] [PubMed] [Google Scholar]
- 7.Goossens H, Ferech M, Vander Stichele R et al. Outpatient antibiotic use in Europe and association with resistance: a cross-national database study. Lancet 2005; 365: 579–87. [DOI] [PubMed] [Google Scholar]
- 8.Bronzwaer SL, Cars O, Buchholz U et al. A European study on the relationship between antimicrobial use and antimicrobial resistance. Emerg Infect Dis 2002; 8: 278–82. [DOI] [PMC free article] [PubMed] [Google Scholar]
- 9.Versporten A, Bolokhovets G, Ghazaryan L et al. Antibiotic use in Eastern Europe: a cross-national database study in coordination with the WHO Regional Office for Europe. Lancet Infect Dis 2014; 14: 381–7. [DOI] [PubMed] [Google Scholar]
- 10.Clinical and Laboratory Standards Institute. Performance Standards for Antimicrobial Disk Susceptibility Tests—Eleventh Edition: Approved Standard M02-A11. CLSI, Wayne, PA, USA, 2012. [Google Scholar]
- 11.Clinical and Laboratory Standards Institute. Performance Standards for Antimicrobial Susceptibility Testing: Twenty-fourth Informational Supplement M100-S24. CLSI, Wayne, PA, USA, 2014. [Google Scholar]
- 12.Clinical and Laboratory Standards Institute. Methods for Antimicrobial Dilution and Disk Susceptibility Testing of Infrequently Isolated or Fastidious Bacteria—Second Edition: Approved Guideline M45-A2. CLSI, Wayne, PA, USA, 2012. [Google Scholar]
- 13.The European Committee on Antimicrobial Susceptibility testing. Breakpoint Tables for Interpretation of MICs and Zone Diameters. Version 4.0, 2014 http://www.eucast.org.
- 14.Anon JB, Jacobs MR, Poole MD et al. Antimicrobial treatment guidelines for acute bacterial rhinosinusitis. Otolaryngol Head Neck Surg 2004; 130 Suppl 1: 1–45. [DOI] [PMC free article] [PubMed] [Google Scholar]
- 15.European Centre for Disease Prevention and Control. Antimicrobial Resistance Surveillance in Europe 2012. Annual Report of the European Antimicrobial Resistance Surveillance Network (EARS-Net). Stockholm: ECDC; 2013 http://ecdc.europa.eu/en/publications/Publications/antimicrobial-resistance-surveillance-europe-2012.pdf.
- 16.Sener B, Tunckanat F, Ulusoy S et al. A survey of antibiotic resistance in Streptococcus pneumoniae and Haemophilus influenzae in Turkey, 2004-2005. J Antimicrob Chemother 2007; 60: 587–93. [DOI] [PubMed] [Google Scholar]
- 17.Ozyilmaz E, Akan OA, Gulhan M et al. Major bacteria of community-acquired respiratory tract infections in Turkey. Jpn J Infect Dis 2005; 58: 50–2. [PubMed] [Google Scholar]
- 18.Torumkuney D, Gur D, Soyletir G et al. Results from the Survey of Antibiotic Resistance (SOAR) 2002–09 in Turkey. J Antimicrob Chemother 2016; 71 Suppl 1: i85–i91. [DOI] [PMC free article] [PubMed] [Google Scholar]
- 19.Gazi H, Kurutepe S, Sürücüoğlu S et al. Antimicrobial susceptibility of bacterial pathogens in the oropharynx of healthy school children in Turkey. Indian J Med Res 2004; 120: 489–94. [PubMed] [Google Scholar]
- 20.Jones RN, Farrell DJ, Mendes RE et al. Comparative ceftaroline activity tested against pathogens associated with community-acquired pneumonia: results from an international surveillance study. J Antimicrob Chemother 2011; 66 Suppl 3: iii69–80. [DOI] [PubMed] [Google Scholar]
- 21.Hoban D, Baquero F, Reed V et al. Demographic analysis of antimicrobial resistance among Streptococcus pneumoniae: worldwide results from PROTEKT 1999–2000. Int J Infect Dis 2005; 9: 262–73. [DOI] [PubMed] [Google Scholar]
- 22.Pérez-Trallero E, Montes M, Orden B et al. Phenotypic and genotypic characterization of Streptococcus pyogenes isolates displaying the MLSB phenotype of macrolide resistance in Spain, 1999 to 2005. Antimicrob Agents Chemother 2007; 51: 1228–33. [DOI] [PMC free article] [PubMed] [Google Scholar]
- 23.Bingen E, Bidet P, Mihaila-Amrouche L et al. Emergence of macrolide-resistant Streptococcus pyogenes strains in French children. Antimicrob Agents Chemother 2004; 48: 3559–62. [DOI] [PMC free article] [PubMed] [Google Scholar]
- 24.Gür D, Ozalp M, Sümerkan B et al. Prevalence of antimicrobial resistance in Haemophilus influenzae, Streptococcus pneumoniae, Moraxella catarrhalis and Streptococcus pyogenes: results of a multicentre study in Turkey. Int J Antimicrob Agents 2002; 19: 207–11. [DOI] [PubMed] [Google Scholar]
- 25.Dundar D, Sayan M, Tamer GS. Macrolide and tetracycline resistance and emm type distribution of Streptococcus pyogenes isolates recovered from Turkish patients. Microb Drug Resist 2010; 4: 279–84. [DOI] [PMC free article] [PubMed] [Google Scholar]
- 26.Powis J, McGeer A, Duncan C et al. Prevalence and characterization of invasive isolates of Streptococcus pyogenes with reduced susceptibility to fluoroquinolones. Antimicrob Agents Chemother 2005; 5: 2130–2. [DOI] [PMC free article] [PubMed] [Google Scholar]
- 27.Pérez-Trallero E, Fernández-Mazarrasa C, García-Rey C et al. Antimicrobial susceptibilities of 1,684 Streptococcus pneumoniae and 2,039 Streptococcus pyogenes isolates and their ecological relationships: results of a 1-year (1998–1999) multicenter surveillance study in Spain. Antimicrob Agents Chemother 2001; 12: 3334–40. [DOI] [PMC free article] [PubMed] [Google Scholar]
- 28.Bae S, Lee J, Lee J et al. Antimicrobial resistance in Haemophilus influenzae respiratory tract isolates in Korea: results of a nationwide acute respiratory infections surveillance. Antimicrob Agents Chemother 2010; 54: 65–71. [DOI] [PMC free article] [PubMed] [Google Scholar]
- 29.Darabi A, Hocquet D, Dowzicky MJ. Antimicrobial activity against Streptococcus pneumoniae and Haemophilus influenzae collected globally between 2004 and 2008 as part of the Tigecycline Evaluation and Surveillance Trial. Diagn Microbiol Infect Dis 2010; 1: 78–86. [DOI] [PubMed] [Google Scholar]
- 30.Pfaller MA, Farrell DJ, Sader H et al. AWARE Ceftaroline Surveillance Program (2008–2010): trends in resistance patterns among Streptococcus pneumoniae, Haemophilus influenzae, and Moraxella catarrhalis in the United States. Clin Infect Dis 2012; 55 Suppl 3: S187–93. [DOI] [PubMed] [Google Scholar]
- 31.Zarakolu P, Soyletir G, Gur D et al. Antimicrobial resistance patterns of respiratory pathogens: a local report from Turkey. Clin Microbiol Infect 2003; 12: 1257–8. [DOI] [PubMed] [Google Scholar]
- 32.Kuo SC, Chen PC, Shiau YR et al. Levofloxacin-resistant Haemophilus influenzae, Taiwan, 2004–2010. Emerg Infect Dis 2014; 20: 1386–90. [DOI] [PMC free article] [PubMed] [Google Scholar]
- 33.Marchese A, Esposito S, Barbieri R et al. Does the adoption of EUCAST susceptibility breakpoints affect the selection of antimicrobials to treat acute community-acquired respiratory tract infections? BMC Infect Dis 2012; 6: 12:181. [DOI] [PMC free article] [PubMed] [Google Scholar]