

Abstract
Gene expression profiling using DNA microarrays has become commonplace in current molecular biology practices, and has dramatically enhanced our understanding of the biology of Neisseria spp., and the interaction of these organisms with the host. With the choice of microarray platforms offered for gene expression profiling and commercially available arrays, investigators must ask several central questions to make decisions based on their research focus. Are arrays on hand for their organism and if not then would it be cost-effective to design custom arrays. Other important considerations; what types of specialized equipment for array hybridization and signal detection are required and is the specificity and sensitivity of the array adequate for your application. Here, we describe the use of a custom 12K CombiMatrix ElectraSense™ oligonucleotide microarray format for assessing global gene expression profiles in Neisseria spp.
Keywords: DNA microarray, Gene expression analysis, RNA purification, CombiMatrix, Electrochemical detection, Neisseria spp
1. Introduction
The last decade of study of the human pathogenic Neisseria spp. has been dramatically facilitated by the determination of the genome sequences of both Neisseria gonorrhoeae and Neisseria meningitidis. These achievements have supported the development of various microarray strategies that have been employed to perform gene expression profiling in Neisseria spp. (1–18), comparative genomics (19–26), multi-locus sequence typing (27), identification of potential vaccine antigens (28, 29), and the development of clinical assays (30–32) to identify these pathogens and their antibiotic resistance profiles. With the completion of the sequence of the human genome, microarrays also have been used to examine the host response to neisserial infection (33–39). Thus, it is no understatement that microarray technology has been instrumental in the rapid progress that has been made in the last decade in the study of N. meningitidis and N. gonorrhoeae. Our own experience with microarrays has employed spotted DNA arrays (13), Affymetrix arrays (1, 2), and most recently CombiMatrix ElectraSense arrays (manuscript in preparation) for gene expression profiling in the gonococcus. Each microarray format has advantages and disadvantages. Spotted microarrays offer low cost and ease of use, but often suffer from a lack of printing uniformity between microarrays. The Affymetrix oligonucleotide-based microarray is an extremely robust platform, but requires the availability of costly dedicated equipment and, in our experience with custom arrays, proprietary concerns can significantly hamper the easy availability of this format. Affymetrix microarrays also are the most expensive of commercially available options. CombiMatrix oligonucleotide microarrays have many of the advantages of the Affymetrix format, but are less expensive and can be reused multiple times, cutting costs even further. The CombiMatrix 12K ElectraSense array is a sensor chip that is a specially modified semiconductor circuitry with over 12,000 individual microelectrodes (features). Following hybridization of the biotin-labeled target to the oligonucleotide probe, HRP-streptavidin conjugate binds to the biotin-labeled target. The resulting redox reaction occurring on each microelectrode that releases an electron is detected by the ElectraSense reader as a current proportional to the biotin-labeled target present, eliminating problems with spot uniformity present in other platforms and differences in array to array variability when using fluorescent detection. Using the ElectraSense process has additional advantages, including the elimination of the use of fluorescent dyes with concomitant problems including higher cost, photo bleaching, and the limited storage life of the labeled cDNA. Below, we describe the use of custom CombiMatrix ElectraSense microarrays for gene expression profiling in N. gonorrhoeae.
2. Materials
2.1. Gonococcal Growth Conditions
2.2. Gonococcal Total RNA Extraction “Hot Phenol Method” (See Note 1)
Water saturated phenol pH 7.9.
100 % (v/v) Ethanol (store at −20 °C).
TE Buffer pH 8.0: 0.1 M EDTA, 10 mM Tris–HCl, pH 8.0.
10 % SDS.
1 M sodium acetate pH 5.5.
3 M sodium acetate pH 5.5.
80 % (v/v) Ethanol.
Nuclease-free water.
15 mL Falcon tubes.
RNaseZap RNase Decontamination Solution (Ambion/Applied Biosystems) (see Note 2).
Sterile 1.5 mL Eppendorf snap-cap microcentrifuge tubes (see Note 3).
65 °C water bath.
NanoDrop™ ND1000 (NanoDrop Products, Fisher Thermo Scientific).
Microlite RF Centrifuge (Thermo IEC).
Freezers (−20 and −80 °C).
100 % (v/v) Chloroform.
2.3. Assessment of RNA Quality
Agilent 2100 Bioanalyzer.
RNA 6000 Nano Chip Kit (Agilent).
2.4. DNase Treatment
RQ1 RNase-Free DNase (1 U/μL) with 10× Reaction Buffer (Promega).
Tri Reagent: phenol and guanidine thiocyanate in a mono-phase solution (Molecular Research, Inc.).
100 % (v/v) Chloroform.
100 % (v/v) Isopropanol.
Sterile 1.5 mL Eppendorf snap-cap microcentrifuge tubes (see Note 3).
Nuclease-free water (Ambion/Applied Biosystems).
37 °C heat block.
80 % (v/v) Ethanol (store at 4 °C).
Freezer (−80 °C).
NanoDrop™ ND1000 (NanoDrop Products, Fisher Thermo Scientific).
Microliter centrifuge.
2.5. Reverse Transcriptase and cDNA Labeling
High-Capacity cDNA Archive Kit (Applied Biosystems).
-
Arabidopsis thaliana mRNA positive controls (Stratagene):
SpotReport® mRNA Spike 1, Cab 10 ng/μL (store at −80 °C).
SpotReport® mRNA Spike 2, RCA 10 ng/μL (store at −80 °C).
SpotReport® mRNA Spike 3, RBCL 10 ng/μL (store at −80 °C).
Label IT® μArray ® Biotin Labeling Kit (Mirus).
0.5 M EDTA, pH 8.0.
MicroAmp® Optical 96-well reaction plate (Applied Biosystems).
MicroAmp® 96-well clear adhesive film (Applied Biosystems).
QIAquick® PCR Purification Kit (Qiagen).
GeneAmp® 9700 thermal cycler (Applied Biosystems).
Nuclease-free water.
Sterile 1.5 mL Eppendorf snap-cap microcentrifuge tubes (see Note 3).
37 °C heat block.
Centrifuge with 96-well plate carriers.
2.6. CombiMatrix Arrays: Hybridization and Data Collection
N. gonorrhoeae FA1090 CombiMatrix 12K ElectraSense™ Custom Array.
12K ElectraSense™ Hybridization Chamber (CombiMatrix).
CustomArray™ holders for rotisserie (CombiMatrix).
Hybridization oven with rotisserie (e.g., Fisher Thermo Scientific).
Nuclease-free water.
Pre-Hybridization Buffer (50 μL): 5 μL 2× Hyb Solution Stock, 34 μL Nuclease-free water, 10 μL 50× Denhardt’s Solution, 1 μL Sonicated Salmon sperm DNA (10 mg/mL). Before adding to the Pre-Hybridization Buffer, heat the Salmon sperm DNA for 5 min at 95 °C followed by 1 min on ice.
2× Hyb Solution Stock (10 mL): 6 mL 20× SSPE, 100 μL 10 %/v/v Tween-20, 560 μL 0.5 M EDTA, 3.34 mL Nuclease-free water.
50× Denhardt’s Solution (Sigma-Aldrich).
Sonicated Salmon sperm DNA (Ambion/Applied Biosystems).
10 % (v/v) Tween-20.
0.5 M EDTA, pH 8.0.
95 °C heat block.
Ice and ice bucket.
20× SSPE Buffer: 3 M NaCl, 0.2 M Na2PO4, 0.020 M EDTA.
Hybridization Buffer (100 μL): 50 μL Hyb Solution Stock, 1 μL Salmon sperm DNA heat denatured as listed for Pre-Hybridization Buffer, 4 μL 1 % SDS, biotin-labeled cDNA up to 45 μL, Nuclease-free water to bring the volume to 100 μL.
Biotinylated cDNA (see Subheading 2.5).
3× SSPET Wash Solution (100 mL): 15 mL 20× SSPE, 500 μL 10 % Tween-20, 84.5 mL Nuclease-free water.
0.5× SSPET Wash Solution (100 mL): 2.5 mL 20× SSPE, 500 μL 10 % Tween-20, 97 mL Nuclease-free water.
PBST Wash Solution (100 mL): 20 mL 10× PBS, 1 mL 10 % Tween-20, 79 mL Nuclease-free water.
10× Phosphate Buffered Saline (PBS): 1.37 M NaCl, 0.08 M Na2PO4, 0.02 M KH2PO4, 0.027 M KCl pH 7.4.
CombiMatrix ElectraSense Detection Kit™ (CombiMatrix).
CombiMatrix ElectraSense™ reader (CombiMatrix).
3. Methods
3.1. Gonococcal Growth Conditions
Growth in iron minus (CDM-0) and iron plus (CDM-10) medium was carried out as previously reported (1, 2). N. gonorrhoeae strain FA1090 was grown overnight from glycerol stocks on GC agar supplemented with 2 % IsoVitalex at 37 °C and 5 % CO2. Non-piliated organisms were selected and inoculated to another GC agar plate and incubated overnight for growth. Piliated and non-piliated colonies will grow as two distinct colony sizes with non-piliated colonies being larger than piliated colonies on GC agar. Growth of colonies from piliated N. gonorrhoeae causes significant clumping in broth making O.D. determinations difficult.
Non-piliated cells were inoculated into a 500 mL flask of CDM-0 to an absorbance of 0.100 at 600 nm. The flask was incubated at 37 °C (150 rpm) and the cells were allowed to double to an absorbance of 0.200 without the addition of ferric nitrate to delete internal iron stores. Doubling time typically takes between 1.5 and 2 h.
The iron-depleted cells were then split and diluted twofold into 500 mL flasks containing either CDM-0 or CDM-10. 10 mM Fe(NO3) pH 1.0 was added to the CDM-10 to a final concentration of 10 μM.
The two flasks were returned to the 37 °C (150 rpm) incubator. Cells were collected at 3 h time points for RNA isolation.
3.2. Gonococcal Total RNA Extraction “Hot Phenol Method”
Add 5 mL of a 3 h culture (0.600 O.D.) into a 15 mL plastic conical Falcon tube.
Add 1:10 v/v of water saturated phenol pH 7.9 to ice cold 100 % ethanol to 5 mL of culture. (500 μL water saturated phenol and 4.5 mL 100 % ethanol) (see Note 4).
Centrifuge for 10 min at 5,000 × g and 4 °C to pellet the cells.
Aspirate off the supernatant leaving as little medium behind as possible.
At this point, cell pellets maybe snap frozen using dry ice or liquid nitrogen and stored at −80 °C for up to a week.
Start the process of lysing the cells by adding 700 μL Buffer TE, pH 8.0, and transfer to a 1.5 mL sterile microcentrifuge tube.
Add 7 μL of 10 % SDS, invert several times, and put in a 65 °C water bath for 1–2 min to lyse cells.
Add 77 μL of 1 M sodium acetate, pH 5.5, and 850 μL of hot (65 °C) water saturated phenol and invert ten times (see Note 4).
Place the tubes in a 65 °C water bath for 6 min. Invert tubes every 60 s.
Centrifuge 15 min at 4 °C, 18,000 × g.
There will be two apparent phases after centrifugation. Aspirate off the top layer into a new sterile 1.5 mL microcentrifuge tube containing 850 μL 100 % chloroform and invert several times.
Centrifuge 15 min at 4 °C, 18,000 × g.
Pull off the top aqueous layer being careful not to disturb the lower organic layer. Split the aqueous layer that carries the RNA into two sterile 1.5 mL microcentrifuge tubes (see Note 5).
Precipitate the RNA by adding 800 μL of cold ethanol (100 %) and 35 μL of 3 M sodium acetate to each tube.
Place the tubes at −80 °C for at least 2 h (see Note 6).
Centrifuge tubes for 25 min at 4 °C, 18,000 × g.
Decant the supernatant leaving the RNA pellet which should appear as white or translucent (see Note 7).
Wash the RNA pellet by adding 1 mL of cold 80 % ethanol and vortex gently
Centrifuge for 15 min at 4 °C, 18,000 × g.
Repeat ethanol wash steps 18 and 19.
Remove the last ethanol wash carefully and allow the RNA samples to air-dry for 10–15 min and then resuspend the pellets in Nuclease-free water (see Note 8). For our application, the desired RNA concentration is 1–2 μg/μL.
Determine the RNA concentration of the samples using the NanoDrop 1000 (NanoDrop Products, Fisher Thermo Scientific) and store all samples at −80 °C until DNase treatment.
3.3. Assessment of RNA Quality
Isolation of high quality RNA is essential for many downstream applications including generation of cDNA for microarrays and qRT-PCR, making it crucial to assess the RNA integrity prior to investing additional time and resources. A 260/280 ratio of 1.8 or greater indicates the purity of the RNA, but does not address the status of RNA degradation. We assess the quality of RNA samples using the Agilent Bioanalyzer. RNA samples were analyzed with the Agilent RNA 6000 Nano Chip Kit. The Bioanalyzer software generates an RNA Integrity Number (RIN) taking into account any degradation along the entire electropherogram and not just the 16S and 23S ribosomal RNA peaks. As seen in the electropherogram example in Fig. 1, the peaks for 16S and 23S ribosomal RNA are sharp with little degradation. The RIN score for this RNA sample was 9.2. An RIN of 10 is ideal indicating the least amount of degradation. Figure 2 shows an RNA sample with significant degradation. Note the 16S and 23S peaks are one broad peak and the increase in size of the 5S ribosomal RNA peak. The RIN was 4.2 for this sample, however, the 260/280 ratio was 2.0 (see Notes 9 and 10).
Fig. 1.

Electropherogram of RNA isolated from N. gonorrhoeae FA1090 grown in CDM in iron minus conditions. The smallest peak is 5S ribosomal RNA. The peak at 25 nucleotides is the internal sizing standard. nt indicates nucleotide size. FU indicates Fluorescent Units (see Note 10).
Fig. 2.

Electropherogram of RNA isolated from N. gonorrhoeae FA1090 grown in CDM in iron minus conditions showing significant RNA degradation. The peak at 25 nucleotides is the internal sizing standard. nt indicates nucleotide size. FU indicates Fluorescent Units.
3.4. DNase Treatment
Add 1 U of Promega RQ1 RNase-Free DNase to 1 μg total RNA into a sterile 1.5 mL microcentrifuge tube.
Add 1/10 volume RQ1 RNase-Free DNase 10× Reaction Buffer and Nuclease-free water to the appropriate final reaction volume taking into account the volume of the RNA and RQ1 RNase-free DNase (see Note 11).
Incubate the tube in a heat block at 37 °C for 30 min.
Add 1 mL of TriReagent to the tube and proceed to RNA clean-up as detailed in step 5 below (see Note 12).
Add 200 μL chloroform, vortex, and centrifuge 12,000 × g for 15 min, 4 °C.
Carefully pull off the top aqueous layer containing the RNA into a new sterile 1.5 mL microcentrifuge tube.
Precipitate the RNA by adding 250 μL 100 % isopropanol, followed by a 15 min centrifugation at 4 °C, 12,000 × g.
Wash the RNA pellet by adding 1 mL cold 80 % ethanol. Centrifuge at 4 °C for 10 min, 12,000 × g.
Remove the supernatant and allow the pellet to air-dry for 10–15 min to remove any residual ethanol (see Note 8).
Resuspend all pellets in Nuclease-free water and determine the RNA concentration in the samples using the NanoDrop 1000 (NanoDrop Products, Fisher Thermo Scientific) and assess RNA quality as in Subheading 3.3. Store all samples at −80 °C.
3.5. Reverse Transcription and cDNA Labeling
To generate the cDNA, reverse transcribe 10 μg of DNase-treated total RNA in a final volume of 100 μL using Applied Biosystems High-Capacity cDNA Archive Kit (see Note 13):
Prepare the MicroAmp 96-well reaction plate by adding 50 μL of a 2× Reverse Transcription (RT) master mix to the appropriate number of wells. Each 50 μL aliquot of 2× RT master mix contains, from the High-Capacity cDNA Archive Kit: 10 μL 10× RT Buffer, 4 μL 25× 100 μM dNTP, 10 μL Random Primer mix, 5 μL Multiscribe™ Reverse Transcriptase (50 U/μL), 21 μL Nuclease-free water.
Add 50 μL of RNA sample to each well containing the RT master mix and pipet up and down to mix. The 50 μL RNA sample will have 10 μg of DNAse-treated RNA and 1 μL each of the three SpotReport mRNA positive control spikes diluted to 1 ng/μL. Add the appropriate amount of Nuclease-free water to bring the total volume to 50 μL (see Note 14).
Seal the plate with MicroAmp 96-well clear adhesive film. Briefly centrifuge the plate to spin down the contents and remove any air bubbles present.
Set the thermal cycler conditions: 25 °C for 10 min followed by 37 °C for 120 min and load the plate containing the RT reactions. The cDNA is now ready for labeling.
Following the Mirus cDNA labeling protocol, hydrolyze the RNA template by adding 0.3 volumes 0.5 M EDTA and 0.1 volume. Reagent D1 to the completed RT reaction in the 96-well plate.
Set the thermal cycler at 65 °C for 30 min and allow samples to cool to room temperature before continuing to the next step.
Neutralize samples by adding 0.125 volume (according to the original reaction volume) of Neutralization Buffer N1.
Purify the cDNA using QIAquick PCR Purification method. Add 5 volumes of Buffer PB to 1 volume of the biotin-labeled cDNA.
Bind the cDNA to the column by applying the sample to a QIAquick column and spin for 30 s. Discard the flow through (see Note 15).
Wash the column by adding 750 μL Buffer PE (see Note 16) and centrifuge for 30 s. Discard the flow through and centrifuge again for an additional 1 min to remove any residual ethanol.
Place the column in a new 1.5 mL microcentrifuge tube and elute by carefully adding 30 μL of Nuclease-free water directly to the column membrane. Allow the column to set for 1–2 min. Centrifuge the column for 2 min.
Measure the cDNA concentration on the NanoDrop 1000, choosing ssDNA-33 as sample type.
Label 3 μg of purified cDNA in a 100 μL reaction volume according to the Mirus kit protocol: in a sterile 0.5 μL micro-centrifuge tube, add the appropriate volume of cDNA sample up to 86 μL, 10 μL 10× Labeling Buffer and Nuclease-free water to bring the volume to 96 μL, then add 4 μL Label IT μ Array Biotin Reagent (see Note 17).
Incubate the labeling mixture at 37 °C for 1 h in a heat block.
Add 0.1 volume Reagent D1 and incubate at room temperature for 5 min, followed by addition of 0.1 volume Neutralization Buffer N1, incubate on ice for 5 min.
Clean up the biotin-labeled cDNA using the QIAquick PCR Purification method as described previously in steps 9–13. The biotin-labeled cDNA is now ready to proceed to hybridization (see Note 18).
3.6. CombiMatrix Arrays: Hybridization and Data Collection
Our laboratory focuses on iron regulation in the human pathogen N. gonorrhoeae. We are currently interested in the role small RNAs play in the gonococcal iron regulon by assessing the global transcriptional profile in iron minus and iron plus growth conditions. Our custom 12K gene expression array was designed by CombiMatrix’s bioinformatics team. The in situ technology uses an electrochemical process to synthesize probes/features (30–40-mers) directly onto the chip. Included in the custom array are factory-built negative controls and “no-synthesis” (quality controls) positioned in areas throughout the chip. A. thaliana genes were added as positive controls. We also included intergenic regions meeting bioinformatic criteria for small RNA expression. These intergenic features were designed for both the sense and antisense strands. If possible, all annotated genes had five to six features spanning the entire open reading frame. Figure 3 shows a typical gonococcal gene expression microarray. Each feature is visually represented as a square. Since the ElectraSense is an electrochemical detection method, the read out will be a direct numeric quantification of the hybridization signal. Grid alignment or spot finding is not necessary.
Fig. 3.
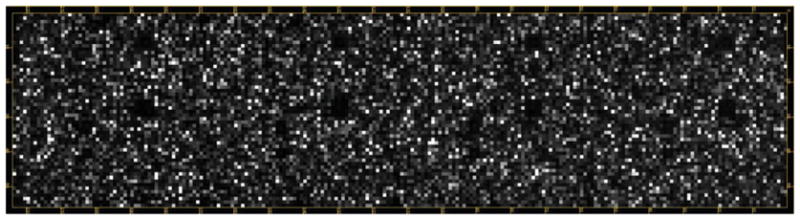
Biotinylated cDNA from N. gonorrhoeae FA1090 grown in CDM in iron minus conditions was hybridized to a 12K CombiMatrix ElectraSense™ CustomArray. The array was scanned and electrochemical detection read on the CombiMatrix ElectraSense™ reader. Signal intensity values and annotation information for each feature were exported for analysis in GeneSpring GX 11.
Place the array in the 12K ElectraSense hybridization chamber, add Nuclease-free water, and incubate at 65 °C for 10 min. Unless otherwise stated, all arrays are rotated during incubations using the custom array holders for the rotisserie. After the 65 °C incubation step, bring the hybridization chamber to room temperature and refill with Pre-Hybridization Buffer. Incubate at 50 °C for 30 min.
Denature the hybridization solution containing the biotin-labeled cDNA by heating for 3 min at 95 °C and 1 min on ice.
Add the denatured biotin-labeled cDNA to the hybridization chamber and incubate for 16 h at 50 °C.
Rinse the array by filling the hybridization chamber with 3× SSPET pre-warmed to 50 °C. Pull off the rinse, add fresh 3× SSPET, and incubate for 5 min.
Rinse the array with 0.5× SSPET and again add fresh 0.5× SSPET and incubate at room temperature. All room temperature steps are done on the bench top.
Rinse the hybridization chamber with PBST Wash Solution and refill the chamber. Incubate at room temperature for 2 min. The array is now ready for post-hybridization labeling. Bring the ElectraSense Detection Kit™ to room temperature.
Remove the PBST Wash Solution and add the Blocking Buffer from the ElectraSense Detection Kit. Incubate at room temperature for 15 min.
Remove the Blocking Buffer and add the Biotin Labeling Solution to the hybridization chamber. Incubate at room temperature for 30 min.
Rinse the hybridization chamber with Biotin Wash Solution and refill with the Wash Solution. Incubate for 5 min at room temperature.
Repeat the Biotin Wash Solution step two more times.
Remove the Biotin Wash Solution and rinse with TMB Rinse Solution of the ElectraSense detection kit. Quickly remove the TMB Rinse Solution and add TMB Substrate Solution of the ElectraSense detection kit.
Place the hybridization chamber in the ElectraSense reader and scan the array within 1 min. Arrays can be rescanned by taking out the TMB Substrate Solution, rinsing first with Biotin Wash and then with TMB Rinse Solution before adding fresh TMB Substrate (see Note 19).
4. Notes
Isolation of RNA requires the researcher to take precautions to minimize the introduction of nucleases by treating the bench-top, pipettes, and any equipment with commercial products that eliminate RNases. We routinely use RNaseZap RNase Decontamination Solution. RNase-free buffers and reagents are available from Ambion. Gloves must always be worn to prevent contamination from nucleases present on the skin. Equally important is the use of barrier pipette tips. All dilutions of stock solutions listed in the Subheading 2 were done with Nuclease-free water.
Surfaces and equipment are decontaminated by spraying RNaseZap followed by rinsing with Nuclease-free water.
Nuclease-free microcentrifuge tubes are available through Ambion. In our experience, sterilizing the microcentrifuge tubes by autoclaving is a cost-efficient alternative.
Ensure that the water-saturated phenol is mixed well prior to use. The aqueous layer will separate out quickly.
We find it advantageous to leave a small amount of the aqueous layer to prevent DNA and protein contamination, however; if the RNA quantity will be low, recover as much of the aqueous layer as possible.
2 h is the minimum time to precipitate the RNA. We typically leave RNA samples overnight at −80 °C to increase RNA yields.
If the RNA pellet does not adhere to the side of the tube after centrifugation, aspirate off the supernatant being careful not to disturb the RNA pellet.
Remove any residual ethanol from the sides of the tube with a pipette. We find it easier to remove small drops of ethanol using 10 μL barrier pipette tips. Do not overdry the RNA pellet as this makes the RNA less soluble.
An RIN number of 8.5 or greater generally indicates good quality RNA with modest degradation; however, this number will vary for different cells and/or tissues and different experimental conditions. Lower RIN values are acceptable if the downstream application is tested and validated by other methods.
The 5S ribosomal peak will not be present if using Qiagen RNeasy columns to isolate the RNA. Nucleic acids smaller than 200 bp pass through the column. Many microarrays are now designed to detect small RNAs transcripts and may be missed using a column.
The following is an example of a 100 μL DNase treatment reaction using Promega DNase; 25 μL RNA at a concentration of 2.0 μg/μL, 10 μL RQ1 RNase-Free DNase 10× Reaction Buffer, 50 μL RQ1 RNase-Free DNase (1 U/μL), 15 μL Nuclease-free water.
Total volume of the DNase reaction to which 1 mL of Tri Reagent is added should not exceed 200 μL.
The following is an example of a 100 μL RT reaction using the High-Capacity cDNA Archive Kit (Applied Biosystems) with an RNA sample at a concentration of 2.0 μg/μL; 10 μL 10× RT Buffer, 4 μl 25× dNTP, 10 μL Random Primers, 5 μL Multiscribe™ Reverse Transcriptase (50 U/μL), 5 μL DNase-treated RNA (2.0 μg/μL), 1 μL SpotReport® mRNA Spike 1 (1 ng/μL), 1 μL SpotReport® mRNA Spike 2 (1 ng/μL), 1 μL SpotReport® mRNA Spike 3 (1 ng/μL), 63μL Nuclease-free water.
All reagents and 96-well plates should be placed on ice when adding RT master mix and RNA samples.
All steps in purification process of the biotinylated cDNA and centrifugation (14,000×g) are done at room temperature.
Ensure that the appropriate amount of 100 % ethanol has been added to the Buffer PE.
The micrograms of cDNA that are biotin-labeled should be empirically determined for each organism and/or sets of experimental conditions. We found that 3 μg of biotin-labeled cDNA gave an optimal hybridization signal on our custom array.
We have used biotin-labeled cDNA that was stored at −20 °C for up to 2 days on our arrays without significant loss of signal.
A common scan error message is failure of some of the electrodes to read. This is usually the result of the electrical contact pads on the array slide not being clean. When this occurs, the contacts are cleaned and the hybridization chamber is washed first with Biotin Wash and then TMB Biotin Rinse, followed by fresh TMB substrate, and the slide rescanned. The ElectraSense arrays have the advantage of being able to be scanned multiple times, but in our hands most arrays were scanned at least twice and occasionally three to four times to get a good read.
References
- 1.Jackson LJ, Ducey TF, Day MW, Zaitshik JB, Orvis J, Dyer DW. Transcriptional and functional analysis of the Neisseria gonorrhoeae Fur regulon. J Bacteriol. 2010;192:77–85. doi: 10.1128/JB.00741-09. [DOI] [PMC free article] [PubMed] [Google Scholar]
- 2.Folster JP, Johnson PJ, Jackson L, Dhulipali V, Dyer DW, Shafer WM. MtrR modulates rpoH expression and levels of antimicrobial resistance in Neisseria gonorrhoeae. J Bacteriol. 2009;191:287–297. doi: 10.1128/JB.01165-08. [DOI] [PMC free article] [PubMed] [Google Scholar]
- 3.Metruccio MM, Fantappie L, Serruto D, Muzzi A, Roncarati D, Donati C, Scarlato V, Delany I. The Hfq-dependent small noncoding RNA NrrF directly mediates Fur-dependent positive regulation of succinate dehydrogenase in Neisseria meningitidis. J Bacteriol. 2009;191:1330–1342. doi: 10.1128/JB.00849-08. [DOI] [PMC free article] [PubMed] [Google Scholar]
- 4.Agarwal S, Sebastian S, Szmigielski B, Rice PA, Genco CA. Expression of the gonococcal global regulatory protein Fur and genes encompassing the Fur and iron regulon during in vitro and in vivo infection in women. J Bacteriol. 2008;190:3129–3139. doi: 10.1128/JB.01830-07. [DOI] [PMC free article] [PubMed] [Google Scholar]
- 5.Heurlier K, Thomson MJ, Aziz N, Moir JW. The nitric oxide (NO)-sensing repressor NsrR of Neisseria meningitidis has a compact regulon of genes involved in NO synthesis and detoxification. J Bacteriol. 2008;190:2488–2495. doi: 10.1128/JB.01869-07. [DOI] [PMC free article] [PubMed] [Google Scholar]
- 6.Whitehead RN, Overton TW, Snyder LA, McGowan SJ, Smith H, Cole JA, Saunders NJ. The small FNR regulon of Neisseria gonorrhoeae: comparison with the larger Escherichia coli FNR regulon and interaction with the NarQ-NarP regulon. BMC Genomics. 2007;8:35. doi: 10.1186/1471-2164-8-35. [DOI] [PMC free article] [PubMed] [Google Scholar]
- 7.Seib KL, Wu HJ, Srikhanta YN, Edwards JL, Falsetta ML, Hamilton AJ, Maguire TL, Grimmond SM, Apicella MA, McEwan AG, Jennings MP. Characterization of the OxyR regulon of Neisseria gonorrhoeae. Mol Microbiol. 2007;63:54–68. doi: 10.1111/j.1365-2958.2006.05478.x. [DOI] [PubMed] [Google Scholar]
- 8.Stohl EA, Seifert HS. Neisseria gonorrhoeae DNA recombination and repair enzymes protect against oxidative damage caused by hydrogen peroxide. J Bacteriol. 2006;188:7645–7651. doi: 10.1128/JB.00801-06. [DOI] [PMC free article] [PubMed] [Google Scholar]
- 9.Shaik YB, Grogan S, Davey M, Sebastian S, Goswami S, Szmigielski B, Genco CA. Expression of the iron-activated nspA and secY genes in Neisseria meningitidis group B by Fur-dependent and -independent mechanisms. J Bacteriol. 2007;189:663–669. doi: 10.1128/JB.01638-06. [DOI] [PMC free article] [PubMed] [Google Scholar]
- 10.Overton TW, Whitehead R, Li Y, Snyder LA, Saunders NJ, Smith H, Cole JA. Coordinated regulation of the Neisseria gonorrhoeae-truncated denitrification pathway by the nitric oxide-sensitive repressor, NsrR, and nitrite-insensitive NarQ-NarP. J Biol Chem. 2006;281:33115–33126. doi: 10.1074/jbc.M607056200. [DOI] [PubMed] [Google Scholar]
- 11.Grifantini R, Sebastian S, Frigimelica E, Draghi M, Bartolini E, Muzzi A, Rappuoli R, Grandi G, Genco CA. Identification of iron-activated and -repressed Fur-dependent genes by transcriptome analysis of Neisseria meningitidis group B. Proc Natl Acad Sci U S A. 2003;100:9542–9547. doi: 10.1073/pnas.1033001100. [DOI] [PMC free article] [PubMed] [Google Scholar]
- 12.Grifantini R, Frigimelica E, Delany I, Bartolini E, Giovinazzi S, Balloni S, Agarwal S, Galli G, Genco C, Grandi G. Characterization of a novel Neisseria meningitidis Fur and iron-regulated operon required for protection from oxidative stress: utility of DNA microarray in the assignment of the biological role of hypothetical genes. Mol Microbiol. 2004;54:962–979. doi: 10.1111/j.1365-2958.2004.04315.x. [DOI] [PubMed] [Google Scholar]
- 13.Ducey TF, Carson MB, Orvis J, Stintzi AP, Dyer DW. Identification of the iron-responsive genes of Neisseria gonorrhoeae by microarray analysis in defined medium. J Bacteriol. 2005;187:4865–4874. doi: 10.1128/JB.187.14.4865-4874.2005. [DOI] [PMC free article] [PubMed] [Google Scholar]
- 14.Bartolini E, Frigimelica E, Giovinazzi S, Galli G, Shaik Y, Genco C, Welsch JA, Granoff DM, Grandi G, Grifantini R. Role of FNR and FNR-regulated, sugar fermentation genes in Neisseria meningitidis infection. Mol Microbiol. 2006;60:963–972. doi: 10.1111/j.1365-2958.2006.05163.x. [DOI] [PMC free article] [PubMed] [Google Scholar]
- 15.Gunesekere IC, Kahler CM, Ryan CS, Snyder LA, Saunders NJ, Rood JI, Davies JK. Ecf, an alternative sigma factor from Neisseria gonorrhoeae, controls expression of msrAB, which encodes methionine sulfoxide reductase. J Bacteriol. 2006;188:3463–3469. doi: 10.1128/JB.188.10.3463-3469.2006. [DOI] [PMC free article] [PubMed] [Google Scholar]
- 16.Wu HJ, Seib KL, Srikhanta YN, Kidd SP, Edwards JL, Maguire TL, Grimmond SM, Apicella MA, McEwan AG, Jennings MP. PerR controls Mn-dependent resistance to oxidative stress in Neisseria gonorrhoeae. Mol Microbiol. 2006;60:401–416. doi: 10.1111/j.1365-2958.2006.05079.x. [DOI] [PubMed] [Google Scholar]
- 17.Srikhanta YN, Dowideit SJ, Edwards JL, Falsetta ML, Wu HJ, Harrison OB, Fox KL, Seib KL, Maguire TL, Wang AH, Maiden MC, Grimmond SM, Apicella MA, Jennings MP. Phasevarions mediate random switching of gene expression in pathogenic Neisseria. PLoS Pathog. 2009;5:e1000400. doi: 10.1371/journal.ppat.1000400. [DOI] [PMC free article] [PubMed] [Google Scholar]
- 18.Dietrich M, Munke R, Gottschald M, Ziska E, Boettcher JP, Mollenkopf H, Friedrich A. The effect of hfq on global gene expression and virulence in Neisseria gonorrhoeae. FEBS J. 2009;276:5507–5520. doi: 10.1111/j.1742-4658.2009.07234.x. [DOI] [PubMed] [Google Scholar]
- 19.Peng J, Zhang X, Shao Z, Yang L, Jin Q. Characterization of a new Neisseria meningitidis serogroup C clone from China. Scand J Infect Dis. 2008;40:63–66. doi: 10.1080/00365540701403010. [DOI] [PubMed] [Google Scholar]
- 20.Peng J, Zhang X, Yang E, Wang J, Yang J, Shao Z, Jin Q. Characterization of serogroup C meningococci isolated from 14 provinces of China during 1966–2005 using comparative genomic hybridization. Sci China C Life Sci. 2007;50:1–6. doi: 10.1007/s11427-007-0016-2. [DOI] [PubMed] [Google Scholar]
- 21.Dunning Hotopp JC, Grifantini R, Kumar N, Tzeng YL, Fouts D, Frigimelica E, Draghi M, Giuliani MM, Rappuoli R, Stephens DS, Grandi G, Tettelin H. Comparative genomics of Neisseria meningitidis: core genome, islands of horizontal transfer and pathogen-specific genes. Microbiology. 2006;152:3733–3749. doi: 10.1099/mic.0.29261-0. [DOI] [PubMed] [Google Scholar]
- 22.Snyder LA, Saunders NJ. The majority of genes in the pathogenic Neisseria species are present in non-pathogenic Neisseria lactamica, including those designated as “virulence genes”. BMC Genomics. 2006;7:128. doi: 10.1186/1471-2164-7-128. [DOI] [PMC free article] [PubMed] [Google Scholar]
- 23.Snyder LA, Davies JK, Saunders NJ. Microarray genomotyping of key experimental strains of Neisseria gonorrhoeae reveals gene complement diversity and five new neisserial genes associated with Minimal Mobile Elements. BMC Genomics. 2004;5:23. doi: 10.1186/1471-2164-5-23. [DOI] [PMC free article] [PubMed] [Google Scholar]
- 24.Stabler RA, Marsden GL, Witney AA, Li Y, Bentley SD, Tang CM, Hinds J. Identification of pathogen-specific genes through microarray analysis of pathogenic and commensal Neisseria species. Microbiology. 2005;151:2907–2922. doi: 10.1099/mic.0.28099-0. [DOI] [PubMed] [Google Scholar]
- 25.Snyder LA, Jarvis SA, Saunders NJ. Complete and variant forms of the “gonococcal genetic island” in Neisseria meningitidis. Microbiology. 2005;151:4005–4013. doi: 10.1099/mic.0.27925-0. [DOI] [PubMed] [Google Scholar]
- 26.Corless CE, Kaczmarski E, Borrow R, Guiver M. Molecular characterization of Neisseria meningitidis isolates using a resequencing DNA microarray. J Mol Diagn. 2008;10:265–271. doi: 10.2353/jmoldx.2008.070152. [DOI] [PMC free article] [PubMed] [Google Scholar]
- 27.Swiderek H, Claus H, Frosch M, Vogel U. Evaluation of custom-made DNA microarrays for multilocus sequence typing of Neisseria meningitidis. Int J Med Microbiol. 2005;295:39–45. doi: 10.1016/j.ijmm.2004.12.005. [DOI] [PubMed] [Google Scholar]
- 28.Grifantini R, Bartolini E, Muzzi A, Draghi M, Frigimelica E, Berger J, Ratti G, Petracca R, Galli G, Agnusdei M, Giuliani MM, Santini L, Brunelli B, Tettelin H, Rappuoli R, Randazzo F, Grandi G. Previously unrecognized vaccine candidates against group B meningococcus identified by DNA microarrays. Nat Biotechnol. 2002;20:914–921. doi: 10.1038/nbt728. [DOI] [PubMed] [Google Scholar]
- 29.Grifantini R, Bartolini E, Muzzi A, Draghi M, Frigimelica E, Berger J, Randazzo F, Grandi G. Gene expression profile in Neisseria meningitidis and Neisseria lactamica upon host-cell contact: from basic research to vaccine development. Ann N Y Acad Sci. 2002;975:202–216. doi: 10.1111/j.1749-6632.2002.tb05953.x. [DOI] [PubMed] [Google Scholar]
- 30.Booth SA, Drebot MA, Martin IE, Ng LK. Design of oligonucleotide arrays to detect point mutations: molecular typing of antibiotic resistant strains of Neisseria gonorrhoeae and hantavirus infected deer mice. Mol Cell Probes. 2003;17:77–84. doi: 10.1016/s0890-8508(03)00005-7. [DOI] [PubMed] [Google Scholar]
- 31.Shi G, Wen SY, Chen SH, Wang SQ. Fabrication and optimization of the multiplex PCR-based oligonucleotide microarray for detection of Neisseria gonorrhoeae, Chlamydia trachomatis and Ureaplasma urealyticum. J Microbiol Methods. 2005;62:245–256. doi: 10.1016/j.mimet.2005.02.017. [DOI] [PubMed] [Google Scholar]
- 32.Andresen D, von Nickisch-Rosenegk M, Bier FF. Helicase dependent OnChip-amplification and its use in multiplex pathogen detection. Clin Chim Acta. 2009;403:244–248. doi: 10.1016/j.cca.2009.03.021. [DOI] [PubMed] [Google Scholar]
- 33.Wells DB, Tighe PJ, Wooldridge KG, Robinson K, Ala’Aldeen DA. Differential gene expression during meningeal-meningococcal interaction: evidence for self-defense and early release of cytokines and chemokines. Infect Immun. 2001;69:2718–2722. doi: 10.1128/IAI.69.4.2718-2722.2001. [DOI] [PMC free article] [PubMed] [Google Scholar]
- 34.Binnicker MJ, Williams RD, Apicella MA. Infection of human urethral epithelium with Neisseria gonorrhoeae elicits an upregulation of host anti-apoptotic factors and protects cells from staurosporine-induced apoptosis. Cell Microbiol. 2003;5:549–560. doi: 10.1046/j.1462-5822.2003.00300.x. [DOI] [PubMed] [Google Scholar]
- 35.Bonnah RA, Muckenthaler MU, Carlson H, Minana B, Enns CA, Hentze MW, So M. Expression of epithelial cell iron-related genes upon infection by Neisseria meningitidis. Cell Microbiol. 2004;6:473–484. doi: 10.1111/j.1462-5822.2004.00376.x. [DOI] [PubMed] [Google Scholar]
- 36.Muenzner P, Rohde M, Kneitz S, Hauck CR. CEACAM engagement by human pathogens enhances cell adhesion and counteracts bacteria-induced detachment of epithelial cells. J Cell Biol. 2005;170:825–836. doi: 10.1083/jcb.200412151. [DOI] [PMC free article] [PubMed] [Google Scholar]
- 37.Ovstebo R, Olstad OK, Brusletto B, Moller AS, Aase A, Haug KB, Brandtzaeg P, Kierulf P. Identification of genes particularly sensitive to lipopolysaccharide (LPS) in human monocytes induced by wild-type versus LPS-deficient Neisseria meningitidis strains. Infect Immun. 2008;76:2685–2695. doi: 10.1128/IAI.01625-07. [DOI] [PMC free article] [PubMed] [Google Scholar]
- 38.Schubert-Unkmeir A, Schramm-Gluck A, Frosch M, Schoen C. Transcriptome analyses in the interaction of Neisseria meningitidis with mammalian host cells. Methods Mol Biol. 2009;470:5–27. doi: 10.1007/978-1-59745-204-5_2. [DOI] [PubMed] [Google Scholar]
- 39.Schubert-Unkmeir A, Slanina H, Frosch M. Mammalian cell transcriptome in response to meningitis-causing pathogens. Expert Rev Mol Diagn. 2009;9:833–842. doi: 10.1586/erm.09.68. [DOI] [PubMed] [Google Scholar]