Abstract
Isobaric labeling strategies for mass spectrometry-based proteomics enable multiplexed simultaneous quantification of samples and therefore substantially increase the sample throughput in proteomics. However, despite these benefits, current limits to multiplexing capacity are prohibitive for large sample sizes and impose limitations on experimental design. Here, we introduce a novel mechanism for increasing the multiplexing density of isobaric reagents. We present Combinatorial Isobaric Mass Tags (CMTs), an isobaric labeling architecture with the unique ability to generate multiple series of reporter ions simultaneously. We demonstrate that utilization of multiple reporter ion series improves multiplexing capacity of CMT with respect to a commercially available isobaric labeling reagent with preserved quantitative accuracy and depth of coverage in complex mixtures. We provide a blueprint for the realization of 16-plex reagents with 1 Da spacing between reporter ions and up to 28-plex at 6 mDa spacing using only 5 heavy isotopes per reagent. We anticipate that this improvement in multiplexing capacity will further advance the application of quantitative proteomics, particularly in high-throughput screening assays.
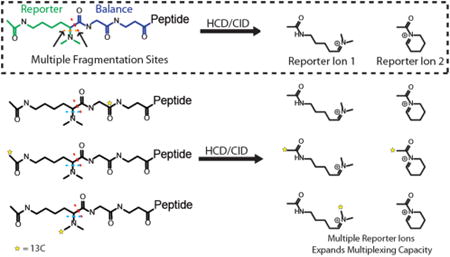
In the past decade, instrumentation and methodological improvements have allowed mass spectrometry (MS)-based proteomics to significantly mature, enabling identification of entire proteomes and their post-translational modifications at ever increasing depths of coverage.1–3 The field of quantitative MS-based proteomics has experienced parallel technological and methodological gains and has emerged as an indispensable technique for interrogating the proteome-level mechanisms underlying phenotypic differences.
In recent years, isobaric labeling4–6 has emerged as an important technique in quantitative mass spectrometry with incredibly powerful and far-ranging applications in areas such as drug target identification,7 biomarker discovery,8 and temporal regulation of proteome dynamics.9 While isobaric labeling has been established as an accurate, reliable, and sensitive quantitative technique,10,11 there is a definitive need for improvement in isobaric multiplexing capacity. The 10-fold multiplexing of current isobaric labeling reagents10 limits experimental design when replicates are required for statistical significance or when sample sizes are large. Splitting samples across multiple mass spectrometry experiments is undesirable due to imperfect overlap in peptide identifications associated with shotgun sequencing methods,8,10 which makes quantitative comparisons across multiple experiments challenging.
Multiple alternatives to commercial isobaric labeling reagents have been suggested, including CIT,12 Aqc,13 DiART,14,15 and DiLeu16,17 tags, as well as hybrid strategies combining isobaric reagents with other quantitative mass spectrometry techniques. While reagents capable of 12-plex,16 18-plex,18 and even 54-plex19 multiplexing have been reported, these reagent sets fail to preserve chromatographic unity across all labeled samples and, in some cases, require multiple reagent subsets with distinct isobaric masses. Only two strategies have been proposed for increasing the multiplexing capacity of truly isobaric and chromatographically identical reagent sets. Of these, increasing isobaric reagent size is the simplest approach.20 However, increasing tag size has been shown to be detrimental to depth of proteome coverage,21 most likely due to effects of the larger reagent on either chromatography, ionization, or fragmentation of labeled peptides. Commercial 10-plexing is achieved through clever application of the mass defect arising from differences in the 12C/13C and 14N/15N transitions.22,23 While this approach effectively doubles multiplexing density for a given number of isotopes per tag, current reporter ion structures do not support further exploitation of this effect.
Here, we report a novel isobaric labeling architecture termed Combinatorial Isobaric Mass Tags (CMTs) that enables a unique method for increasing the multiplexing density and capacity of isobaric reagents (Figure 1). The reporter ion liberated from this new tag structure uniquely undergoes spontaneous fragmentation to generate multiple sets of reporter ions that can each be used to obtain quantitative information. The mass shift of each reporter fragment is dependent on both the number of isotopes, and their placement, within the reporter region of the tag molecule (Figure 1D). This dual dependence on both the number and the position of isotopes within the reporter region of the molecule increases the number of unique isobaric labels that can be generated for a given number of isotopes present in the isobaric tag. The resulting reagents have the potential for several fold improvement in multiplexing capacity over current methods.
Figure 1.
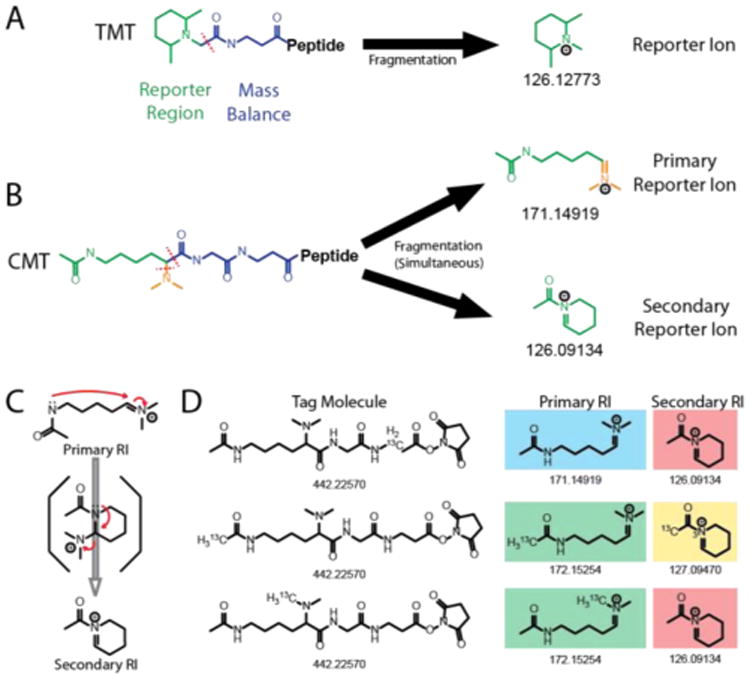
CMT approach generates multiples reporter ion series for increased quantitative information. (A) Chemical structure of TMT (Proteome Sciences, plc), a commercial isobaric labeling reagent and the reporter ion generated upon TMT fragmentation. (B) CMT isobaric labeling reagents fragment at more than one position (denoted by red lines) under both CID and HCD conditions. In contrast to TMT, CMT reagents generate multiple reporter ions, first fragmenting into a primary reporter ion series with a range of molecular masses beginning at 171.14919 Da, which can further fragment into a secondary reporter ion series with molecular masses beginning at 126.09134 Da. (C) CMT secondary reporter ion formation occurs via cyclization of the primary reporter ion region and subsequent loss of dimethylamine. (D) The generation of unique primary/secondary reporter ion pairs enables increased multiplexing by enabling the coding of both the number of heavy isotopes in the reporter region of the reagent, and their position within the reporter region such that unique reporter ion pairs distinguish each reagent.
Experimental Section
Reagents
Aloc-Lys(Fmoc)-OH was obtained from Advanced Chemtech. Fmoc-β-Ala-Wang resin (RFX-1344-PI) was from Peptides International. 1-[Bis(dimethylamino)-methylene]-1H-1,2,3-triazolo[4,5-b]pyridinium 3-oxid hexa-fluorophosphate (HATU) was purchased from Accela Chembio Inc. Dimethylformamide (DMF) and dichloromethane (DCM) were obtained from VWR. All other reagents were obtained from Sigma-Aldrich. All reagents were used without further purification. Mouse liver samples were obtained from The Jackson Laboratory.
Fmoc-Gly-OH Synthesis
Glycine-1-13C-OH, glycine-13C2-OH, and glycine-13C215N-OH were Fmoc-protected using Fmoc-chloride according to the method of Cruz and co-workers.24
CMT Synthesis
Isobaric tags were synthesized via solid phase synthesis (Wang Resin), using a combination of automated and manual methods and standard Fmoc/HATU coupling protocols. Automation was achieved with a Symphony X peptide synthesizer (Protein Technologies Inc.). For further details, please see Supporting Information, Supplemental Methods.
Peptide Labeling
To peptide solutions in 0.1 M EPPS (pH 8.0) was added 4 equiv by weight of NHS activated tag (10 μg/μL in anydrous acetonitrile). Labeling reactions were incubated for 2 h at room temperature, quenched with 5% hydroxylamine (0.5% final) for 15 min, and finally, 0.1% TFA was added to adjust the pH to 2.5. Samples were desalted via C18 STAGE tips.
Labeled samples were separated on a fused silica column packed in-house with C18 resin using an Easy-nLC 1000 UHPLC (Thermo Fisher Scientific) and analyzed on an Orbitrap Fusion, or a Q Exactive mass spectrometer (Thermo Fisher Scientific), operating in data-dependent mode. For Orbitrap Fusion experiments, MS3 spectra25 were acquired using a multinotch MS3 strategy11 and HCD fragmentation using an activation energy of 30 for CMT experiments, and 50 for TMT experiments. For Q-Exactive experiments, stepwise HCD activation at energy equal to 20, 35, and 30 were performed for CMT experiments, and 25, 30, and 40 for TMT experiments.
Data Analysis
All LC-MS data were searched against a target-decoy database26 using the SEQUEST algorithm on a software platform developed in-house. Peptide spectral matches (PSM) were filtered to a false discovery rate (FDR) of 1% using linear discriminant analysis.2 The filtered peptide list was subsequently collapsed to a final protein-level FDR of 2%. The principles of parsimony were used to guide protein assembly. Unless otherwise specified, for peptide and protein quantification, all spectra were discarded if they did not meet summed reporter ion intensity threshold of 200 (TMT) or 233 (CMT) such that average signal/noise ratio per reporter ion were the same between the two systems. An isolation specificity filter was used for quantitative analysis,27 where PSMs were discarded for which at least 80% of the signal in the MS2 isolation window did not derive from the precursor of interest. For mouse experiments, quantitative data was normalized such that the sum signal/noise across all proteins was equal for each isobaric tag. For hierarchical clustering and principle component analysis, reporter ion intensities were further normalized within proteins such that the total sum signal/ noise per protein was equal to 100. This enabled direct comparison between CMT and TMT data sets. Hierarchical clustering (Ward method) and principle component analysis were performed using the statistical analysis software JMP 11 Pro.
Reporter Ion Deconvolution
All reporter ion signal deconvolution was achieved algebraically through application of the system of linear equations presented in Figure 2C. Isotopic envelopes for the reporter ions generated by each CMT tag were experimentally determined by analyzing samples labeled individually with each tag and extracting reporter ion intensities. Isotopic envelopes were defined as the median intensities of all reporter ion intensities observed within a 2 Da range on either side of the predominant primary and secondary reporter ions for each tag. A command line application written in C++ parses the peak data and deconvolutes each spectrum where the fractional contribution of each tag is calculated from the peak heights of reporter ions, and these values are then scaled with the total peak intensity to produce the intensity of each tag. The tag intensities are adjusted for isotopoc impurities with a three-step iterative method: First, the tag intensities are calculated, then the fraction of spillover in the reporter ions is estimated from the tags using user-provided values for isotopic impurities, and finally, the original peak heights are adjusted by this amount. This process is repeated until the tag intensities do not change or a maximum number of iterations (20) is reached. Finally, converged deconvoluted RI intensities were normalized with respect to the known fraction of the monoisotopic peak for each tag. Signal-to-noise values were extracted from RAW files for the most intense peak produced by the tag. For additional discussion of reporter ion deconvolution, see the Supporting Information.
Figure 2.
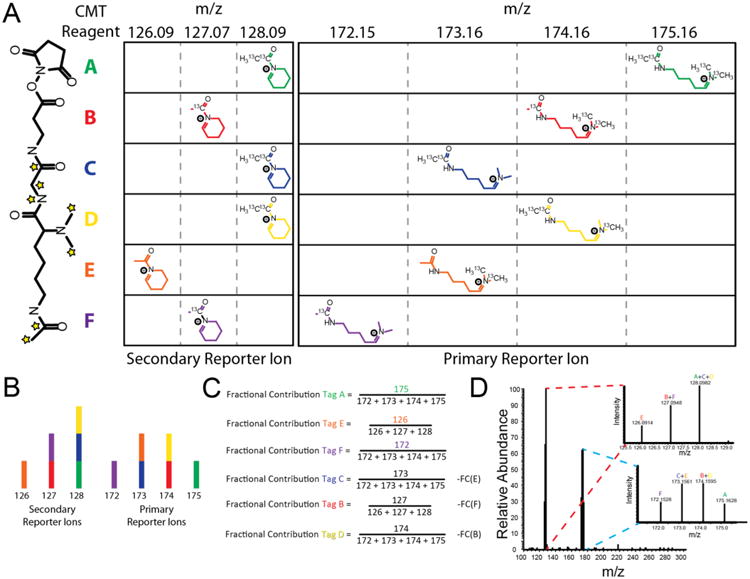
Structure and reporter ion deconvolution for a CMT sixplex isobaric labeling reagent set. (A) (Left) CMT NHS activated ester structure. Stars indicate all positions where heavy isotopes are incorporated across any of the 6-plex reagents A–F. (Right) Primary and secondary reporter ion structures and masses of the CMT 6-plex reagents used in this study. Individual 6-plex reagents are denoted with the letters A–F. While multiple reagents share overlapping reporter ions, each of A–F can be distinguished by their unique combinations of primary and secondary reporter ions. (B) Expected reporter ion intensities of a sample mixed with equal amounts of CMT 6-plex reagents A–F. Both the primary and the secondary reporter ion series contain 100% of the sample mixing information. Colors correspond to those used in (A). (C) The fraction of the reporter ion intensity originating from each CMT 6-plex reagents A–F is calculated from a series of linear equations. (D) Actual mass spectrum of reporter ion distribution of a 1:1:1:1:1:1 mixture of a CMT 6-plex labeled peptide.
Safety Considerations
For reagent synthesis, proper personal protective equipment includes a flame-resistant lab coat, nitrile gloves, and standard protective glasses. In general, all reagent solutions should be prepared in a chemical fume hood, and all manual steps in the solid phase synthesis should be conducted in the hood. In particular, methyl 4-nitrobenzenesulfonate is a strong methylation reagent and should be handled with care in the hood. It is important that resin cleavage and evaporation of cleavage buffer also be conducted in a properly ventilated chemical hood. The reductive methylation reaction evolves cyanide gas in an exothermic reaction. It is therefore crucial that this reaction be conducted in the fume hood, that the sodium cyanoborohydride is added dropwise, and that the reaction is properly quenched when complete. Prior to handling any reagents listed in this protocol, the user should familiarize themselves with the relevant Material Safety Data Sheets.
Results
Synthesis of CMT Reagents
Our initial motivation behind developing in-house isobaric reagents originated from a desire for having relatively easy and fast access to customizable tags for specialized workflows. In accordance with this, we sought to leverage the wide availability of amino acid isotopomers and the multitude of established methods for solid phase synthesis and modification of peptide oligomers. We reasoned that a small number of amino acid building blocks, combined with derivatization by relatively inexpensive isotopologues of acetic acid and formaldehyde would enable the rapid synthesis of a set of isobaric reagents in a relatively simple and potentially automated procedure. This led us to the synthetic scheme outlined in Figure S1. Preloaded Fmoc-βAla Wang resin was coupled first to Fmoc-glycine, followed by one of two orthogonally protected versions of lysine, and subsequent lysine epsilon amine acylation using standard Fmoc/HATU deprotection and coupling protocols on an automated peptide synthesizer. Depending on the methylation state of the final product, resins were either cleaved with TFA or monomethylated according to the methods of Miller28 and Biron29 prior to cleavage from the resin. Cleaved compounds were reductively methylated, and reacted with N,N′-disuccinimidyl carbonate to obtain the NHS activated esters. We achieved yields of 77% (260 μmol scale) and 87% (225 μmol scale) of CMT free acid for the homo- and heterodimethylation synthetic routes based on Fmoc-βAla resin loading using this protocol.
Fragmentation Characteristics of CMT Reagents
To test the performance of CMT reagents for reporter ion (RI) based quantification, we first labeled yeast whole cell lysate (YWCL) tryptic digest and analyzed reporter ion fragmentation via nano-LC-MS/MS. Unexpectedly, in addition to the predicted reporter ion series corresponding to fragmentation of the lysine α/β bond, we observed a second ion arising from cyclization of the expected RI and loss of dimethylamine (Figure 1B). We reasoned that the information contained in this secondary reporter ion series could be used to extract quantitative information from multiple tags with the same primary reporter ion isotope composition (Figure 1D). To evaluate this strategy, we synthesized a 6-plex CMT reagent set (Figure 2A) with two series of overlapping reporter ions (Figure 2). To deconvolute the contributions of each tag in the presence of overlapping reporter ions, we developed a system of linear equations (Figure 2C). Since these equations scale with increasing amounts of isotopes per tag, this combinatorial reporter ion strategy has the potential to significantly increase multiplexing density.
Before evaluating the effectiveness of the CMT approach, we first analyzed the fragmentation characteristics of labeled YWCL peptides by surveying HCD collision energy (CE) on an Orbitrap Fusion instrument. We demonstrated that CMT labeled samples generate robust reporter ion signal over a range of CE, with median combined (primary + secondary RI) signal intensity observed to be maximal at a CE 30 (Figure S3A). We also found that secondary reporter ion intensity increased with increasing collision energy (Figure S3B).
Quantitative Benchmarking of the CMT Approach
To evaluate the utility of the CMT approach for quantitative proteomics studies, we labeled YWCL tryptic digest with each of our 6-plex reagents along with those of a commercial 6-plex reagent (TMT). When compared to YWCL samples labeled with TMT (Proteome Sciences), CMT-labeled samples performed similarly in terms of the number of peptides identified and estimated labeling percentage (>97% in all cases; Table S1). For duplex mixing, we found that both the primary and secondary reporter ion series of CMT reagents faithfully reported mixing ratios across an order of magnitude with similar accuracy to measurements made with TMT labeled samples (Figures 3A and S4A). We observed that, while both CMT reporter ion series accurately reflected mixing ratios, the reporter ion splitting ratio was influenced by the presence or absence of a highly mobile proton on the labeled precursor peptide30 (Figure 3C).
Figure 3.
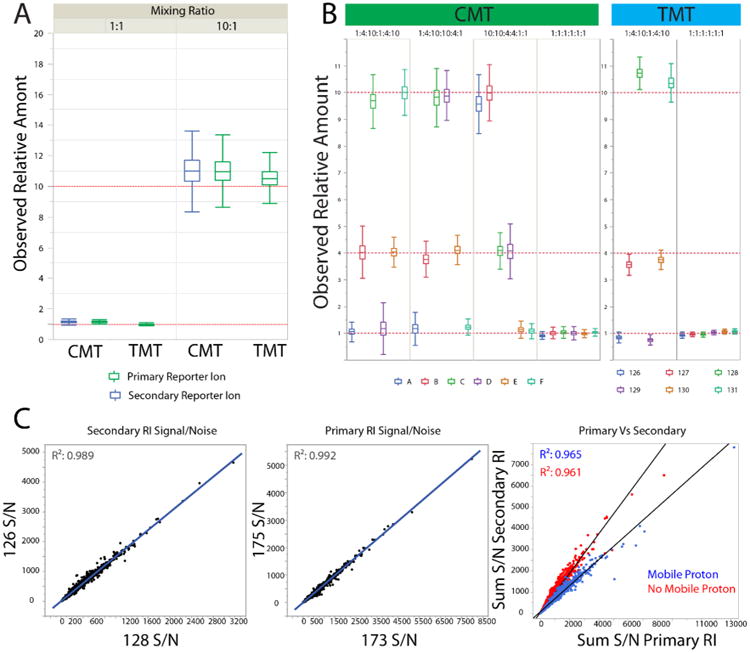
CMT and TMT YWCL mixing experiments demonstrate accurate determination of mixing ratios over an order of magnitude. (A) Box and whisker plots demonstrate that CMT and TMT labeling systems have comparable accuracy over mixing ratios spanning an order of magnitude. CMT reagents A and E, along with TMT 129 and 131, were used to label YWCL tryptic digests. Labeled samples were mixed at both equal and 10:1 mixing ratios, and analyzed on a Q Exactive instrument. Ratios between samples were determined by comparing the ratios between 126/128 (CMT Secondary), 175/173 (CMT Primary), and 129/131 (TMT). No application of the formulas described in Figure 2C was required. (B) CMT and TMT 6-plex reagents were used to label YWCL tryptic digests. Labeled samples were mixed at combinations of 1:4:10 ratios, as well as equal mixing ratios, and analyzed on a Q Exactive instrument. Contributions of individual CMT labels to overall signal were calculated from the equations in Figure 2C. (C) Duplex mixing demonstrates that ratios within reporter ion series, but not between them, are reliably reproducible. The splitting ratio between primary and secondary reporter ions is correlated to the presence or absence of a highly mobile proton on the labeled precursor peptide.
For samples containing mixtures of all six CMT reagents, a series of mathematical steps are required to arrive at CMT tag contributions to the overall RI signals observed. In addition to the series of linear equations described in Figure 2C, isotopic envelope contributions from each tag to RI intensities must also be corrected. While such corrections are also necessary with traditional isobaric reagents,31 the combinatorial nature of CMT necessitated a revision of established methods. Since reporter ions shared by two or more CMT tags can have tag specific isotopic envelopes (arising from differences in the isotopic purities of synthetic precursors of each reagent), relative contributions of each CMT reagent to overall signal must be established before deisotoping algorithms can be used. Since these relative contributions cannot be precisely known until deisotoping is achieved, a crude estimate of the contribution of each tag to the reporter ion signal is calculated using the equations described in Figure 2C. These crude values are then used to estimate the relative contributions to the signal arising from isotopic impurities in each reagent, and these values are used to obtain a better estimate of the true relative CMT reagent contributions to the overall RI signal. This process is iterated until the input and updated CMT reagent contributions converge to the true value (Figures S4 and S5).
Importantly, no significant difference was observed between the two reagent systems in terms of number of peptides identified (Table S1), demonstrating the applicability of the CMT approach to complex samples with peptide concentrations varying by several orders of magnitude. Furthermore, the way in which CMT tags were mixed did not significantly affect measurement accuracy in sixplex mixtures (Figures 3B and S4), although mixing arrangement did affect convergence time for the iterative deisotoping process (Figure S4C).
CMT Reagents Effectively Enable Quantitative Comparisons between Complex Samples
We next explored the ability of the CMT system to accurately and quantitatively distinguish differences between complex samples. Liver homogenate tryptic digests from three different inbred mouse strains were labeled with both CMT and TMT tags. We then compared the ability of these two isobaric reagent sets to accurately measure differences between two strains in triplicate (Figures 4A and S6), as well as between both male and female specimens derived from all three strains using a single measurement per sample (Figures 4E and S6). Importantly, peptide and protein identification rates were comparable between the two labeling strategies (Figure S6B). Hierarchical clustering was used to evaluate the effectiveness of each labeling system at quantitatively distinguishing between sample types. In the triplicate experiments, both CMT and TMT effectively distinguished samples based on strain. We found quantitative accuracy between triplicate measurements to be similar at both the peptide and protein level (Figure 4B,C). This lead to triplicate measurements associating tightly with each other by hierarchical clustering (Figure 4D).
Figure 4.
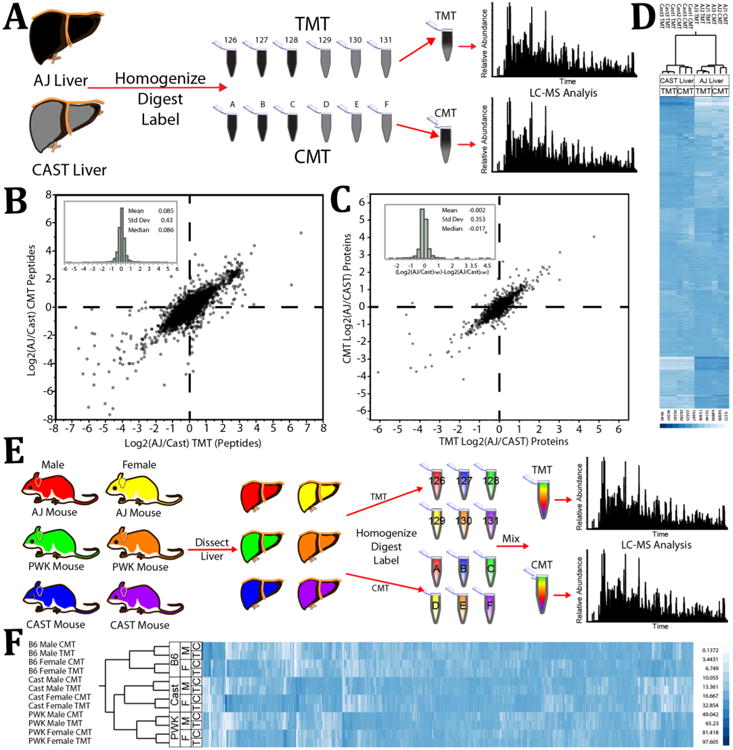
Protein-level comparison of mixing ratios measured by CMT or TMT of mouse liver tryptic digests derived from male and female mice of three unique strains. (A) Experimental design for data represented in (B), (C), and (D). Livers of two unique mouse strains were homogenized, digested, and labeled with TMT or CMT. Samples were mixed into 6-plexed combinations and analyzed by LC-MS on an Orbitrap Fusion. (B) The average ratio between peptides of the AJ and CAST strains transformed by the log base 2 from the CMT experiment are plotted against those quantified in the TMT experiment. This plot includes only those peptides identified with both labeling systems that displayed a total reporter ion signal/noise greater than 200 (>233 for CMT) and which had an MS2 isolation specificity greater than 0.8. (Inset) Log base 2 fold difference distribution between measurements made in the CMT system vs measurements made with the TMT system. (C) The average ratio between proteins of the AJ and CAST strains transformed by the log base 2 from the CMT experiment are plotted against those quantified in the TMT experiment. (Inset) Log base 2 fold difference distribution between measurements made in the CMT system vs measurements made with the TMT system. (D) Fractional contribution of each sample to the overall signal of each quantified protein in both labeling experiments (CMT and TMT) was compared via hierarchical clustering. (E) Experimental design for data represented in (F). Livers from both male and female mice of three unique strains were homogenized, digested, and labeled with TMT or CMT. Samples were mixed into 6-plexed combinations and analyzed by LC-MS on an Orbitrap Fusion. (F) Fractional contribution of each sample to the overall signal of each quantified protein in both labeling experiments (CMT and TMT) was compared via hierarchical clustering. The PWK and CAST strains are closer to each other evolutionarily than to the B6 strain.
In the second experiment (Figure 4E), both reagent systems reliably quantified differences between gender, strain, and evolutionary separation between strains (Figure 4F). As evidenced by hierarchical clustering, the liver proteomes were well differentiated by both reagent systems. In particular, the laboratory strain (B6) is clearly differentiated from the two wild-derived strains (CAST/PWK), while the wild-derived strains themselves form distinct clusters
Discussion
High-throughput mass spectrometry-based quantitative proteomics is emerging as a powerful strategy for uncovering biological mechanisms, biomarker discovery, and understanding disease states. Although advances in instrumentation are continually increasing the speed and depth at which samples can be analyzed, increases in isobaric multiplexing density would be beneficial for several reasons, regardless of improvements in instrument speed. First, a principle advantage of isobaric labeling is the ability to mix samples during the sample preparation step. This not only increases sample preparation throughput, but also eliminates variability associated with inconsistent sample treatment. The magnitude of these advantages should increase with increasing multiplexing capacity of isobaric tags.
Second, mass spectrometry based proteomics experiments often operate in data-dependent mode, where ions are chosen for MS2 sequencing based on a prior MS1 scan and a set of selection rules. As a result, while the number of peptides identified from run to run is relatively constant for similar samples, the stochastic nature of peak picking results in an imperfect overlap in peptide identifications. Therefore, only those peptides or proteins that are reliably detected across all mass spectrometry runs can be compared when the sample number exceeds the multiplexing capacity of the quantitative strategy. Since reproducible identification is correlated with protein abundance, the practical consequence of this is that often only the most abundant proteins in the proteome of interest are quantifiable across all samples in large studies. This establishes a crippling paradox in certain experimental settings. For instance, large sample numbers are needed in order to statistically identify with confidence important biomarkers or to uncover proteomic differences associated with phenotypic or disease states. However, these proteins of interest are frequently of low abundance within the proteome, and are therefore prone to irreproducible quantification across multiple mass spectrometry experiments.
Additionally, simultaneous measurement of multiplexed reporter ions allows direct comparison of relative abundance across mixed samples under instrument conditions that are necessarily identical. Finally, any increases in multiplexing capacity will directly lead to the ability to analyze more samples in a given amount of time regardless of instrument speed. In order for large scale or high-throughput quantitative proteomics studies to be routinely feasible, both instrument speed and multiplexing capacity will likely need to improve.
While the multiplexing capacity of all isobaric labeling strategies can be increased by increasing the size of the isobaric tag, the CMT strategy has intrinsically higher multiplexing density for a given number of isotopes per tag than conventional isobaric reagents (Figure 5, Supplementary Methods). Theoretically, the influence of the tag on the chromatographic and ionization properties of labeled peptides should increase with increasing tag size. This may partially explain why increasing isobaric reagent size has been shown to negatively impact protein identification rates.21 While other strategies to increase the multiplexing density of isobaric tags have been proposed;16–18 to our knowledge, this is only the second22,23 strategy to substantially increase the multiplexing density of isobaric reagents while preserving chromatographic unity.
Figure 5.
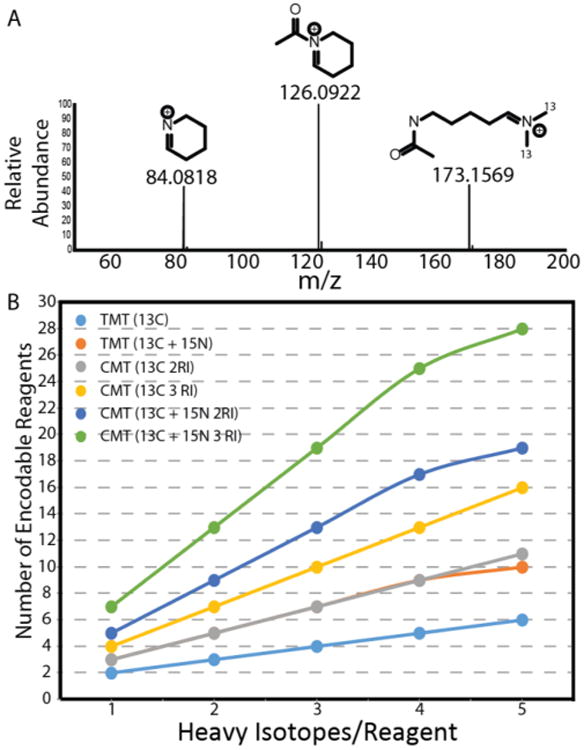
Utilization of multiple reporter ion series allows for rapid expansion of isobaric multiplexing capacity. (A) CMT reagents produce three series of reporter ions simultaneously under HCD conditions, as exemplified by the HCD spectrum of CMT reagent E free acid (NCE = 35). Only the largest two of these reporter ion series are isotopically encoded in the current application of the reagent. (B) Comparison of the multiplexing capacity of TMT and CMT reagents utilizing either two or three reporter ion series. Reagent sets incorporating 15N are limited to 1 such instance per reagent within the set.
An additional benefit of the CMT scaffold reported herein is the relatively quick, easy, and high yielding synthesis. The predominantly solid-phase nature of the synthesis enables a significant amount of automation and parallelization on standard peptide synthesizers, and eliminates laborious purification of intermediates. Indeed, with all protected amino acid groups in-hand, parallel synthesis and purification of multiple CMT isotopologues can be completed in approximately 1 week. Further, the ready availability lysine, acetic acid, and formaldehyde isotopologues should allow for rapid, cost-effective, large scale synthesis of CMT isobaric tags, potentially enabling large scale isobaric labeling of samples prior to enrichment for post-translational modifications.32
When evaluating the quantitative performance of CMT, it is clear that, in its current implementation, CMT quantitative precision is marginally inferior to that of TMT. We consistently observe an approximately 2-fold higher CV for CMT measurements across a variety of instruments and experimental designs (Figure S7). Practically, this limits the ability of CMT to detect significant protein expression differences, particularly when the fold-change is small (Figure S8). Several potential explanations exist for the increased variability of CMT measurements in comparison to those made with TMT. These include variability introduced by the iterative deisotoping process, amine-reactive impurities in the CMT reagents, variability inherent to dual reporter ion fragmentation, interference by coincidentally isobaric peptide side chain fragment ions, increased susceptibility to coisolation interference, or variability introduced by the deconvolution of CMT signal.
The effect of signal deconvolution is most clearly observed in Figure 3B, where a noticeable reduction in measurement precision is observed for those reagents which do not have unambiguous reporter ions (CMT B, C, and D). Whereas the average measurement CV under equal mixing conditions for these reagents is 9.4%, reagents A, E, and F averaged 6.8% in this statistic. However, we consistently observe an approximately 2-fold increase in CMT measurement variability over that of TMT in YWCL duplex mixing experiments with 2 Da reporter ion spacing and no requirement for signal deconvolution (Figure S7A). This suggests that CMT signal deconvolution and iterative deisotoping are not the only contributors to increased CMT measurement variability. Since coisolation interference25 does not exist when identical proteomes are differentially labeled, these experiments also rule out increased susceptibility to interference as a significant source of decreased measurement precision. Most likely this effect is due to minor impurities present in the CMT 6-plex reagents (Figures S9–S12, Supporting Information).
While further synthetic and methodological optimization is clearly required in order to obtain measurement precision rivaling that of current commercially available isobaric labeling reagents, we feel that this gap can likely be overcome. Our experiments clearly demonstrate that combinatorial utilization of multiple reporter ion series can accurately convey quantitative differences between complex proteomes, theoretically enabling significant improvements in the multiplexing capacity of isobaric reagents. In addition, we anticipate that extension of this approach to incorporate additional reporter ion series should further expand multiplexing capacity for a given reagent isotopic composition. Indeed, although we do not take advantage of it in the current CMT implementation, we in fact observe an additional secondary CMT reporter ion corresponding to deacylation of the cyclized lysine side chain (Figures 5A and S13).
Positional encoding of stable isotopes within this region along with an expanded system of linear equations to leverage the additional quantitative information should afford a nearly 3-fold improvement in multiplexing capacity over traditional isobaric reagents (Figure 5B). With the current CMT reagent structure, it should therefore be possible to achieve a 16-plex with 1 Da spacing between reporter ions, the reduced resolution requirements for which compared to current 10-plex reagents should reduce MS3 scan times and increase analytical depth.
Finally, related CMT architectures that would allow for either additional or differential heteroatom isotopologues, such as 15N and 18O, should enable rapid expansion of multiplexing capacity to levels compatible with high throughput screening. It is, therefore, reasonable to envision achieving sufficient multiplexing capacity for analyzing entire 96-well plates in just 2 or 3 MS runs, bringing high-throughput screening by mass spectrometry within reach. In summary, we demonstrate that the CMT approach of using multiple series of overlapping reporter ions is a promising new strategy for expanding the multiplexing capacity of chromatographically identical isobaric reagents.
Supplementary Material
Supplementary methods and figures associated with the manuscript are available (PDF)
Acknowledgments
M.W. was supported by NIH Grant RO1GM103785, the Charles A. King Trust Postdoctoral Fellowship. L.D.W. was supported by NIH grant 1R35 CA197583-01.
Footnotes
Supporting Information: The Supporting Information is available free of charge on the ACS Publications website at DOI: 10.1021/acs.analchem.5b02307.
Author Contributions: C.R.B, W.H. and S.P.G. conceived the project. C.R.B. and G.H.B. conceived and executed the synthesis. C.R.B. performed labeling and mass spectrometry experiments. C.R.B, W.H., and S.P.G. analyzed the results. C.R.B and M.W. derived equations for expansion of CMT multiplicity and deconvolution of reporter ion signal. R.R. implemented software solutions for data analysis. C.R.B., W.H., M.W. B.K.E., and S.P.G. wrote the manuscript. L.D.W. provided infrastructure support and guidance. All authors have given approval to the final version of the manuscript.
Notes: The authors declare no competing financial interest.
Contributor Information
Craig R. Braun, Email: craig_braun@hms.harvard.edu.
Steven P. Gygi, Email: steven_gygi@hms.harvard.edu.
Wilhelm Haas, Email: whaas@mgh.harvard.edu.
References
- 1.Richards AL, Merrill AE, Coon JJ. Curr Opin Chem Biol. 2015;24:11–17. doi: 10.1016/j.cbpa.2014.10.017. [DOI] [PMC free article] [PubMed] [Google Scholar]
- 2.Huttlin EL, Jedrychowski MP, Elias JE, Goswami T, Rad R, Beausoleil SA, Villén J, Haas W, Sowa ME, Gygi SP. Cell. 2010;143(7):1174–1189. doi: 10.1016/j.cell.2010.12.001. [DOI] [PMC free article] [PubMed] [Google Scholar]
- 3.Hebert AS, Richards AL, Bailey DJ, Ulbrich A, Coughlin EE, Westphall MS, Coon JJ. Mol Cell Proteomics. 2014;13(1):339–347. doi: 10.1074/mcp.M113.034769. [DOI] [PMC free article] [PubMed] [Google Scholar]
- 4.Ong SE, Mann M. Nat Protoc. 2007;1(6):2650–2660. doi: 10.1038/nprot.2006.427. [DOI] [PubMed] [Google Scholar]
- 5.Thompson A, Schäfer J, Kuhn K, Kienle S, Schwarz J, Schmidt G, Neumann T, Hamon C. Anal Chem. 2003;75(8):1895–1904. doi: 10.1021/ac0262560. [DOI] [PubMed] [Google Scholar]
- 6.Boersema PJ, Raijmakers R, Lemeer S, Mohammed S, Heck AJR. Nat Protoc. 2009;4(4):484–494. doi: 10.1038/nprot.2009.21. [DOI] [PubMed] [Google Scholar]
- 7.Savitski MM, Reinhard FBM, Franken H, Werner T, Savitski MF, Eberhard D, Molina DM, Jafari R, Dovega RB, Klaeger S, Kuster B, Nordlund P, Bantscheff M, Drewes G. Science. 6205. Vol. 346. Washington, DC, U. S: 2014. pp. 1255784–1255784. [DOI] [PubMed] [Google Scholar]
- 8.Keshishian H, Burgess MW, Gillette MA, Mertins P, Clauser KR, Mani DR, Kuhn EW, Farrell LA, Gerszten RE, Carr SA. Mol Cell Proteomics. 2015;M114:046813. doi: 10.1074/mcp.M114.046813. [DOI] [PMC free article] [PubMed] [Google Scholar]
- 9.Murphy JP, Stepanova E, Everley RA, Paulo JA, Gygi SP. Mol Cell Proteomics. 2015;M114:045849. doi: 10.1074/mcp.M114.045849. [DOI] [PMC free article] [PubMed] [Google Scholar]
- 10.Paulo JA, Gygi SP. Proteomics. 2015;15(2–3):474–486. doi: 10.1002/pmic.201400155. [DOI] [PMC free article] [PubMed] [Google Scholar]
- 11.McAlister GC, Nusinow DP, Jedrychowski MP, Wühr M, Huttlin EL, Erickson BK, Rad R, Haas W, Gygi SP. Anal Chem. 2014;86(14):7150–7158. doi: 10.1021/ac502040v. [DOI] [PMC free article] [PubMed] [Google Scholar]
- 12.Sohn CH, Lee JE, Sweredoski MJ, Graham RLJ, Smith GT, Hess S, Czerwieniec G, Loo JA, Deshaies RJ, Beauchamp JL. J Am Chem Soc. 2012;134(5):2672–2680. doi: 10.1021/ja2099003. [DOI] [PMC free article] [PubMed] [Google Scholar]
- 13.Zimnicka M, Moss CL, Chung TW, Hui R, Tureček F. J Am Soc Mass Spectrom. 2012;23(4):608–620. doi: 10.1007/s13361-011-0184-y. [DOI] [PubMed] [Google Scholar]
- 14.Chen Z, Wang Q, Lin L, Tang Q, Edwards JL, Li S, Liu S. Anal Chem. 2012;84(6):2908–2915. doi: 10.1021/ac203467q. [DOI] [PubMed] [Google Scholar]
- 15.Zhang J, Wang Y, Li S. Anal Chem. 2010;82(18):7588–7595. doi: 10.1021/ac101306x. [DOI] [PubMed] [Google Scholar]
- 16.Frost DC, Greer T, Li L. Anal Chem. 2015;87:1646. doi: 10.1021/ac503276z. [DOI] [PMC free article] [PubMed] [Google Scholar]
- 17.Xiang F, Ye H, Chen R, Fu Q, Li L. Anal Chem. 2010;82(7):2817–2825. doi: 10.1021/ac902778d. [DOI] [PMC free article] [PubMed] [Google Scholar]
- 18.Dephoure N, Gygi SP. Sci Signaling. 2012;5(217):rs2. doi: 10.1126/scisignal.2002548. [DOI] [PMC free article] [PubMed] [Google Scholar]
- 19.Everley RA, Kunz RC, McAllister FE, Gygi SP. Anal Chem. 2013;85(11):5340–5346. doi: 10.1021/ac400845e. [DOI] [PubMed] [Google Scholar]
- 20.Choe L, D'Ascenzo M, Relkin NR, Pappin D, Ross P, Williamson B, Guertin S, Pribil P, Lee KH. Proteomics. 2007;7(20):3651–3660. doi: 10.1002/pmic.200700316. [DOI] [PMC free article] [PubMed] [Google Scholar]
- 21.Pichler P, Köcher T, Holzmann J, Mazanek M, Taus T, Ammerer G, Mechtler K. Anal Chem. 2010;82(15):6549–6558. doi: 10.1021/ac100890k. [DOI] [PMC free article] [PubMed] [Google Scholar]
- 22.Werner T, Becher I, Sweetman G, Doce C, Savitski MM, Bantscheff M. Anal Chem. 2012;84(16):7188–7194. doi: 10.1021/ac301553x. [DOI] [PubMed] [Google Scholar]
- 23.McAlister GC, Huttlin EL, Haas W, Ting L, Jedrychowski MP, Rogers JC, Kuhn K, Pike I, Grothe RA, Blethrow JD, Gygi SP. Anal Chem. 2012;84(17):7469–7478. doi: 10.1021/ac301572t. [DOI] [PMC free article] [PubMed] [Google Scholar]
- 24.Cruz LJ, Beteta NG, Ewenson A, Albericio F. Org Process Res Dev. 2004;8(6):920–924. [Google Scholar]
- 25.Ting L, Rad R, Gygi SP, Haas W. Nat Methods. 2011;8(11):937–940. doi: 10.1038/nmeth.1714. [DOI] [PMC free article] [PubMed] [Google Scholar]
- 26.Elias JE, Gygi SP. Nat Methods. 2007;4(3):207–214. doi: 10.1038/nmeth1019. [DOI] [PubMed] [Google Scholar]
- 27.Pease BN, Huttlin EL, Jedrychowski MP, Talevich E, Harmon J, Dillman T, Kannan N, Doerig C, Chakrabarti R, Gygi SP, Chakrabarti D. J Proteome Res. 2013;12(9):4028–4045. doi: 10.1021/pr400394g. [DOI] [PMC free article] [PubMed] [Google Scholar]
- 28.Miller SC, Scanlan TS. J Am Chem Soc. 1997;119(9):2301–2302. [Google Scholar]
- 29.Biron E, Chatterjee J, Kessler H. J Pept Sci. 2006;12(3):213–219. doi: 10.1002/psc.711. [DOI] [PubMed] [Google Scholar]
- 30.Wysocki VH, Tsaprailis G, Smith LL, Breci LA. J Mass Spectrom. 2000;35(12):1399–1406. doi: 10.1002/1096-9888(200012)35:12<1399::AID-JMS86>3.0.CO;2-R. [DOI] [PubMed] [Google Scholar]
- 31.Lemeer S, Hahne H, Pachl F, Kuster B. Methods Mol Biol. 2012;893:489–499. doi: 10.1007/978-1-61779-885-6_29. [DOI] [PubMed] [Google Scholar]
- 32.Erickson BK, Jedrychowski MP, McAlister GC, Everley RA, Kunz R, Gygi SP. Anal Chem. 2015;87(2):1241–1249. doi: 10.1021/ac503934f. [DOI] [PMC free article] [PubMed] [Google Scholar]
Associated Data
This section collects any data citations, data availability statements, or supplementary materials included in this article.
Supplementary Materials
Supplementary methods and figures associated with the manuscript are available (PDF)


