Supplemental Digital Content is available in the text.
Keywords: ancestry, diversity, drug response, pharmacogenomics
Abstract
Background
Interpopulation differences in drug responses are well documented, and in some cases they correspond to differences in the frequency of associated genetic markers. Understanding the diversity of genetic markers associated with drug response across different global populations is essential to infer population rates of drug response or risk for adverse drug reactions, and to guide implementation of pharmacogenomic testing. Sri Lanka is a culturally and linguistically diverse nation, but little is known about the population genetics of the major Sri Lankan ethnic groups. The objective of this study was to investigate the diversity of pharmacogenomic variants in the major Sri Lankan ethnic groups.
Methods
We examined the allelic diversity of more than 7000 variants in genes involved in drug biotransformation and response in the three major ethnic populations of Sri Lanka (Sinhalese, Sri Lankan Tamils, and Moors), and compared them with other South Asian, South East Asian, and European populations using Wright’s Fixation Index, principal component analysis, and STRUCTURE analysis.
Results
We observed overall high levels of similarity within the Sri Lankan populations (median FST=0.0034), and between Sri Lankan and other South Asian populations (median FST=0.0064). Notably, we observed substantial differentiation between Sri Lankan and European populations for important pharmacogenomic variants related to warfarin (VKORC1 rs9923231) and clopidogrel (CYP2C19 rs4986893) response.
Conclusion
These data expand our understanding of the population structure of Sri Lanka, provide a resource for pharmacogenomic research, and have implications for the clinical use of genetic testing of pharmacogenomic variants in these populations.
Introduction
Many drugs differ in their effectiveness or risk for adverse drug reactions (ADRs) in different ethnic populations. In some cases, these interpopulation differences in drug response show strong correspondence to the frequencies of the associated pharmacogenomic risk alleles. For example, the mean daily dose requirement of warfarin across different ethnic groups is closely mirrored by interethnic differences in the frequency of the −1639G variant (rs9923231) in the warfarin drug target, VKORC1 1,2. This suggests that it may be possible to infer population-level responses to medications by examining differences in allele frequency. However, our knowledge of the differences in the frequencies of important pharmacogenomic variants in world populations is far from complete. It will be essential to define the frequency of pharmacogenomic gene variants in different populations to assess the applicability of pharmacogenomic associations to different populations, to infer population-level response rates and ADR risk for different medications, and to guide the implementation of pharmacogenomic testing in different population groups.
Earlier studies on pharmacogenomic diversity surveyed a limited number of variants and populations 3. Recently, more comprehensive surveys of pharmacogenomic diversity have been conducted in Asian, African, and various other populations 4–7. Sri Lanka (SL) is an island nation located off the Southern tip of India, with a population of ∼20 million inhabitants 8 and a demographic profile shaped by multiple events in history. Archeological excavations have suggested that there was human habitation in SL as early as 28 000 years ago 9. The three largest population groups are the Sinhalese, the SL Tamils, and the Moors, accounting for 74.9, 11.1, and 9.3% of the population, respectively 10. Historical records trace the origin of the Sinhalese people to East India (Bengal) and the SL Tamils to waves of migration from South India. However, the exact origin of these two populations remains controversial 11–13. The Moors are thought to represent a hybrid population of Arab traders who interbred with local inhabitants.
SL has substantial cultural and linguistic diversity. Notably, the traditional religion among Sinhalese is Buddhism and among Tamils is Hinduism. In addition, the Sinhalese language is a member of the Indo-European language group, whereas the Tamil language is a member of the Dravidian language group. However, whether this cultural diversity reflects underlying differences in the population genetic structure is unknown. Previous population genetic studies of SL have focused on only a handful of loci, such as subtypes of blood groups, red cell enzymes, and serum proteins 14, and more recently the hypervariable segments of mitochondrial DNA 15. The population genetics of SL people is, therefore, not well defined. Furthermore, no previous study has examined pharmacogenomic diversity among these populations.
The objective of this study was to explore the population diversity of variants in genes involved in drug biotransformation and response among individuals from the three major SL ethnic groups (Sinhalese, SL Tamils, and Moors), and to compare them with Indians (INS), Chinese (CHS), and Malays (MAS) from the Singapore Genome Variation Project (SGVP), as well as with other South Asian (SAS) and European (CEU) populations from 1000 genomes.
Methods
Study populations
The SL study population consisted of healthy individuals from the three major ethnic groups (55 Sinhalese, 73 SL Tamils, and 78 Moors). Ethnicity was assigned on the basis of self-reported ethnicity. We required that the self-reported ethnicity of the four grandparents of each participant be the same, and that they report the absence of intermarriage between ethnic groups over the previous three generations. All participants gave their written informed consent. This study was approved by the Institutional Review Board of the University of Colombo.
For comparisons with the SGVP populations, we used previously reported genotype data 5 from 253 individuals (88 CHS, 87 MAS, and 78 INS) that were merged with genomewide data 16. For comparisons with other SAS [Gujarati INS from Houston, Texas (GIH); Punjabi from Lahore, Pakistan (PJL); Bengali from Bangladesh (BEB); SL Tamils from the UK (STU); Indian Telugu from the UK (ITU)] and European [Utah residents with Northern and Western European ancestry (CEU)] populations, we used data from 1000 Genomes phase 3 release (http://www.1000genomes.org). We merged these datasets with the SL dataset and used overlapping SNPs for cross-population comparisons (see Figure, Supplemental digital content 1, http://links.lww.com/FPC/A915).
Genotyping and quality control
We genotyped SL samples on a customized Illumina Infinium array (Illumina, San Diego, California, USA) containing 7907 SNPs in genes involved in drug absorption, distribution, metabolism, and excretion (ADME), which is an expanded version of a previously described assay 5.
Concordance between sample technical duplicates and duplicate SNPs was first checked, and any sample or SNP with less than 99% concordance was removed. Subsequently, samples were checked for concordance of reported and estimated sex and cryptic relatedness based on identity-by-state. As only ethnicity was important in our analysis, we included two samples in high identity-by-state pairs that belonged to the same ethnic group to retain as many samples as possible. The data were then filtered for SNPs with call rate less than 90% and for those that deviated from Hardy–Weinberg equilibrium (P<0.001) in at least one ethnic group (see Figure, Supplemental digital content 2, http://links.lww.com/FPC/A916).
After data merging, we compared minor allele frequencies (MAFs) between CHS from SGVP and CHS (Southern Han Chinese) from 1000 Genomes. SNPs with clearly different MAFs were excluded (see Figures, Supplemental digital content 1, http://links.lww.com/FPC/A915 and Supplemental digital content 3, http://links.lww.com/FPC/A917). The concordance between MAFs of SL Tamils and STU was also checked, and SNPs (see Figure, Supplemental digital content 4, http://links.lww.com/FPC/A918) with FST greater than 0.05 between the SL and STU populations were confirmed using Sanger sequencing or TaqMan genotyping (Life Technologies). SNPs with discordant genotypes were excluded from the dataset [for principal component analysis (PCA) and STRUCTURE], but the MAFs for SNPs from TaqMan genotyping were included in the FST analysis (see Figure, Supplemental digital content 1, http://links.lww.com/FPC/A915 and Table, Supplemental digital content 5, http://links.lww.com/FPC/A919). CYP2C19*2 (rs4244285), not present on the Illumina array, was genotyped by TaqMan assay according to the manufacturer’s instructions. All analyses were carried out in R Version 3.1.0 17 using the GenABEL package 18.
Statistical analysis
Variance in allele frequencies
To assess the variance in ADME SNPs across different populations, we calculated Wright’s fixation index (FST) 19 at each SNP for various population comparisons. FST values range from 0 to 1, with greater values indicating a greater extent of differentiation. Generally, values less than 0.05 indicate little differentiation and those greater than 0.15, substantial differentiation 19. Comparisons were made within the SL populations, between SL and SAS populations, between SL and SGVP populations, and among all populations.
Principal component analysis
PCA was carried out by performing classical multidimensional scaling on the distance matrix of the genomic kinship matrix, which was computed within the GenABEL package in R on all autosomal SNPs. This was carried out on the four sets of populations described above to dissect their relationships at the ADME SNPs.
STRUCTURE analysis
We carried out STRUCTURE analysis, using version 2.3.4 20, on merged data from all populations for a different perspective on interpreting the genetic structure of these populations at the ADME SNPs. The analysis was carried out assuming the admixture model and correlated frequencies among populations, with 10 000 burn-in iterations and 10 000 samplings. We ran the analysis for number of populations (K) ranging from 2 to 12, which is the maximum number of populations included in this study. Therefore for each run, STRUCTURE attempts to cluster all individuals into K populations.
Results
Population structure at pharmacogenomic loci
We genotyped individuals from the major SL ethnic groups at more than 7000 SNPs in ADME genes. After applying quality control filters, we analyzed data from 49 Sinhalese, 72 SL Tamils, and 76 Moors (see Figure, Supplemental digital content 2, http://links.lww.com/FPC/A916). We observed relatively little overall differentiation among the three SL ethnic groups at the ADME SNPs (Figs 1a and 2a), indicating that, from the perspective of global pharmacogenomic diversity, these three populations are highly similar. Including the SAS populations revealed little overall differentiation on comparison of FST (Fig. 1b). However, PCA revealed evidence of subtle population substructure between the SL and the GIH/PJL populations (Fig. 2b and Figure, Supplemental digital content 6, http://links.lww.com/FPC/A920). On comparing SL and SGVP populations, greater differentiation was observed between SL and CHS/MAS populations compared with that between SL and INS (Figs 1c and 2c). Finally, in analysis of all populations, the greatest differentiation was observed among the major ancestral groups, with the SL and SAS populations clustering together (Figs 1d and 2d). Pairwise FST comparisons also showed that the CHS, MAS, and CEU populations were more differentiated from the SL, SAS, and INS populations than were the SL, SAS, and INS populations among themselves (Fig. 3).
Fig. 1.
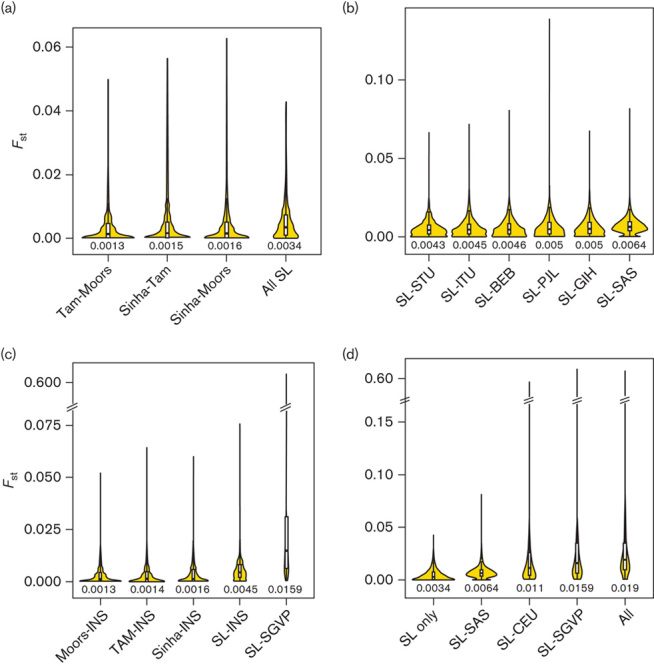
FST distributions for different population comparisons. Violin plots, each comprising a box plot and a density plot, showing distributions of FST for comparisons (a) within the SL population, (b) between the SL and SAS populations, (c) between the SL and SGVP populations, and (d) among all populations for 5139 SNPs. The dark line in the middle of the box plots and the edges indicate the median and the first and third quartiles, respectively. The width of the density plots indicate the relative density of SNPs at a certain FST. Values below the violin plots are median FST. CEU, Utah residents with Northern and Western European ancestry; INS, Indians in Singapore; MAF, minor allele frequency; SAS, South Asian; SGVP, Singapore Genome Variation Project; Sinha, Sinhalese; SL, Sri Lanka; SNP, single nucleotide polymorphism; TAM, Sri Lankan Tamils.
Fig. 2.
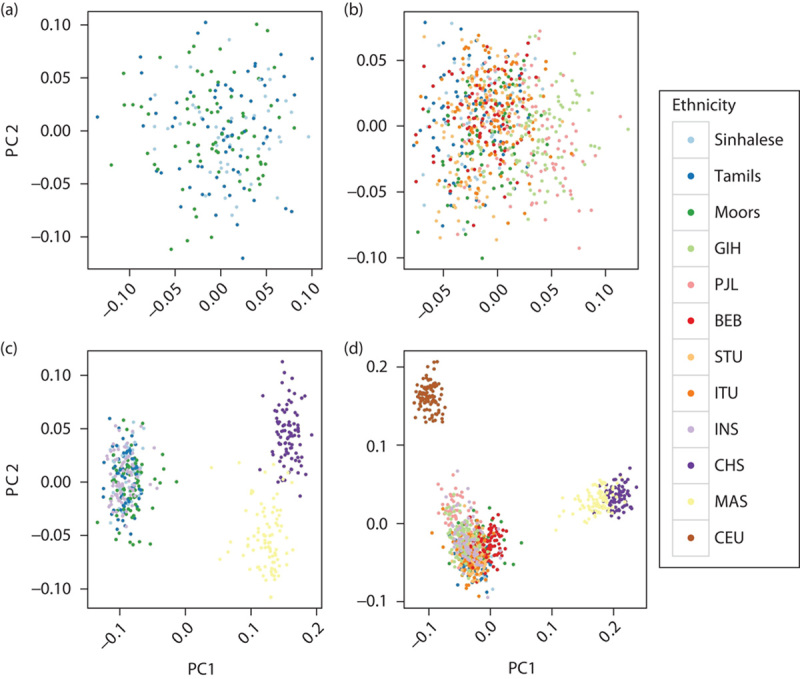
PCA plots of different population combinations. Plots of the first two principal components across 5135 SNPs for different subsets of populations. (a) SL population only, (b) SL and SAS populations, (c) SL and SGVP populations, and (d) all populations. All populations could be distinguished at 5135 SNPs into three broad ancestral groups (CEU, South Asians, and East Asians) (c, d), but the SL, SAS, and INS populations are indistinguishable from each other (a, b). There is slight separation of GIH and PJL from the other SAS and SL populations at PC1 [(b) and Figure, Supplemental digital content 6, http://links.lww.com/FPC/A920], and they are located slightly closer to CEU than the other SAS and SL populations (d). BEB, Bengali from Bangladesh; CEU, Utah residents with Northern and Western European ancestry; CHS, Chinese in Singapore; GIH, Gujarati Indians from Houston, Texas; INS, Indians in Singapore; ITU, Indian Telugu from the UK; MAS, Malays in Singapore; PCA, principal component analysis; PJL, Punjabi from Lahore, Pakistan; SAS, South Asian; SGVP, Singapore Genome Variation Project; SL, Sri Lankan; SNP, single nucleotide polymorphism; STU, SL Tamils from the UK.
Fig. 3.
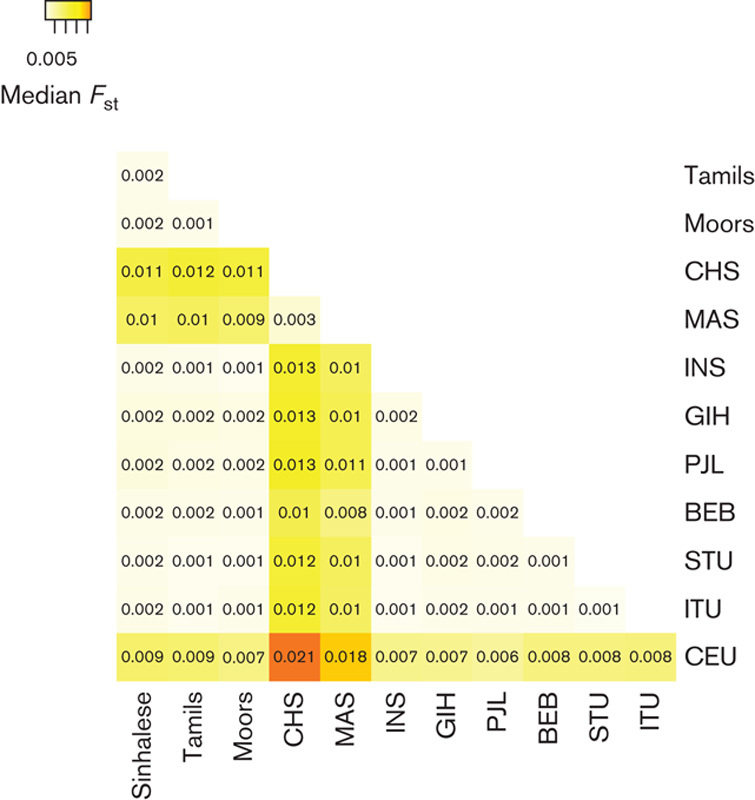
Pairwise FST between all population pairs. Heatmap of median FST across 5139 SNPs for all pairwise comparisons in all populations. Higher color intensities indicate higher FST and thus greater genetic differentiation at the pharmacogenomic loci. BEB, Bengali from Bangladesh; CEU, Utah residents with Northern and Western European ancestry; CHS, Chinese in Singapore; GIH, Gujarati Indians from Houston, Texas; INS, Indians in Singapore; ITU, Indian Telugu from the UK; MAS, Malays in Singapore; PCA, principal component analysis; PJL, Punjabi from Lahore, Pakistan; SAS, South Asian; SGVP, Singapore Genome Variation Project; SL, Sri Lankan; SNP, single nucleotide polymorphism; STU, SL Tamils from the UK.
Next, we used STRUCTURE analysis to infer ancestral population groups. Overall, these results were consistent with the patterns observed on PCA (Fig. 4). However, within the SL population, the Moor population displayed more admixture than the Sinhalese and SL Tamil populations, consistent with their demographic history (Fig. 4a), a feature that was not apparent on PCA plots. At K=3, the inferred ancestry corresponds to the three main ancestral groups (CEU, CHS/MAS, and SL/SAS/INS). With increasing K, no further distinct populations were apparent, suggesting that SL, SAS, and INS could not be separated into distinct ancestral populations, although they displayed varying degrees of admixture (data not shown). The GIH and PJL populations displayed the most admixture with the CEU population, whereas the BEB population showed some admixture with East Asians. This is consistent with the slight shift of GIH and PJL populations away from the other SL and SAS populations and toward the CEU population, observed on PCA (Fig. 2b and d and Figure, Supplemental digital content 6, http://links.lww.com/FPC/A920). Collectively, the evidence from FST, PCA, and STRUCTURE analyses indicates that there is high similarity among SL populations and between the SL population and other SAS populations, including INS from Singapore; however, the SL population is genetically distinct from CHS, MAS, and CEU populations.
Fig. 4.
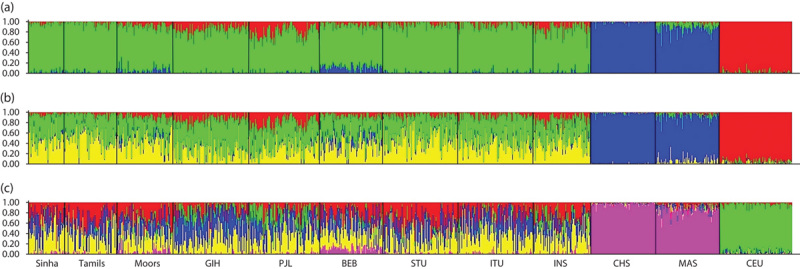
STRUCTURE results showing population structure inferred from ADME SNPs. STRUCTURE results at (a) K=3, (b) K=4, and (c) K=5. At K=3 the inferred ancestries correspond largely to the major population groups (SL/SAS/INS, CHS/MAS, and CEU), as expected. Slight differences exist between the SL, SAS, and INS populations in the amount of admixture with European and Chinese ancestries. As K increases, none of the populations (SL/SAS/INS) can be clearly demarcated as a separate ancestry, consistent with other lines of evidence that these populations are very similar genetically. ADME, absorption, distribution, metabolism, and excretion; BEB, Bengali from Bangladesh; CEU, Utah residents with Northern and Western European ancestry; CHS, Chinese in Singapore; GIH, Gujarati Indians from Houston, Texas; INS, Indians in Singapore; MAS, Malays in Singapore; PJL, Punjabi from Lahore, Pakistan; SAS, South Asian; SL, Sri Lankan; SNP, single nucleotide polymorphism; STU, SL Tamils from the UK.
Next, we examined the SNPs with the highest level of differentiation within the SL populations, and between the SL population and other populations (see Tables, Supplemental digital contents 7–10, http://links.lww.com/FPC/A921, http://links.lww.com/FPC/A922, http://links.lww.com/FPC/A923, http://links.lww.com/FPC/A924). Among the most differentiated SNPs across the main population groups and between SL and SGVP populations are VKORC1 SNPs, associated with warfarin dose (Fig. 5c and d). However, within the SL and SAS populations, the MAFs of these SNPs were similar. Instead, SNPs in SLC13A3, ERCC5, HLA-E, ALDH3B1, and PCMT1, and MCM6, SFTA2, CYP4F12, and ACBG1 were the most differentiated within SL and between SL and SAS populations (Fig. 5a and b). Within the SL populations, SLC10A2 rs2301159, associated with increased risk for docetaxel toxicity, and ERCC1 rs3212986, associated with protection from cisplatin-induced nephrotoxicity, were the most differentiated (see Table, Supplemental digital content 7, http://links.lww.com/FPC/A921).
Fig. 5.
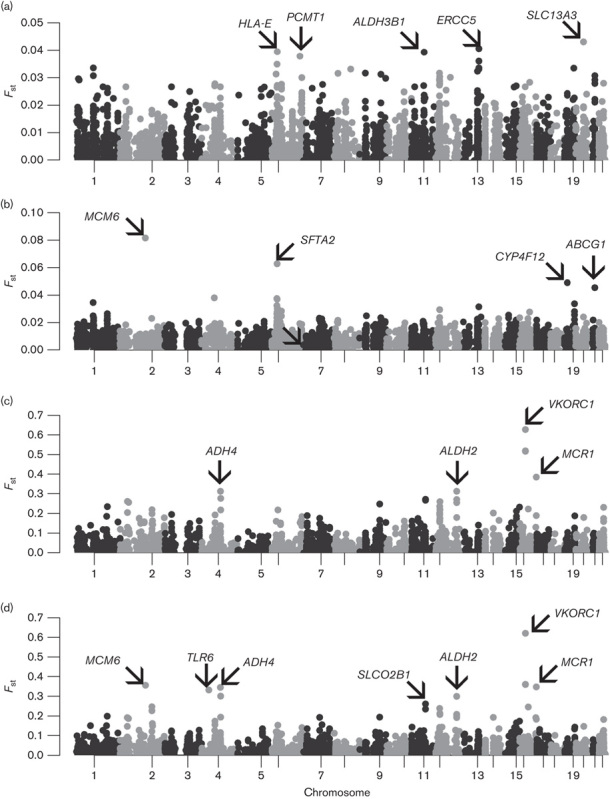
‘Manhattan’ plots of FST between the main population groups. Plots of FST for 5139 SNPs for comparisons across (a) only SL populations, (b) SL and SAS populations, (c) SL and SGVP populations, and (d) all populations, by chromosome and position. Genes in which SNPs with the highest FST reside are also indicated. SAS, South Asian; SGVP, Singapore Genome Variation Project; SL, Sri Lankan; SNP, single nucleotide polymorphism.
Pharmacogenomic diversity at PharmGKB clinically annotated SNPs
We next examined differentiation at clinically annotated SNPs from PharmGKB 21 (evidence level 1–2B) to determine differences in the frequencies of these key pharmacogenomic gene variants (Table 1). Across all populations, the clinically annotated variants with the greatest differentiation were in VKORC1, associated with warfarin dose requirement (rs9923231, rs9934438, rs17708472, rs2359612, rs2884737, FST=0.053–0.359). ABCG2 rs2231142 and SOD2 rs4880, associated with increased statin exposure and increased cyclophosphamide efficacy, respectively, also displayed moderate differentiation across the populations (FST=0.063 and 0.082, respectively).
Table 1.
Diversity of clinically important pharmacogenomic markers across Sri Lankan, Asian, and European populations
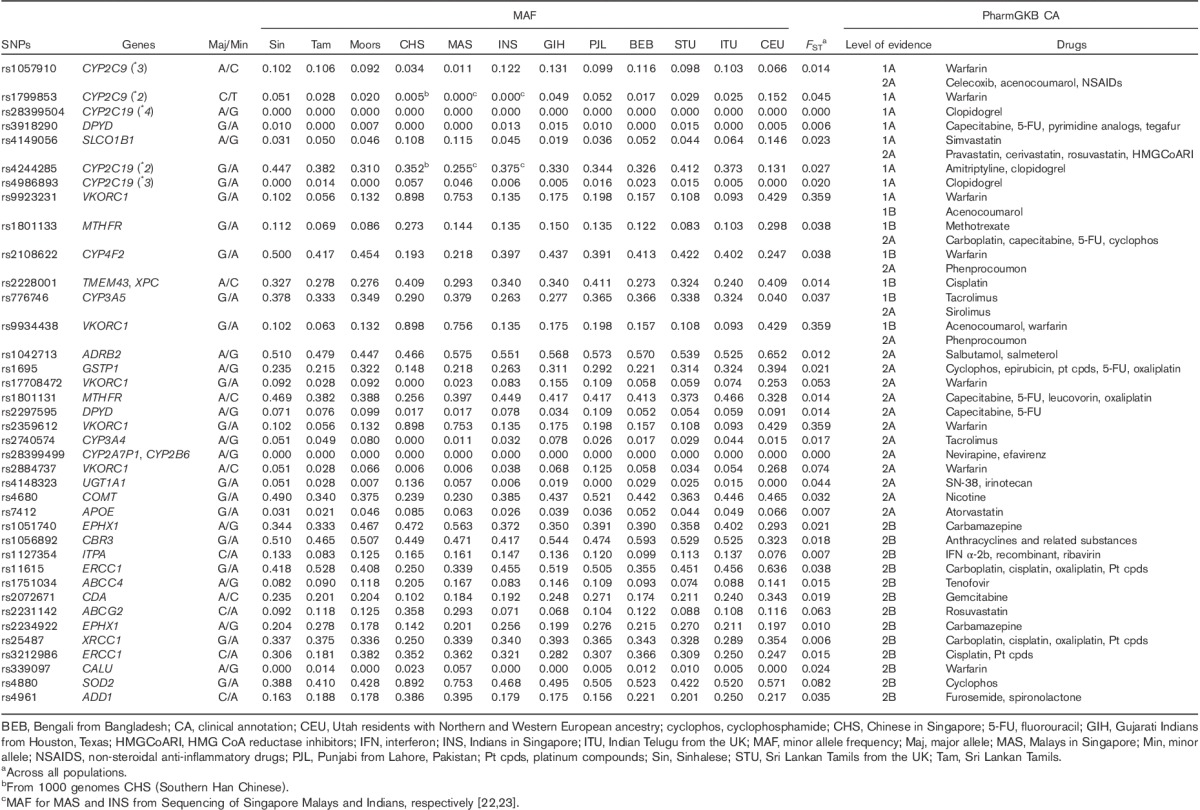
We also observed lower, but potentially clinically relevant, differentiation at VKORC1 SNPs within the SL populations. For example, rs9923231 was nearly twice as common in Moors (MAF 0.132) and Sinhalese (MAF 0.102) compared with SL Tamils (MAF 0.056; Table 1). There were also notable differences within the SL populations at ERCC1 rs3212986 and UGT1A1 rs4148323, associated with reduced platinum drug-induced nephrotoxicity and increased risk for irinotecan-induced neutropenia, respectively (Table 1). The MAF of these variants differed by 1–7-fold within the SL populations, with MAF of ERCC1 rs3212986 ranging from 0.181 (SL Tamils) to 0.382 (Moors) and MAF of UGT1A1 rs4148323 ranging from 0.007 (Moors) to 0.051 (Sinhalese). Comparing SL/SAS/INS and CHS/MAS, CYP4F2 rs2108622 (associated with lower warfarin dose requirements) and ADD1 rs4961 (associated with increased response to furosemide and spironolactone) showed substantial differences (MAFs in SL/SAS/INS vs. CHS/MAS ∼0.43 vs. ∼0.20 for rs2108622, and ∼0.19 vs. ∼0.39 for rs4961).
To gain further insight into how these results may influence the clinical use of warfarin in the SL populations, we examined genotype combinations of VKORC1 rs9923231, CYP2C9*2, and CYP2C9*3 variants, which collectively explain ∼40% of interindividual variation in warfarin dose requirement 24. About 60% of SL populations carries the GG *1/*1 genotype, similar to the SAS and INS populations (Fig. 6b). According to FDA-recommended genotype-guided dosing, more than 75% of SL populations is predicted to require a high starting dose of warfarin (5–7 mg/day), compared with 55% of CEU and only 16% of CHS (Fig. 6a). The overall distribution of genotype combinations in SL is similar to that in SL/SAS/INS, with ∼25% of these populations requiring low to mid warfarin doses. Given the substantial proportion of individuals requiring a high dose, these data suggest that use of a standard fixed dose for these populations is likely to be suboptimal.
Fig. 6.
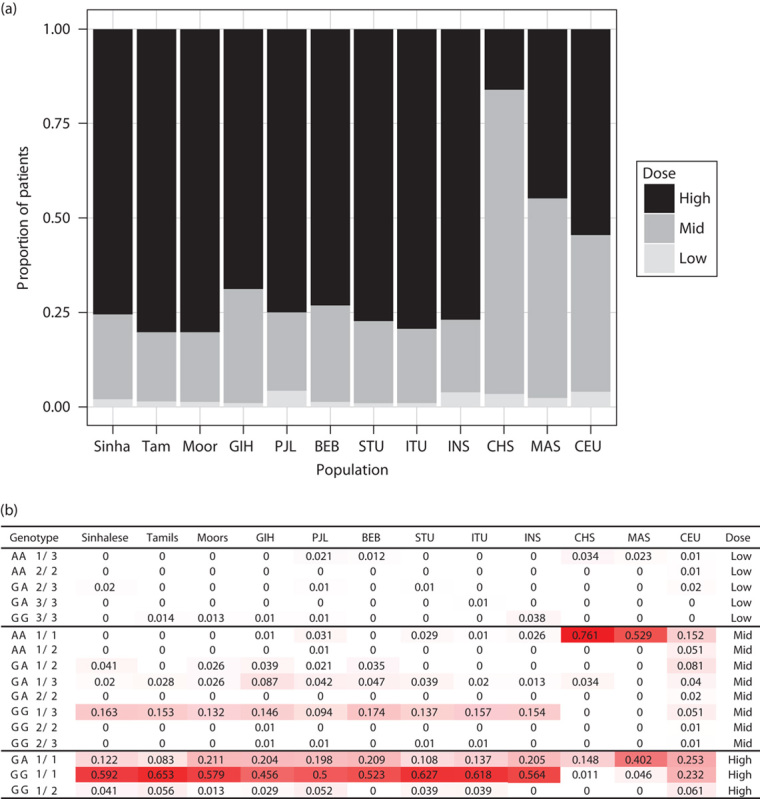
Warfarin dose requirements and frequencies of CYP2C9/VKORC1 genotype combinations in different populations. Predicted warfarin dose requirements (a) based on the recommended dose for different genotype combinations of VKORC1 and CYP2C9 variants in the CPIC guidelines (b). High: 5–7 mg/day, mid: 3–4 mg/day, low: 0.5–2 mg/day. In (b), genotype represents the VKORC1 –1639G>A (rs9923231) and CYP2C9 genotypes. †CYP2C9*2 was not available in CHS, MAS, and INS and was assumed to be absent. ‡Dose category is based on dosing guidelines in the Clinical Pharmacogenetics Implementation Consortium guidelines 22. The intensity of red highlighting of genotype combination frequencies corresponds to their magnitude across the range observed [i.e. 0 (white)–0.629 (red)]. BEB, Bengali from Bangladesh; CEU, Utah residents with Northern and Western European ancestry; CHS, Chinese in Singapore; GIH, Gujarati Indians from Houston, Texas; INS, Indians in Singapore; ITU, Indian Telugu from the UK; MAS, Malays in Singapore; PJL, Punjabi from Lahore, Pakistan; STU, SL Tamils from the UK.
We carried out a similar analysis to predict response to clopidogrel on the basis of the presence of CYP2C19*2 and *3 variants. Individuals who carry these low-activity variants have reduced conversion of clopidogrel to its active metabolite and an increased risk for stent thrombosis after percutaneous coronary intervention 25–30. We used the CYP2C19 allele frequency to estimate the proportion of individuals in each population who would be expected to have a good or poor response to clopidogrel (Fig. 7), according to the recommendations from the Clinical Pharmacogenetics Implementation Consortium guidelines 31. On the basis of the predicted CYP2C19 phenotype, we observed a nearly two-fold difference in the proportion of good responders within the SL populations, ranging from 24% among Sinhalese to 45% among Moors. In all SL populations, the proportion of good responders was substantially lower than that among CEU (76%; Fig. 7a). These suggest that a majority of SL patients would be expected to have a poor response to clopidogrel, and conversely, that the diagnostic yield of pharmacogenetic testing for CYP2C19 loss-of-function variants in this population would be high.
Fig. 7.
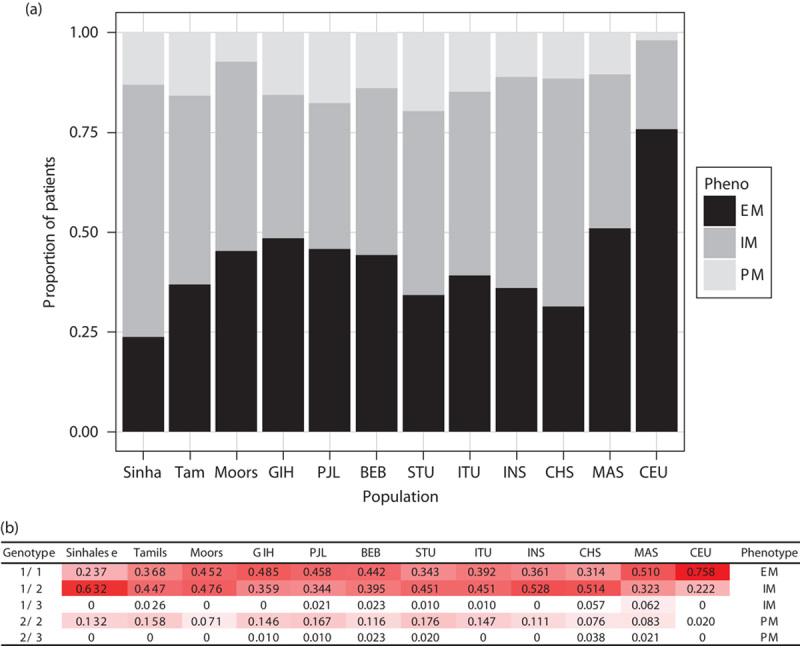
CYP2C19 phenotypes and genotype frequencies in the different populations. Predicted phenotype in terms of enzymatic activity of CYP2C19 (a) based on combinations of CYP2C19*2 and *3 variants (b). (a) Extensive metabolizers (EM) have normal platelet inhibition with clopidogrel, whereas intermediate metabolizers (IM) and poor metabolizers (PM) have reduced platelet inhibition. Alternative antiplatelets such as prasugrel or ticagrelor are recommended for patients who are IM or PM 31. Thus the black bars (EM) represent the proportion of patients who are expected to have good response to clopidogrel. (b) *Frequencies of genotype combinations for Sinhalese, Sri Lankan Tamils, and Moors were obtained from 118 participants (of 125 with DNA available) with successful TaqMan genotyping of CYP2C19*2 (rs4244285), those for MAS and INS were obtained from sequencing of Singapore Malays and Indians, respectively 23,32, and that for CHS was obtained from 1000 Genomes project (Southern Han Chinese). †Phenotypes were defined according to the Clinical Pharmacogenetics Implementation Consortium guidelines for clopidogrel. The intensity of red highlighting of genotype combination frequencies corresponds to their magnitude across the range observed [i.e. 0 (white)–0.758 (red)]. BEB, Bengali from Bangladesh; CEU, Utah residents with Northern and Western European ancestry; CHS, Chinese in Singapore; GIH, Gujarati Indians from Houston, Texas; INS, Indians in Singapore; ITU, Indian Telugu from the UK; MAS, Malays in Singapore; PJL, Punjabi from Lahore, Pakistan; STU, SL Tamils from the UK.
Discussion
We explored the pharmacogenomic diversity of the three major SL ethnic groups and compared them with other South Asian, South East Asian, and European populations. To our knowledge, this is the first study of pharmacogenomic diversity of SL population groups, as well as the most comprehensive population genetic study of these groups to date. Our results point to a high overall degree of similarity at pharmacogenomic loci within SL populations and with the SAS populations.
On a global level, we observed the greatest degree of differentiation at variants in VKORC1, ADH (alcohol dehydrogenase) genes, SLC (solute carrier family), and ABC (ATP-binding cassette) transporters. In most cases, the differentiation was driven by differences with the CHS, MAS, and CEU populations (see Tables, Supplemental digital content 9, http://links.lww.com/FPC/A923 and Supplemental digital content 10, http://links.lww.com/FPC/A924). This is consistent with previous data that have also indicated that variants in these genes are the most differentiated among CHS, MAS, INS, and CEU populations 5. This finding has immediate relevance for warfarin pharmacogenomics in SLs. On the basis of the genotype combination of the three established VKORC1 and CYP2C9 alleles, we estimate that more than 75% of SLs would require high warfarin doses, and about 20% would require an intermediate dose (Fig. 6a). Recent clinical trials of genotype-guided dosing of warfarin have suggested that this strategy is superior to standard dosing in some populations 33, but they have also suggested that the benefit may differ across population groups 34. On the basis of the genetic diversity at the VKORC1 and CYP2C9 loci in SAS populations, our data suggest that a fixed dose strategy is unlikely to be optimal and highlight the need for studies comparing fixed and genotype-guided warfarin dosing in SL or other South Asian populations.
Between the SL and SAS populations, few SNPs displayed moderate or greater levels of differentiation (MCM6 rs4988235, SFTA2 rs3131787, CYP4F12 rs609290, ABCG1 rs225434). Differentiation at these loci was driven primarily by differences with PJL and GIH populations (see Table, Supplemental digital content 8, http://links.lww.com/FPC/A922). More SNPs were moderately differentiated between SL and GIH or PJL populations than between SL and BEB, STU, or ITU, a pattern that mirrors the subtle shift of GIH and PJL away from the other SL and SAS populations on the PCA plots (Fig. 2 and Figure, Supplemental digital content 6, http://links.lww.com/FPC/A920). However, most of these highly differentiated SNPs have not been assigned a high level of evidence for association with drug response, and the implication of these differences therefore requires future research. Although the SL populations themselves generally showed high levels of similarity at pharmacogenomic alleles, two clinically important SNPs showed moderate or high levels of differentiation. These include SLC10A2 rs2301159, which is associated with an increased risk for docetaxel toxicity and was twice as common in SL Tamils and Moors compared with Sinhalese (MAF=0.264, 0.237, and 0.092, respectively), and ERCC1 rs3212986, which is associated with a reduced risk for cisplatin nephrotoxicity and was nearly twice as common in Sinhalese and Moors compared with SL Tamils (MAF=0.306, 0.382, and 0.181, respectively; see Table, Supplemental digital content 7, http://links.lww.com/FPC/A921).
Correlating MAFs of risk variants with their associated ADRs would offer empirical evidence of the validity of inferring response and ADR risk from frequencies of risk variants. SL populations are reported to have high rates of cisplatin-induced nephrotoxicity 35 compared with the rates reported in European populations 35,36. However, to the best of our knowledge, no previous study has examined differences in the rates of cisplatin-induced nephrotoxicity within SL population groups. Future studies exploring cisplatin ADR risk within SL populations are warranted.
Asian populations are generally thought to be more sensitive to docetaxel than Caucasians, requiring lower doses and experiencing higher rates of febrile neutropenia (FN) 37. The reported prevalence of docetaxel-induced FN in Indian populations (3–39%) is similar to that reported in Chinese populations (2–42%) and is higher than that reported in European populations (5–23%), showing rough correspondence to the frequency of the rs2301159 risk allele in these three population groups (0.25, 0.295, and 0.182 in INS, CHS, and CEU, respectively; see Table, Supplemental digital content 11, http://links.lww.com/FPC/A925). On the basis on the observed differentiation of rs2301159 within SL populations, we hypothesize that the Tamil and Moor populations would be at a higher risk for docetaxel-induced FN compared with the Sinhalese population.
Clopidogrel has been identified as a high-priority drug for clinical implementation of pharmacogenomic testing 38. Pharmacogenomic implementation guidelines recommend that carriers of the CYP2C19 loss-of-function alleles *2 and *3 receive an alternative antiplatelet drug, for example, prasugrel or ticagrelor 31. We observed that the frequency of *2 in the SL populations was 31–45%, with the highest frequency among Sinhalese. This is comparatively higher than a MAF of only 13% in the CEU population (Table 1). Collectively, more than 60% of SL individuals had a non-*1/*1 genotype, compared with less than 25% of CEU individuals (Fig. 7b). Consistent with these observations, South Asians have been reported to have higher residual platelet reactivity (suggesting poorer response) after receiving clopidogrel compared with Caucasians 39. Although this suggests a correspondence between the proximal pharmacodynamic effects of clopidogrel and the CYP2C19 phenotype in South Asian populations, additional studies will be necessary to determine whether this leads to adverse cardiovascular outcomes in these populations. These data provide impetus to incorporate CYP2C19 genotyping into antiplatelet drug treating strategies in SL, as the strategy of using only clopidogrel is predicted to result in a suboptimal antiplatelet effect in the majority of the population. Additional training and capacity-building in genomics may aid in the clinical translation of these results 40.
There are several limitations to our study. First, clinical information on drug responses in SL ethnic groups is very limited. Future studies will be necessary to better understand how the differences in allele frequency that we have observed contribute to differences in drug response in these populations. Second, we did not perform high-resolution typing of HLA alleles as part of this study. Future focused studies on the frequency of important HLA alleles in the SL populations are warranted. Finally, the genotyping-based approach that we undertook provides important data on a large number of alleles, but it does not allow discovery of novel variants that may be unique to the SL populations. Future sequencing-based studies to examine novel and rare variants in the SL populations will complement the data that we have generated.
Conclusion
We have surveyed more than 7000 variants in ADME genes in the three major SL ethnic groups and compared them with other South Asian, South East Asian, and European populations. Our results show, for the first time, an overall high level of genetic similarity among the major SL ethnic groups, as well as between SL and the SAS populations. We also identified specific variants that are highly differentiated between the SL and CHS/MAS and CEU populations. These results extend our understanding of pharmacogenomic diversity to the South Asian populations, and this study is the largest population genetic study of the SL population to date. These data have implications for the clinical use of pharmacogenomic testing in SL, and provide a resource for future clinical, regulatory, and research activities in pharmacogenomics in these populations.
Supplementary Material
Acknowledgements
This study was supported by the Biomedical Research Council of the Agency for Science, Technology, and Research of Singapore and by the National University of Singapore. L.R.B. received grant support, clinician-scientist new investigator grant, from the National Medical Research Council of Singapore.
Conflicts of interest
There are no conflicts of interest.
Footnotes
Supplemental digital content is available for this article. Direct URL citations appear in the printed text and are provided in the HTML and PDF versions of this article on the journal's website (www.pharmacogeneticsandgenomics.com).
References
- 1.Limdi NA, Wadelius M, Cavallari L, Eriksson N, Crawford DC, Lee M-TM, et al. Warfarin pharmacogenetics: a single VKORC1 polymorphism is predictive of dose across 3 racial groups. Blood 2010; 115:3827–3834. [DOI] [PMC free article] [PubMed] [Google Scholar]
- 2.Lee S-C, Ng S-S, Oldenburg J, Chong P-Y, Rost S, Guo J-Y, et al. Interethnic variability of warfarin maintenance requirement is explained by VKORC1 genotype in an Asian population. Clin Pharmacol Ther 2006; 79:197–205. [DOI] [PubMed] [Google Scholar]
- 3.Man M, Farmen M, Dumaual C, Teng CH, Moser B, Irie S, et al. Genetic Variation in Metabolizing Enzyme and Transporter Genes: Comprehensive Assessment in 3 Major East Asian Subpopulations With Comparison to Caucasians and Africans. J Clin Pharmacol 2010; 50:929–940. [DOI] [PubMed] [Google Scholar]
- 4.Ramos E, Doumatey A, Elkahloun AG, Shriner D, Huang H, Chen G, et al. Pharmacogenomics, ancestry and clinical decision making for global populations. Pharmacogenomics J 2014; 14:217–222. [DOI] [PubMed] [Google Scholar]
- 5.Brunham LR, Chan SL, Li R, Aminkeng F, Liu X, Saw WY, et al. Pharmacogenomic diversity in Singaporean populations and Europeans. Pharmacogenomics J 2014; 14:555–563. [DOI] [PubMed] [Google Scholar]
- 6.Aminkeng F, Ross CJD, Rassekh SR, Brunham LR, Sistonen J, Dube M-P, et al. Higher frequency of genetic variants conferring increased risk for ADRs for commonly used drugs treating cancer, AIDS and tuberculosis in persons of African descent. Pharmacogenomics J 2014; 14:160–170. [DOI] [PMC free article] [PubMed] [Google Scholar]
- 7.Tekola-Ayele F, Adeyemo A, Aseffa A, Hailu E, Finan C, Davey G, et al. Clinical and pharmacogenomic implications of genetic variation in a Southern Ethiopian population. Pharmacogenomics J 2015; 15:101–108. [DOI] [PMC free article] [PubMed] [Google Scholar]
- 8.World Bank. Total population data. Available at: http://data.worldbank.org/indicator/SP.POP.TOTL. [Accessed 28 January 2015].
- 9.Kennedy KAR, Deraniyagala SU. Fossil remains of 28,000-year-old hominids from Sri Lanka. Curr Anthropol 1989; 30:394. [Google Scholar]
- 10.Sri Lanka Department of Census & Statistics. Population by ethnic group. Available at: http://sis.statistics.gov.lk/statHtml/statHtml.do?orgId=144&tblId=DT_POP_SER_267&conn_path=I2. [16 March 2015]. [Google Scholar]
- 11.Kshatriya GK. Genetic affinities of Sri Lankan populations. Hum Biol 1995; 67:843–866. [PubMed] [Google Scholar]
- 12.Malavige GN, Rostron T, Seneviratne SL, Fernando S, Sivayogan S, Wijewickrama A, et al. HLA analysis of Sri Lankan Sinhalese predicts North Indian origin. Int J Immunogenet 2007; 34:313–315. [DOI] [PubMed] [Google Scholar]
- 13.Saha N. Blood genetic markers in Sri Lankan populations – reappraisal of the legend of Prince Vijaya. Am J Phys Anthropol 1988; 76:217–225. [DOI] [PubMed] [Google Scholar]
- 14.Papiha SS, Mastana SS, Jayasekara R. Genetic variation in Sri Lanka. Hum Biol 1996; 68:707–737. [PubMed] [Google Scholar]
- 15.Ranaweera L, Kaewsutthi S, Win Tun A, Boonyarit H, Poolsuwan S, Lertrit P. Mitochondrial DNA history of Sri Lankan ethnic people: their relations within the island and with the Indian subcontinental populations. J Hum Genet 2014; 59:28–36. [DOI] [PubMed] [Google Scholar]
- 16.Teo Y-Y, Sim X, Ong RTH, Tan AKS, Chen J, Tantoso E, et al. Singapore Genome Variation Project: a haplotype map of three Southeast Asian populations. Genome Res 2009; 19:2154–2162. [DOI] [PMC free article] [PubMed] [Google Scholar]
- 17.R Core Team. R: a language and environment for statistical computing. R Foundation for Statistical Computing. 2014. Available at: https://www.r-project.org/. [Accessed 1 May 2014].
- 18.Aulchenko YS, Ripke S, Isaacs A, van Duijn CM. GenABEL: an R library for genome-wide association analysis. Bioinformatics 2007; 23:1294–1296. [DOI] [PubMed] [Google Scholar]
- 19.Wright S. Evolution and the genetics of populations. Variability within and among natural populations. Chicago: University of Chicago Press; 1978; 4:590. [Google Scholar]
- 20.Falush D, Stephens M, Pritchard JK. Inference of population structure using multilocus genotype data: linked loci and correlated allele frequencies. Genetics 2003; 164:1567–1587. [DOI] [PMC free article] [PubMed] [Google Scholar]
- 21.Whirl-Carrillo M, McDonagh EM, Hebert JM, Gong L, Sangkuhl K, Thorn CF, et al. Pharmacogenomics knowledge for personalized medicine. Clin Pharmacol Ther 2012; 92:414–417. [DOI] [PMC free article] [PubMed] [Google Scholar]
- 22.Johnson JA, Gong L, Whirl-Carrillo M, Gage BF, Scott SA, Stein CM, et al. Clinical Pharmacogenetics Implementation Consortium guidelines for CYP2C9 and VKORC1 genotypes and warfarin dosing. Clin Pharmacol Ther 2011; 90:625–629. [DOI] [PMC free article] [PubMed] [Google Scholar]
- 23.Wong LP, Ong RT, Poh WT, Liu X, Chen P, Li R, et al. Deep whole-genome sequencing of 100 southeast Asian Malays. Am J Hum Genet 2013; 92:52–66. [DOI] [PMC free article] [PubMed] [Google Scholar]
- 24.Pirmohamed M, Kamali F, Daly AK, Wadelius M. Oral anticoagulation: a critique of recent advances and controversies. Trends Pharmacol Sci 2015; 36:153–163. [DOI] [PubMed] [Google Scholar]
- 25.Mega JL, Close SL, Wiviott SD, Shen L, Hockett RD, Brandt JT, et al. Cytochrome p-450 polymorphisms and response to clopidogrel. N Engl J Med 2009; 360:354–362. [DOI] [PubMed] [Google Scholar]
- 26.Simon T, Verstuyft C, Mary-Krause M, Quteineh L, Drouet E, Méneveau N, et al. Genetic determinants of response to clopidogrel and cardiovascular events. N Engl J Med 2009; 360:363–375. [DOI] [PubMed] [Google Scholar]
- 27.Shuldiner AR, O’Connell JR, Bliden KP, Gandhi A, Ryan K, Horenstein RB, et al. Association of cytochrome P450 2C19 genotype with the antiplatelet effect and clinical efficacy of clopidogrel therapy. JAMA 2009; 302:849–857. [DOI] [PMC free article] [PubMed] [Google Scholar]
- 28.Giusti B, Gori AM, Marcucci R, Saracini C, Sestini I, Paniccia R, et al. Relation of cytochrome P450 2C19 loss-of-function polymorphism to occurrence of drug-eluting coronary stent thrombosis. Am J Cardiol 2009; 103:806–811. [DOI] [PubMed] [Google Scholar]
- 29.Sibbing D, Stegherr J, Latz W, Koch W, Mehilli J, Dörrler K, et al. Cytochrome P450 2C19 loss-of-function polymorphism and stent thrombosis following percutaneous coronary intervention. Eur Heart J 2009; 30:916–922. [DOI] [PubMed] [Google Scholar]
- 30.Cayla G, Hulot J-S, O’Connor SA, Pathak A, Scott SA, Gruel Y, et al. Clinical, angiographic, and genetic factors associated with early coronary stent thrombosis. JAMA 2011; 306:1765–1774. [DOI] [PubMed] [Google Scholar]
- 31.Scott SA, Sangkuhl K, Stein CM, Hulot J-S, Mega JL, Roden DM, et al. Clinical Pharmacogenetics Implementation Consortium guidelines for CYP2C19 genotype and clopidogrel therapy: 2013 update. Clin Pharmacol Ther 2013; 94:317–323. [DOI] [PMC free article] [PubMed] [Google Scholar]
- 32.Wong LP, Lai JK, Saw WY, Ong RT, Cheng AY, Pillai NE, et al. Insights into the genetic structure and diversity of 38 South Asian Indians from deep whole-genome sequencing. PLoS Genet 2014; 10:e1004377. [DOI] [PMC free article] [PubMed] [Google Scholar]
- 33.Pirmohamed M, Burnside G, Eriksson N, Jorgensen AL, Toh CH, Nicholson T, et al. A randomized trial of genotype-guided dosing of warfarin. N Engl J Med 2013; 369:2294–2303. [DOI] [PubMed] [Google Scholar]
- 34.Kimmel SE, French B, Kasner SE, Johnson JA, Anderson JL, Gage BF, et al. A pharmacogenetic versus a clinical algorithm for warfarin dosing. N Engl J Med 2013; 369:2283–2293. [DOI] [PMC free article] [PubMed] [Google Scholar]
- 35.Kumara K, Sivakanesan R, Weerasingha S. Renal toxicity of cisplatin in patients with head and neck cancer in Sri Lanka. Proceedings of the Peradeniya Univ International Research Sessions, Sri Lanka 2014; 18:343. [Google Scholar]
- 36.Planting AS, van der Burg ME, de Boer-Dennert M, Stoter G, Verweij J. Phase I/II study of a short course of weekly cisplatin in patients with advanced solid tumours. Br J Cancer 1993; 68:789–792. [DOI] [PMC free article] [PubMed] [Google Scholar]
- 37.Ling WH, Lee SC. Inter-ethnic differences-how important is it in cancer treatment? Ann Acad Med Singapore 2011; 40:356–361. [PubMed] [Google Scholar]
- 38.Pulley JM, Denny JC, Peterson JF, Bernard GR, Vnencak-Jones CL, Ramirez AH, et al. Operational implementation of prospective genotyping for personalized medicine: the design of the Vanderbilt PREDICT project. Clin Pharmacol Ther 2012; 92:87–95. [DOI] [PMC free article] [PubMed] [Google Scholar]
- 39.Baber U, Bander J, Yadav K, Kini AS, Badimon JJ, Karajgikar R, et al. Impact of self-reported ethnicity on response to clopidogrel in patients undergoing percutaneous coronary intervention. Circulation 2010; 122 (21 Suppl):A20850. [Google Scholar]
- 40.Dandara C, Huzair F, Borda-Rodriguez A, Chirikure S, Okpechi I, Warnich L, et al. H3Africa and the African life sciences ecosystem: building sustainable innovation. OMICS 2014; 18:733–739. [DOI] [PMC free article] [PubMed] [Google Scholar]
Associated Data
This section collects any data citations, data availability statements, or supplementary materials included in this article.


