

Abstract
Tumor hemodynamics of carcinogenic hepatocytes nodules, that is, low grade dysplastic nodules, high grade dysplastic nodules, early hepatocellular carcinomas (HCCs), and progressed HCCs, change during multistep dedifferentiation of the nodules. Morphometric analyses of inflow vessels of these nodules indicate that the portal veins of carcinogenic hepatocyte nodules monotonically decrease whereas the arteries bitonically change, first decrease and then increase. Findings on imaging techniques depicting these changes in tumor blood inflows, especially intra-arterial contrast-enhanced computed tomography, closely related not only to the histological differentiation of the nodules but also to the outcomes of the nodules. Histological analyses of connections between the vessels within the tumors and those in the surrounding livers and findings on imaging techniques indicate that drainage vessels of HCC change from hepatic veins to hepatic sinusoids and then to portal veins during multistep hepatocarcinogenesis. Understanding of tumor hemodynamics through radio-pathological correlations will be helpful in drawing up therapeutic strategies for carcinogenic hepatocyte nodules arising in cirrhosis.
1. Introduction
A stepwise model of development, from well-differentiated precursors to poorly differentiated progressed hepatocellular carcinomas (HCCs), is well established by evidences accumulated in the past three decades. In 1995 and 2009, international reproducible criteria for the diagnosis of nodular lesions of hepatocarcinogenesis were developed by the remarkable endeavors of the East and the West pathologists. At present, the criteria involve not only pathologic but also radiologic features, especially hemodynamic findings. For example, progressed HCCs are defined as radiologically hypervascular lesions without portovenous supply which histologically appear moderately or poorly differentiated; early HCCs and dysplastic nodules are defined as iso- or hypovascular lesions with portovenous supply on radiological images which appear well differentiated on histology [1, 2]. Thus, an intimate knowledge of the relations between tumor hemodynamics and hepatocarcinogenesis would be useful for the management of carcinogenic nodules as well as for the better understanding of multistep models of hepatocarcinogenesis. This review focuses on radiologic hemodynamic features of carcinogenic hepatocyte nodules arising from cirrhotic livers, that is, dysplastic nodules, early HCCs, and progressed HCCs, paying close attention to radio-pathological correlations and outcomes of the nodules.
2. Tumor Blood Inflows and Hepatocarcinogenesis
2.1. Pathology of Tumor Blood Inflows
On histology, the blood circulation is not kinetically depicted, but tumor blood inflows can still be analyzed through the quantification of the inflow vessels with morphometric technique. The pathology of inflows of carcinogenic hepatocyte nodules has been morphometrically evaluated by two methods:counting the number of inflows vessels and measuring the luminal area of them. There are three types of inflow vessels of carcinogenic hepatocyte nodules—portal vein, hepatic artery, and abnormal artery which are termed unpaired or nontriadal arteries (Figures 1 and 2) [3–10]. The former two ones, portal vein and hepatic artery, are accompanied by bile ducts running within the portal tracts, whereas the last, unpaired artery, is not accompanied by bile ducts or portal veins independently running outside of portal tracts. It is now considered that the unpaired arteries are new vessels developed through neovascularization during hepatocarcinogenesis [3–10].
Figure 1.

Photomicrograph of hepatic arteries and portal venules as inflow vessels in a portal tract within an early hepatocellular carcinoma stained with hematoxylin, eosin,and Victoria blue (Bar = 300 μm) (a) and converted monochrome image of the same photomicrograph in conjunction with annotations of colored vessels, bile ductules, and limiting plates of the portal tract (b).
Figure 2.
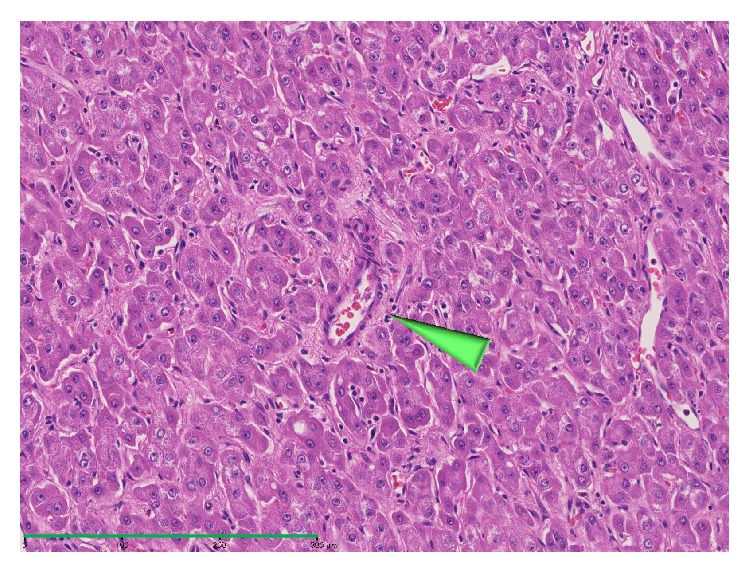
Photomicrograph of an unpaired artery unaccompanied by any bile ducts within a progressed hepatocellular carcinoma (arrowhead, hematoxylin and eosin, Bar = 300 μm).
The inflow vessels in the carcinogenic nodules of the liver have been histomorphometrically quantified by counting the number of vessels in the unit area:vessel density. During dedifferentiation of the nodules, portovenous densities of the nodules decrease whereas arterial densities of the nodules increase [3–10]. The portovenous densities within dysplastic nodules are lower than those within the liver [3, 9].The arterial densities of low grade dysplastic nodules are almost as high as those of the surrounding livers; those of high grade dysplastic nodules are also almost as high as those of the livers; those of progressed HCCs are much higher than those of the livers. The proportions of the numbers of unpaired arteries to those of total arteries increase during the dedifferentiation.
Measuring luminal areas of the vessels is more recommendable than counting their number although the former is much more laborious than the latter, because luminal areas reflect angiography more accurately than numbers [3]. The portovenous luminal areas of low grade dysplastic nodules per unit area are as large as those of the surrounding livers; those of high grade dysplastic nodules are smaller than those of the livers; those of progressed HCCs are almost null. The arterial luminal areas of low grade dysplastic nodules per unit area are slightly smaller than those of the livers; those of high grade dysplastic nodules are smaller than those of the livers; those of progressed HCCs are much larger than those of the livers. The proportions of unpaired arteries to total arteries of low grade dysplastic nodules in luminal area are small, those of high grade dysplastic nodules are moderate, and those of progressed HCCs are almost 100%. To summarize, during the dedifferentiation, the portovenous areas of carcinogenic hepatocyte nodules monotonically decrease whereas the arterial areas bitonically change, first decrease because hepatic arterial areas decrease and then increase because unpaired arterial areas increase (Figure 3) [3]. Hepatocyte nodules with smaller portovenous areas and the same arterial areas to the surrounding livers are just on the final stage of high grade dysplastic nodules transiting to progressed HCCs [3].
Figure 3.
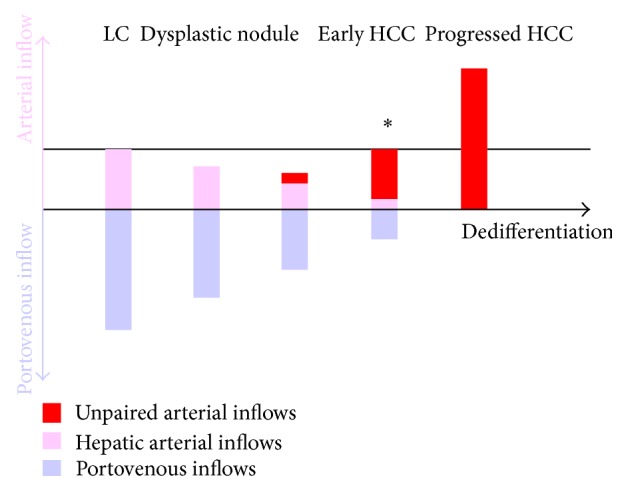
Outlines of measuring luminal areas of inflow vessels of carcinogenic hepatocyte nodules. Nodules with smaller portovenous areas and the same arterial areas to the surrounding livers (∗) are just on the final stage of high grade dysplastic nodules transiting to progressed HCCs.
2.2. Imaging Techniques for Evaluations of Tumor Blood Inflows
Tumor blood inflows, both portovenous and arterial, can be evaluated with imaging techniques. There are two techniques for evaluation of tumor portovenous inflows: Doppler sonography [11] and CT during arterial portography (CTAP) [12]. With Doppler sonography, inflows in some large portovenous branches in tumors may be visualized, but portovenous perfusions cannot be evaluated. With CTAP, tumor portovenous perfusions can be evaluated not only qualitatively but semiquantitatively [13–15]. For example, we can tell that a portovenous perfusion of a nodule is null or reduced. In addition, we can identify the perfusion difference between nodules and the surrounding livers. Moreover, with CTAP, portovenous perfusions can be determined separately from arterial perfusions. Thus, CTAP should be applied in patients with carcinogenic hepatocyte nodules as principal technique to confirm the portovenous inflows of the nodules.
There are six imaging techniques for evaluation of tumor arterial inflows: Doppler sonography as noncontrast imaging [11, 16], contrast sonography with perfluorobutane microbubbles [17–19], dynamic contrast-enhanced CT and dynamic contrast-enhanced MR imaging as intravenous contrast enhanced imaging, sonography with carbon dioxide microbubbles, and CT during hepatic arteriography (CTHA) as intra-arterial contrast-enhanced imaging. Among these techniques, CTHA is the best suited to the understanding of the complex hemodynamic interactions in an organ with a dual blood inflow since it depicts both the lesions and the livers free from portovenous enhancement and also avoids improper scan delays that occasionally occur in dynamic contrast-enhanced CT or MR imaging.
2.3. Radiological Evaluations of Tumor Blood Inflows and Grades of the Tumors
Imaging techniques illustrate the relations, mentioned in “Section 2.1”, between tumor blood inflows and histological grades in carcinogenic hepatocyte nodules [14, 20, 21]. The attenuations of the nodules on CTAP decrease during dedifferentiation of the nodules: low grade dysplastic nodules show isoattenuating; high grade dysplastic nodules and early HCCs show isoattenuating or slightly hypoattenuating; progressed HCCs show hypoattenuating(Figures 4 and 5). The attenuations of the nodules on CTHA first decrease and then increase: low grade dysplastic nodules show isoattenuating or slightly hypoattenuating; high grade dysplastic nodules and early HCCs show hypoattenuating or isoattenuating; progressed HCCs exclusively show hyperattenuating (Figures 4 and 5). It is noteworthy that high grade dysplastic nodules and/or early HCCs harboring progressed HCCs in nodule-in-nodule fashion are demonstrated on CTAP as isoattenuating or slightly hypoattenuating nodules carrying internal definite hypoattenuating foci, but as hypo- or isoattenuating nodules containing hyperattenuating nodules on CTHA (Figure 6).
Figure 4.

A high grade dysplastic nodule in a 65-year-old man. (a) CTAP image shows a hypoattenuating nodule (arrowhead). (b) The nodule shows hypoattenuating on CTHA image (arrowhead).
Figure 5.

An early HCC in a 76-year-old man. (a) CTAP image shows a hypoattenuating nodule (arrowhead). (b) The nodule shows isoattenuating (= invisible) on CTHA image (arrowhead).
Figure 6.

A high grade dysplastic nodule (red arrowheads) harboring a progressed HCC (green arrowheads) in nodule-in-nodule fashion in a 78-year-old woman. (a) CTAP shows a tiny hypoattenuating nodule in an isoattenuating (= invisible) nodule. (b) The tiny nodule shows hyperattenuating within a hypoattenuating nodule on CTHA image.
Tumor arterial inflows via unpaired arteries cannot be differentiated from those via hepatic arteries by radiological imaging. However, when an isointense nodule on CTHA is depicted as a hypointense nodule on CTAP, the nodule can be interpreted as receiving arterial inflows via unpaired arteries and on the final stage of dysplastic nodule just before progressed HCC (Figure 3).
Although CTAP and CTHA are rather invasive, they are applied as principal techniques for diagnoses of carcinogenic hepatocyte nodules because intravenous contrast enhanced CT is relatively insensitive not only for detection but also for the characterization of these nodules [22, 23]. It is reported that seven dysplastic nodules were categorized as hypoattenuating or isoattenuating on arterial phase CT, but another dysplastic nodule was hyperattenuating; therefore, incorrectly categorized as progressed HCC; 31 progressed HCCs were hyperattenuating and correctly categorized but one progressed HCC was incorrectly categorized as dysplastic nodule [22]. These results correspond with another report [23].
Evaluation of arterial inflows of dysplastic nodules by dynamic contrast enhanced MR imaging is often difficult because dysplastic nodules are generally hyperintense on noncontrast T1-weighted images [24–26]. However, a progressed HCC harbored by dysplastic nodule is depicted as a hyperintense nodule within a hypointense or isointense nodule on arterial phase images.
2.4. Tumor Blood Inflows and Outcomes of the Tumors
The outcomes of the carcinogenic hepatocyte nodules can be predicted when both portovenous and arterial inflows are evaluated by CTAP and CTHA, respectively, [15]. No nodules which are isoattenuating on both CTAP and on CTHA became progressed HCCs; approximately 30% of the nodules showing slightly hypoattenuating on both CTAP and CTHA became progressed HCCs after two years. On the other hand, approximately 90% of the nodules carrying hypoattenuating foci on CTAP and hyperattenuating foci on CTHA became entirely hypervascular progressed HCCs after two years (Figure 7). Reduced portal blood flow in the nodule on CTAP is one of the most important predictors for development of progressed HCC (Figure 8) [27].
Figure 7.

A nodule carrying hypoattenuating focus on CTAP (a) which showed hyperattenuating on CTHA (b) in an 80-year-old woman became entirely hypervascular progressed HCCs ((c), (d)) after 13 months later.
Figure 8.

A slightly hypoattenuating nodule on CTAP (a) and CTHA (b) in an 81-year-old woman shows hypoattenuating on CTAP (c) and isoattenuating (d) on CTHA after 16 months later. The nodule shows hypoattenuating on CTAP (e) and slightly hyperattenuating on CTHA (f) after 35 months later from the baseline ((a), (b)).
3. Tumor Blood Outflows and Hepatocarcinogenesis
3.1. Pathology of Tumor Blood Outflows
On histology, tumor blood outflows can be speculated through the connections between the vessels within the tumors (capillarized intratumoral sinusoids) and those in the surrounding livers [28]. There are three types of growth patterns in HCCs, namely, replacing growth (Figure 9), compressing growth without capsule (Figure 10), and that with capsule (Figure 11). Replacing growth is seen both in hypovascular early HCCs and in some well differentiated progressed HCCs. Hypovascular early HCC with replacing growth carry more hepatic veins in and around themselves connected with intratumoral blood sinusoids than hypervascular progressed HCCs. Nodules with compressing growth can be classified into two types: nodules without capsule and those with capsule. The former type carries intranodular capillarized sinusoids connected directly to the surrounding hepatic sinusoids and partly to extranodular portal veins. The latter carries intranodular capillarized sinusoids connected to portal venules within the capsule but not directly to the surrounding hepatic sinusoids. Intra- or perinodular hepatic venules decrease in accordance with the grade of malignancy of the nodules and usually no intratumoral hepatic venules are observed in encapsulated HCCs. In poorly differentiated HCCs with invasive growth to the surrounding liver, these connections are not well analyzed and may be more complicated.
Figure 9.

Photomicrograph of tumor front of a high grade dysplastic nodule showing replacing growth stained with hematoxylin and eosin (Bar = 100 μm) (a) and converted monochrome image of the same photomicrograph in conjunction with annotations of colored fronts (b).
Figure 10.

Photomicrograph of tumor front of a progressed HCC showing compressing growth without capsule stained with hematoxylin and eosin (Bar = 800 μm) (a) and converted monochrome image of the same photomicrograph in conjunction with annotations of colored vessels (b). Intranodular capillarized sinusoids connected directly to the surrounding hepatic sinusoids and partly to extranodular portal veins.
Figure 11.

Photomicrograph of tumor front of a progressed HCC showing compressing growth with capsule stained with hematoxylin and eosin (Bar = 2000 μm) (a) and converted monochrome image of the same photomicrograph in conjunction with annotations of colored vessels (b). Intranodular capillarized sinusoids connected to portal venules within the capsule but not directly to the surrounding hepatic sinusoids.
3.2. Imaging Techniques for Evaluations of Tumor Blood Outflows
There are five imaging techniques for evaluations of tumor blood outflow: single-level dynamic CTHA [29, 30], biphasic CTHA [31], contrast sonography with perfluorobutane microbubbles [32], intravenous dynamic contrast enhanced CT, and intravenous dynamic contrast enhanced MR imaging [26, 33, 34]. Single-level dynamic CTHA, the first technique which demonstrated the tumor blood outflow ever, is the principal technique kinetically depicting both inflow and outflow at one time with the highest temporal resolution. Images can be obtained with 30- to 40-second continuous acquisition without table increment under intrahepatic arterial injection of a small amount of contrast material, for example, 10 mL of 300–370 mgI/mL at a rate of 1.0 mL/sec. Biphasic CTHA is the second technique for evaluations of tumor blood outflow, which covers the whole liver and multiple lesions. Images are obtained with two whole-liver acquisitions at following delays: 10 seconds after start of intrahepatic arterial injection of contrast material of 30 mL of 300–370 mgI/mL at a rate of 1.0 mL/sec for first scan (early phase CTHA) and 60 seconds after start of injection for second scan (late phase CTHA). We can evaluate the arterial inflows with the first scan and the sequential outflows with the second scan. With the remaining three techniques, contrast sonography with perfluorobutane microbubbles, intravenous dynamic contrast enhanced CT, and MR imaging, we can also estimate the outflows, but the reproducibilities and accuracies of the evaluations are much reduced compared with the former two techniques.
3.3. Radiological Evaluations of Tumor Blood Outflows and Growth Pattern of the Tumors
Radiological findings of tumor blood outflows of the carcinogenic hepatocyte nodules depend on the channels of blood drainage: hepatic veins, sinusoid, or portal veins [28]. A nodule shows isoattenuation or slight hypoattenuation on CTAP and early phase CTHA and does not show corona enhancement on late phase CTHA when its main drainage channel is hepatic vein. A nodule shows hypoattenuation on CTAP, hyperattenuation on early phase CTHA, and thin corona enhancement (2 mm or less in thickness) on late phase CTHA when its main drainage channel is sinusoid. A nodule shows hypoattenuation on CTAP, hyperattenuation on early phase CTHA, and thick corona enhancement (more than 2 mm in thickness) on late phase CTHA when its main drainage channel is portal vein.
Findings of corona enhancement relate to the growth patterns of the carcinogenic hepatocyte nodules. Nodules with thick corona enhancement on late phase CTHA commonly show compressing growth with fibrous capsule (Figure 12). Nodules with thin corona enhancement on late phase may show compressing growth without fibrous capsule (Figure 13). Nodules without corona enhancement on late phase CTHA, which appear slightly hypoattenuating on both CTAP and early phase CTHA, show replacing growth (Figure 14).
Figure 12.

Photomicrograph of tumor front of a progressed well-differentiated HCC showing compressing growth without capsule stained with hematoxylin and eosin (a). The HCC shows thick corona enhancement on late phase CTHA image (b).
Figure 13.

Photomicrograph of tumor front of a progressed well-differentiated HCC showing compressing growth without capsule stained with hematoxylin and eosin (a). The HCC shows thin corona enhancement on late phase CTHA image (b).
Figure 14.

Photomicrograph of tumor front of a progressed well-differentiated HCC showing replacing growth stained with hematoxylin and eosin (a). The HCC does not show any corona enhancement on late phase CTHA image (b).
Growth patterns of the carcinogenic hepatocyte nodules indicate their differentiation. During dedifferentiation, the nodules show replacing growth with indistinct margin at first, then expansile growth without fibrous capsule and finally expansile growth with fibrous capsule [35]. Thus, radiologic evaluations of tumor blood outflows of carcinogenic hepatocyte nodules, especially corona enhancement on late phase CTHA, demonstrate their differentiations as well as their growth pattern.
4. Summary
Hemodynamics of carcinogenic hepatocyte nodules depicted with imaging techniques, especially with CTAP and CTHA, are closely related to differentiations, growth patterns, and outcomes of the nodules. Hyperattenuating nodules with thick corona enhancement on CTHA showing hypoattenuation on CTAP are encapsulated progressed HCCs. Those with thin corona enhancement are unencapsulated progressed HCCs with expansile growth. Hypoattenuating or isoattenuating (= invisible) nodules carrying small hyperattenuating areas on CTHA are early HCCs or high grade dysplastic nodules containing tiny progressed HCCs, 90% of which would become wholly progressed HCCs in two years. Isoattenuating nodules on CTHA showing hypoattenuation on CTAP are early HCCs or the final stage of high grade dysplastic nodule just before progressed HCC, 90% of which would become progressed HCCs in two years. Hypoattenuating nodules on CTHA and CTAP are high grade dysplastic nodules, 30% of which would become progressed HCCs in two years. Isoattenuating nodules on CTHA and CTAP detected by other imaging techniques, such as MR imaging, are low grade dysplastic nodule which will seldom change into progressed HCCs. These guides will be helpful in drawing up therapeutic strategies for hepatocyte nodules arising in cirrhosis.
Conflict of Interests
The authors declare that they have no conflict of interests regarding this paper.
References
- 1.International Working Party. Terminology of nodular hepatocellular lesions. Hepatology. 1995;22(3):983–993. doi: 10.1016/0270-9139(95)90324-0. [DOI] [PubMed] [Google Scholar]
- 2.International Consensus Group for Hepatocellular Neoplasia. Pathologic diagnosis of early hepatocellular carcinoma: a report of the international concensus group for hepatocellular neoplasia. Hepatology. 2009;49(2):658–664. doi: 10.1002/hep.22709. [DOI] [PubMed] [Google Scholar]
- 3.Ueda K., Terada T., Nakanuma Y., Matsui O. Vascular supply in adenomatous hyperplasia of the liver and hepatocellular carcinoma: a morphometric study. Human Pathology. 1992;23(6):619–626. doi: 10.1016/0046-8177(92)90316-U. [DOI] [PubMed] [Google Scholar]
- 4.Himeno H., Enzan H., Saibara T., Onishi S., Yamamoto Y. Hitherto unrecognized arterioles within hepatocellular carcinoma. The Journal of Pathology. 1994;174(3):217–222. doi: 10.1002/path.1711740311. [DOI] [PubMed] [Google Scholar]
- 5.Kimura H., Nakajima T., Kagawa K., et al. Angiogenesis in hepatocellular carcinoma as evaluated by CD34 immunohistochemistry. Liver. 1998;18(1):14–19. doi: 10.1111/j.1600-0676.1998.tb00121.x. [DOI] [PubMed] [Google Scholar]
- 6.Nakashima Y., Nakashima O., Hsia C. C., Kojiro M., Tabor E. Vascularization of small hepatocellular carcinomas: correlation with differentiation. Liver. 1999;19(1):12–18. doi: 10.1111/j.1478-3231.1999.tb00003.x. [DOI] [PubMed] [Google Scholar]
- 7.Roncalli M., Roz E., Coggi G., et al. The vascular profile of regenerative and dysplastic nodules of the cirrhotic liver: implications for diagnosis and classification. Hepatology. 1999;30(5):1174–1178. doi: 10.1002/hep.510300507. [DOI] [PubMed] [Google Scholar]
- 8.Park Y. N., Kim Y.-B., Yang K. M., Park C. Increased expression of vascular endothelial growth factor and angiogenesis in the early stage of multistep hepatocarcinogenesis. Archives of Pathology and Laboratory Medicine. 2000;124(7):1061–1065. doi: 10.5858/2000-124-1061-IEOVEG. [DOI] [PubMed] [Google Scholar]
- 9.Tajima T., Honda H., Taguchi K., et al. Sequential hemodynamic change in hepatocellular carcinoma and dysplastic nodules: CT angiography and pathologic correlation. American Journal of Roentgenology. 2002;178(4):885–897. doi: 10.2214/ajr.178.4.1780885. [DOI] [PubMed] [Google Scholar]
- 10.Kim C. K., Lim J. H., Park C. K., Chol D., Lim H. K., Lee W. J. Neoangiogenesis and sinusoidal capillarization in hepatocellular carcinoma: correlation between dynamic CT and density of tumor microvessels. Radiology. 2005;237(2):529–534. doi: 10.1148/radiol.2372041634. [DOI] [PubMed] [Google Scholar]
- 11.Koito K., Namieno T., Morita K. Differential diagnosis of small hepatocellular carcinoma and adenomatous hyperplasia with power doppler sonography. American Journal of Roentgenology. 1998;170(1):157–161. doi: 10.2214/ajr.170.1.9423624. [DOI] [PubMed] [Google Scholar]
- 12.Matsui O., Kadoya M., Suzuki M., et al. Work in progress: dynamic sequential computed tomography during arterial portography in the detection of hepatic neoplasms. Radiology. 1983;146(3):721–727. doi: 10.1148/radiology.146.3.6298857. [DOI] [PubMed] [Google Scholar]
- 13.Matsui O., Kadoya M., Kameyama T., et al. Benign and malignant nodules in cirrhotic livers: distinction based on blood supply. Radiology. 1991;178(2):493–497. doi: 10.1148/radiology.178.2.1846240. [DOI] [PubMed] [Google Scholar]
- 14.Hayashi M., Matsui O., Ueda K., et al. Correlation between the blood supply and grade of malignancy of hepatocellular nodules associated with liver cirrhosis: evaluation by CT during intraarterial injection of contrast medium. American Journal of Roentgenology. 1999;172(4):969–976. doi: 10.2214/ajr.172.4.10587130. [DOI] [PubMed] [Google Scholar]
- 15.Hayashi M., Matsui O., Ueda K., Kawamori Y., Gabata T., Kadoya M. Progression to hypervascular hepatocellular carcinoma: correlation with intranodular blood supply evaluated with CT during intraarterial injection of contrast material. Radiology. 2002;225(1):143–149. doi: 10.1148/radiol.2251011298. [DOI] [PubMed] [Google Scholar]
- 16.Lencioni R., Mascalchi M., Caramella D., Bartolozzi C. Small hepatocellular carcinoma: differentiation from adenomatous hyperplasia with color doppler US and dynamic Gd-DTPA-enhanced MR imaging. Abdominal Imaging. 1996;21(1):41–48. doi: 10.1007/s002619900007. [DOI] [PubMed] [Google Scholar]
- 17.Hohmann J., Albrecht T., Hoffmann C. W., Wolf K.-J. Ultrasonographic detection of focal liver lesions: increased sensitivity and specificity with microbubble contrast agents. European Journal of Radiology. 2003;46(2):147–159. doi: 10.1016/S0720-048X(02)00053-0. [DOI] [PubMed] [Google Scholar]
- 18.Kudo M., Hatanaka K., Maekawa K. Sonazoid-enhanced ultrasound in the diagnosis and treatment of hepatic tumors. Journal of Medical Ultrasound. 2008;16(2):130–139. doi: 10.1016/S0929-6441(08)60014-4. [DOI] [Google Scholar]
- 19.Claudon M., Dietrich C. F., Choi B. I., et al. Guidelines and good clinical practice recommendations for contrast enhanced ultrasound (CEUS) in the liver—update 2012: a WFUMB-EFSUMB initiative in cooperation with representatives of AFSUMB, AIUM, ASUM, FLAUS and ICUS. Ultrasound in Medicine & Biology. 2013;39(2):187–210. doi: 10.1016/j.ultrasmedbio.2012.09.002. [DOI] [PubMed] [Google Scholar]
- 20.Lim J. H., Kim E. Y., Lee W. J., et al. Regenerative nodules in liver cirrhosis: findings at CT during arterial portography and CT hepatic arteriography with histopathologic correlation. Radiology. 1999;210(2):451–458. doi: 10.1148/radiology.210.2.r99fe04451. [DOI] [PubMed] [Google Scholar]
- 21.Lim J. H., Cho J. M., Kim E. Y., Park C. K. Dysplastic nodules in liver cirrhosis: evaluation of hemodynamics with CT during arterial portography and CT hepatic arteriography. Radiology. 2000;214(3):869–874. doi: 10.1148/radiology.214.3.r00mr12869. [DOI] [PubMed] [Google Scholar]
- 22.Lim J. H., Kim M. J., Park C. K., Kang S. S., Lee W. J., Lim H. K. Dysplastic nodules in liver cirrhosis: detection with triple phase helical dynamic CT. British Journal of Radiology. 2004;77(923):911–916. doi: 10.1259/bjr/56713551. [DOI] [PubMed] [Google Scholar]
- 23.Takayasu K., Muramatsu Y., Mizuguchi Y., Moriyama N., Ojima H. Imaging of early hepatocellular carcinoma and adenomatous hyperplasia (dysplastic nodules) with dynamic CT and a combination of CT and angiography: experience with resected liver specimens. Intervirology. 2004;47(3–5):199–208. doi: 10.1159/000078473. [DOI] [PubMed] [Google Scholar]
- 24.Krinsky G. A., Lee V. S., Theise N. D., et al. Hepatocellular carcinoma and dysplastic nodules in patients with cirrhosis: prospective diagnosis with MR imaging and explantation correlation. Radiology. 2001;219(2):445–454. doi: 10.1148/radiology.219.2.r01ma40445. [DOI] [PubMed] [Google Scholar]
- 25.Jeong Y. Y., Yim N. Y., Kang H. K. Hepatocellular carcinoma in the cirrhotic liver with helical CT and MRI: imaging spectrum and pitfalls of cirrhosis-related nodules. American Journal of Roentgenology. 2005;185(4):1024–1032. doi: 10.2214/AJR.04.1096. [DOI] [PubMed] [Google Scholar]
- 26.Ito K. Hepatocellular carcinoma: conventional MRI findings including gadolinium-enhanced dynamic imaging. European Journal of Radiology. 2006;58(2):186–199. doi: 10.1016/j.ejrad.2005.11.039. [DOI] [PubMed] [Google Scholar]
- 27.Kobayashi M., Ikeda K., Hosaka T., et al. Dysplastic nodules frequently develop into hepatocellular carcinoma in patients with chronic viral hepatitis and cirrhosis. Cancer. 2006;106(3):636–647. doi: 10.1002/cncr.21607. [DOI] [PubMed] [Google Scholar]
- 28.Kitao A., Zen Y., Matsui O., Gabata T., Nakanuma Y. Hepatocarcinogenesis: multistep changes of drainage vessels at CT during arterial portography and hepatic arteriography—radiologic-pathologic correlation. Radiology. 2009;252(2):605–614. doi: 10.1148/radiol.2522081414. [DOI] [PubMed] [Google Scholar]
- 29.Ueda K., Matsui O., Kawamori Y., et al. Hypervascular hepatocellular carcinoma: evaluation of hemodynamics with dynamic CT during hepatic arteriography. Radiology. 1998;206(1):161–166. doi: 10.1148/radiology.206.1.9423667. [DOI] [PubMed] [Google Scholar]
- 30.Ueda K., Matsui O., Kawamori Y., et al. Differentiation of hypervascular hepatic pseudolesions from hepatocellular carcinoma: value of single-level dynamic CT during hepatic arteriography. Journal of Computer Assisted Tomography. 1998;22(5):703–708. doi: 10.1097/00004728-199809000-00006. [DOI] [PubMed] [Google Scholar]
- 31.Inoue E., Fujita M., Hosomi N., et al. Double phase CT arteriography of the whole liver in the evaluation of hepatic tumors. Journal of Computer Assisted Tomography. 1998;22(1):64–68. doi: 10.1097/00004728-199801000-00011. [DOI] [PubMed] [Google Scholar]
- 32.Kita R., Sakamoto A., Nagata Y., et al. Visualization of blood drainage area from hypervascular hepatocellular carcinoma on ultrasonographic images during hepatic arteriogram: comparison with depiction of drainage area on contrast-enhanced ultrasound. Hepatology Research. 2012;42(10):999–1007. doi: 10.1111/j.1872-034X.2012.01019.x. [DOI] [PubMed] [Google Scholar]
- 33.Shimizu A., Ito K., Koike S., Fujita T., Shimizu K., Matsunaga N. Cirrhosis or chronic hepatitis: evaluation of small (≤2-cm) early-enhancing hepatic lesions with serial contrast-enhanced dynamic MR imaging. Radiology. 2003;226(2):550–555. doi: 10.1148/radiol.2262011967. [DOI] [PubMed] [Google Scholar]
- 34.Ito K., Fujita T., Shimizu A., et al. Multiarterial phase dynamic MRI of small early enhancing hepatic lesions in cirrhosis or chronic hepatitis: differentiating between hypervascular hepatocellular carcinomas and pseudolesions. American Journal of Roentgenology. 2004;183(3):699–705. doi: 10.2214/ajr.183.3.1830699. [DOI] [PubMed] [Google Scholar]
- 35.Nakashima O., Sugihara S., Kage M., Kojiro M. Pathomorphologic characteristics of small hepatocellular carcinoma: a special reference to small hepatocellular carcinoma with indistinct margins. Hepatology. 1995;22(1):101–105. [PubMed] [Google Scholar]