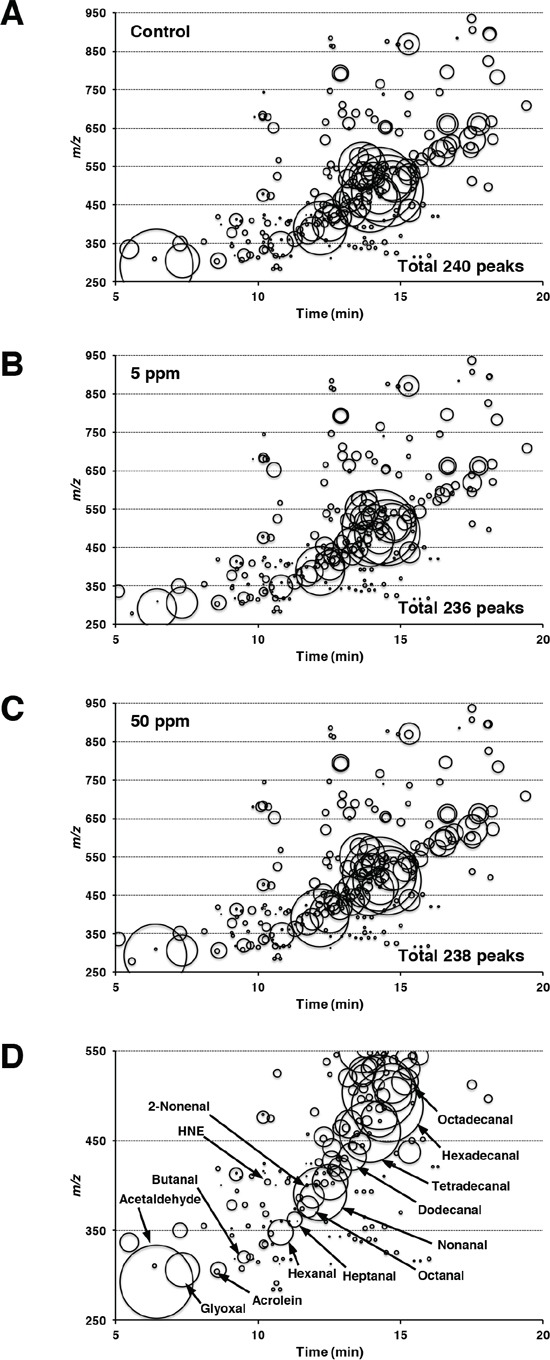
Figure 4. Corresponding RCs maps plotting free RCs detected in the liver samples.

All of the free RCs detected in the liver samples taken from 0 A. 5 B. or 50 C. ppm irsogladine maleate-treated Min mice are shown. RCs are plotted as circles as a function of their retention times (horizontal axis) and m/z values (vertical axis). The areas of the circles represent the intensities of the peaks of the detected RCs relative to that of the IS. Figure 4D is an enlarged view of Figure 4A, showing the m/z values in the range of 250 to 550, together with the names of certain RCs identified by the analyses. The RCs abbreviations are listed in the Materials and Methods section.
