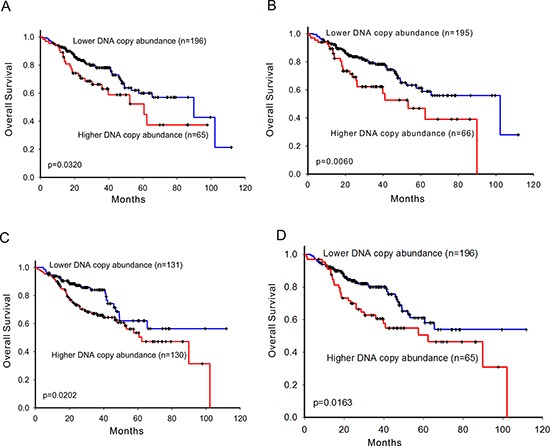
Figure 1. Survival prediction by DNA copy number abundance of ErbB family in 261 patients.

Kaplan-Meier curves for overall survival analysis on A. EGFR, B. ERBB2, C. ERBB3, and D. ERBB4. High- and low-risk groups are divided based on copy number abundance. The optimal cut points were determined by sensitivity analysis which provided the largest discrepancy in overall survival between the low- and high-risk groups on the basis of the log-rank statistic, respectively.
