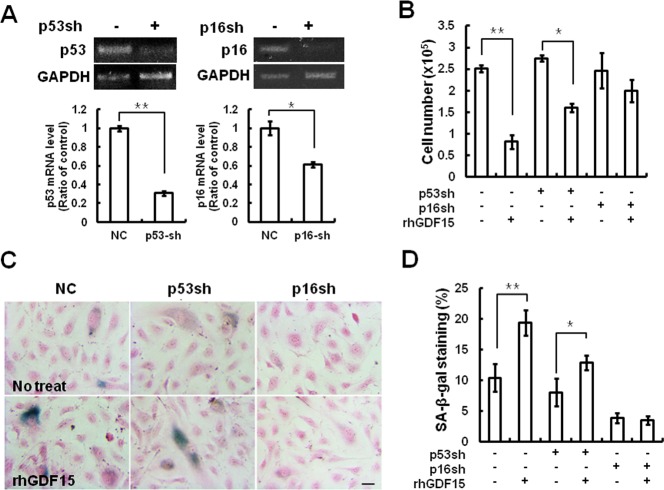
Figure 4. Cellular senescence induced by GDF15 via the p16 signaling pathway.
A. HAECs were transduced with a p16 or p53 shRNA retrovirus. RNA was extracted from the cells and knockdown of p16 or p53 mRNA levels was confirmed by RT-PCR and real-time-PCR. * = p < 0.05 and ** = p < 0.01 versus the NC group. B. The p16 or p53 shRNA cells were treated with 100 ng/ml GDF15 protein for 6 days and cell number counting was performed to determine cell proliferation. C., D. SA-β-gal-positive cells were measured. Values are means ± SD of three independent experiments. ** = p < 0.01 versus the NC group and * = p < 0.05 versus the p53sh group.

