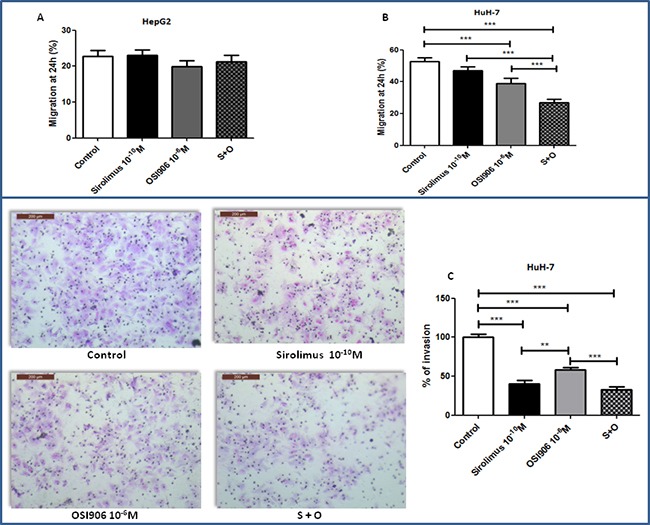
Figure 6.

A. and B. effects of Sirolimus and OSI-906, alone and in combination, on cell migration after 24hrs of treatment, in HepG2 and HuH-7 cell lines. Data are reported as mean ± S.E.M. of three independent experiments for each cell line. Control is set as 100%. ***P<0.001. C. Effects of Sirolimus and OSI-906, alone and in combination, on cell invasion after 24hrs of treatment in HuH-7 cell line. Since both drugs were diluted in DMSO, a double amount of DMSO was added to the control wells and the cells treated with the single agents were supplemented with an extra amount of DMSO. **P<0.01; ***P<0.001.
