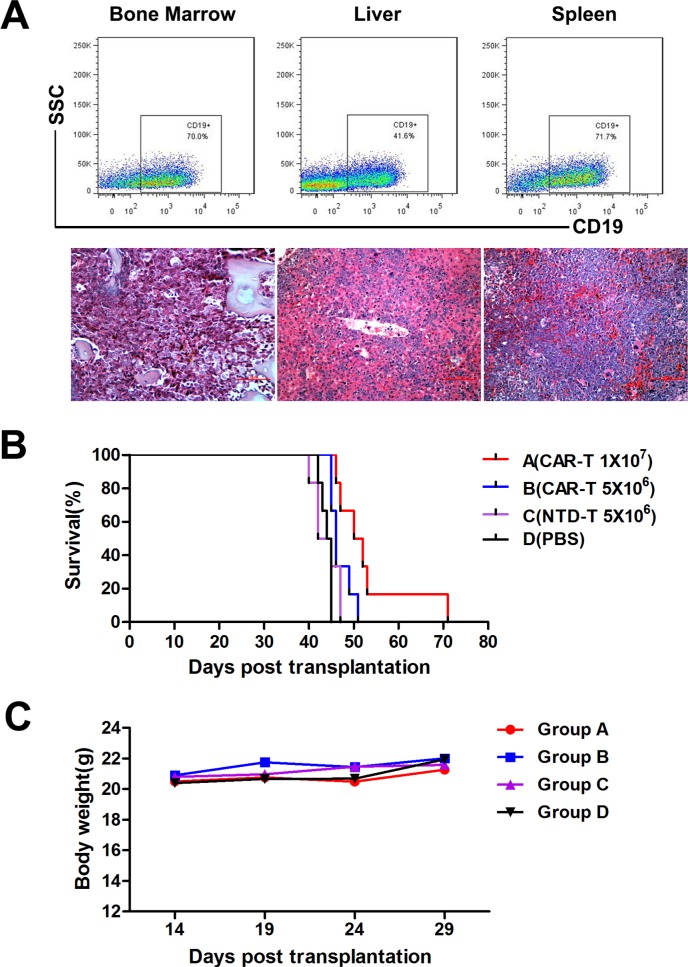
Figure 6. In vivo CAR-T cell treatment in murine B-ALL model.
A. Detection of human CD19+ cells by flow cytometry (upper panel) and histopathologic analysis (lower panel) of bone marrow, liver and spleen from Nalm-6 cells inoculated mice. B. Kaplan-Meier survival curves of four treatment groups. The P-values were determined by log-rank test. P<0.05 when group A compared with all other groups. P=0.009 when group B compared with group D, but no difference between group C and D (P=0.611). C. Average body weight of four groups (n=6) after CAR-T cell treatment. CAR-T cells were administered at day 15 after Nalm-6 cells inoculation.

