

Abstract
The incidence rate of thyroid cancer has been rising rapidly in recent decades, but its trend remains unclear. To investigate this, we analyzed the database of SEER 13, 1992-2012 in USA, with a particular focus on conventional papillary thyroid cancer (CPTC) and follicular-variant PTC (FVPTC). Of the 75,992 thyroid cancers, 61.3% were CPTC, and 25.7% were FVPTC, and their incidence rates (IRs) were both significantly increased from 1992 to 2012 (P all <0.001), with CPTC being 2.4-time FVPTC (P<0.001) and the overall average annual percent change (AAPC) of incidence being 6.3% in the former and 5.3% in the latter. IRs were increased in all thyroid cancers, albeit most dramatically in PTC, in virtually all ethnic/demographic groups in recent two decades, but the incidence trends varied among different thyroid cancers, particularly differentiable between CPTC and FVPTC. For example, joinpoint analyses revealed that the APC of CPTC before 1996 was 1.5% (P>0.05), which jumped to 6.8% (P<0.05) after 1996, while the APC of FVPTC before 2000 was 6.6% (P<0.05), which dropped to 4.8% (P<0.05) after 2000. IRs and incidence trends of PTC were uneven among different ethnic/demographic groups, as exemplified by the lower IRs of both PTC variants in the black females than non-Hispanic white females but higher AAPCs of incidence in the former than the latter. Interestingly, the data also suggest that the incidence rise of PTC is becoming plateaued in the most recent two years. These novel observations are helpful in understanding the incidence and incidence trends of thyroid cancer.
Keywords: thyroid cancer, incidence rate, incidence trend, conventional papillary thyroid cancer, follicular variant papillary thyroid cancer
Introduction
The incidence of thyroid cancer has been steadily rising worldwide in recent decades (Kilfoy et al. 2009, Pellegriti et al. 2013). In the United States, the overall incidence of thyroid cancer rose by 6.6% annually between 2000-2009, which was the highest among all cancers (Siegel et al. 2013). The Surveillance, Epidemiology and End Results (SEER) program has reported the age-adjusted incidence rate of thyroid cancer to be 13.5 per 100,000 people in the general population in 2015 (Howlader et al. 2015) and to have a 3.8-fold increase since 1973 (Davies et al. 2006). The number of new cases of thyroid cancer and thyroid cancer-related deaths was estimated to be 62,450 and 1,950 for 2015, respectively, in the United States (Howlader et al. 2015). This increased incidence of thyroid cancer is primarily due to the rise in the incidence of papillary thyroid cancer (PTC), which accounts for 80–90% of all thyroid malignancies (Hundahl et al. 1998, Howlader et al. 2015). Other types of thyroid cancer include relatively uncommon follicular thyroid cancer (FTC), anaplastic thyroid cancer (ATC), and medullary thyroid cancer (MTC) (Xing 2013).
PTC can be histologically classified into several variants and the most common variants are conventional variant (CPTC) and follicular variant (FVPTC), which account for >90% of all PTC variants (Shi et al, 2016). CPTC is a well-established classical PTC. FVPTC was initially described as alveolar variant of PTC over half a century ago (Crile et al. 1953, Yu et al. 2013) and became widely accepted in 1980's (Rosai et al. 1983, Carcangiu et al. 1985). Following its inclusion in the World Health Organization classification of thyroid neoplasia in 1989 (Hedinger et al. 1989), the SEER program started including FVPTC in reporting on thyroid cancer in 1990 (Hodgson et al. 2004). Both similarities and dissimilarities in clinicopathological behavior between CPTC and FVPTC were reported, with the 10-year disease-specific patient survival rate being 97% in the former and 98% in the latter (Ito et al. 2008, Yu et al. 2013). There are also genetic similarities and dissimilarities between CPTC and FVPTC (Xing 2013).
There have been many published epidemiology studies on thyroid cancer, but few of them specifically examined the incidence trends of thyroid cancer, including CPTC and FVPTC. Accurate and updated knowledge of the incidence trends of CPTC and FVPTC would be useful in better understanding the two most common PTC variants and in assisting public health planning and clinical practice. To this end, the present study extended previous studies by using the most recently updated and most comprehensive SEER 13 registry dataset to perform an in-depth analysis of the incidence rate (IR) of various thyroid cancers with a particular focus on the incidence trends of the two most common thyroid cancers—CPTC and FVPTC in various clinicopathological and demographical settings in the USA from 1992 to 2012.
Materials and methods
Data collection and inclusion
The SEER 13 registry was used for the present study. This is a retrospective cancer cohort from 13 Registries, which began contributing cases in 1992, encompassing 13.4% of the United States census and covering Atlanta, Alaska Natives, Connecticut, Detroit, Hawaii, Iowa, Los Angeles, New Mexico, Rural Georgia, San Francisco-Oakland, San Jose-Monterey, Seattle-Puget Sound, and Utah (http://seer.cancer.gov/registries/terms.html) (SEER Program 2014 submission). Both CPTC and FVPTC were specifically classified and included in this cohort. Other registries include SEER 9, which began contributing cases in 1973 but only covered 9 registries and 9.4% of the US population, and SEER18, which covered 18 registries and 27.8% of the US population but began lately in 2000. Since the incidence of thyroid cancer was relatively stable until early 1990's, after which it has been rising substantially, we chose to use SEER 13 for the present study.
All incidence cases with thyroid cancer were identified using the primary site code of 73.9 for thyroid in combination with the International Classification of Diseases for Oncology, 3rd Revision (ICD-O-3) (Fritz 2000). Based on the corresponding histological codes, PTC included (i) CPTC: 8050 (papillary carcinoma not otherwise specified, NOS), 8260 (papillary adenocarcinoma, NOS), 8343 (papillary carcinoma, encapsulated), and 8341 (papillary microcarcinoma); (ii) FVPTC: 8340 (papillary carcinoma, follicular variant); and (iii) other variants: 8052 (papillary squamous cell carcinoma), 8130 (papillary transitional cell carcinoma), 8342 (papillary carcinoma, oxyphilic cell), 8344 (papillary carcinoma, columnar cell), 8450 (papillary cystadenoma, NOS), 8451 (papillary cystadenoma, borderline malignancy), and 8452 (papillary cystic tumor). FTC included 8290 (oxyphilic adenocarcinoma), 8330 (follicular adenocarcinoma, NOS), 8331 (follicular adenocarcinoma well differentiated), 8332 (follicular adenocarcinoma trabecular), and 8335 (follicular carcinoma, minimal invasive). MTC included 8345 (medullary carcinoma with amyloid stroma), 8346 (mixed medullary-follicular carcinoma), 8347 (mixed medullary-papillary carcinoma), and 8510 (medullary carcinoma, NOS). ATC included 8021 (carcinoma, anaplastic type, NOS).
Incidence trends were analyzed by various histopathological and demographic parameters, including tumor size, patient sex, ethnicity/race, and SEER historic stage A. SEER ethnic/racial groups included Hispanic whites, non-Hispanic whites, blacks, and Asian/others (including Asians/Pacific Islanders and American Indians/Alaskan Natives). SEER historic stage A was a classification system used to define the invasion/metastatic status of thyroid cancer, including localized (limited to the thyroid gland), regional (limited to surrounding tissues in the neck), and distant (or systemic) diseases. Tumor size was referred to the greatest diameter of the tumor recorded on surgical pathology reports, which was categorized as ≤1, >1 and ≤2, >2 and ≤4, and >4cm based on the Extent of Disease-10 codes for 1992–2003 and the Collaborative Staging codes for 2004–2012.
Data analysis
IR was calculated using SEER*Stat 8.2.1 (www.seer.cancer.gov/seerstat) and expressed as per 100,000 population-year. Age-adjusted IRs were standardized to the 2000 USA population. Incidence rate ratio (IRR) was used to compare IRs, where a given rate of a group was compared to a referent group rate (Tiwari et al. 2006). IRs were reported if there were ≥10 cases in a category and IRRs were reported if both rates were ≥10 cases.
Joinpoint analysis, which was patient age adjusted, was performed to investigate incidence trends using Joinpoint Regression Program 4.0.4 from the Surveillance Research Program of the National Cancer Institute. This helped to identify inflection points (so-called joinpoints) where a significant change in linear slope of the trend occurred, allowing two segments to fit age-adjusted trends between 1992 and 2012. Each line segment was characterized with the estimated annual percentage change (APC), reflecting a change in trend within the time horizon of the line segment at a constant percentage of the rate of the previous year (Kim et al. 2000). To quantify the trend over the whole period, we computed the average annual percent change (AAPC) as a geometric weighted average of the APCs from the Joinpoint model. This represented a summary measure of the trend over the study period. If an AAPC lied entirely within a single joinpoint segment, the AAPC was equal to the APC for that segment. An associated P<0.05 represented the likelihood that the APC or AAPC was significantly different from zero. Pairwise comparison parallel test by Joinpoint software was used to compare trends among groups. Parallelism test was used to examine whether regression mean functions—slope of the change in trend—were similar in direction. A P value <0.05 on this test suggested that the two trends in terms of AAPCs compared were significantly different from each other. Other analyses were performed using STATA software, version 12.0 (STATA, College Station, TX). All P values were two-sided and a value <0.05 was treated as significant.
Results
Proportion and incidence trends of thyroid cancers
Among the 77,848 cases of thyroid cancer recorded in SEER 13, 97.6% (75,992) had microscopically confirmed histology, which were included for the analyses in the present study. Fig. 1A shows the proportions of various histological types of thyroid cancer, with PTC being the most common, accounting for 87.8% of all thyroid cancers, and FTC the second common, accounting for 9.2% of all thyroid cancers. CPTC and FVPTC accounted for 61.3% and 25.7% of all thyroid cancers, respectively. CPTC and FVPTC accounted for 69.9% and 29.2% of all PTC variants, respectively (Fig. 1B). Fig. 1C shows the trends in IRs of all histological types of thyroid cancer, including CPTC and FVPTC. There was a steady rise in the IR most prominently with total PTC, CPTC and FVPTC between 1992 and 2012, but the rising was steeper with CPTC than FVPTC.
Figure 1.
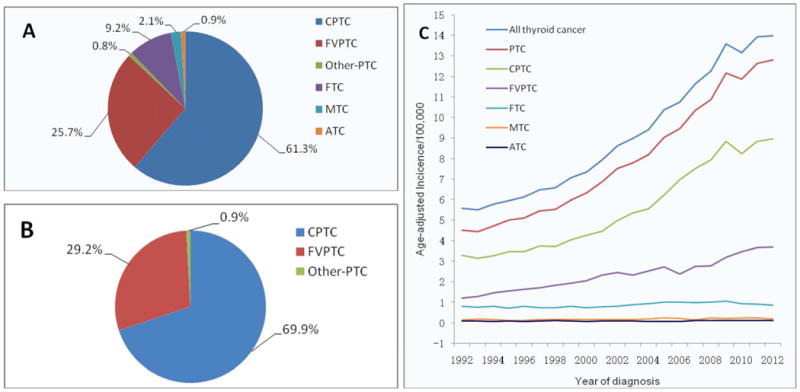
Table 1 summarizes age-adjusted IRs and AAPC of thyroid cancer from 1992 to 2012. The results included the overall trend across the 20 years and the difference between 1992 and 2012 at the two points in time. The incidence of overall thyroid cancer increased more than 2.5 folds during this period (P<0.001 for trend) with the AAPC being 5.5% (95% CI, 5.2-5.8). This progressive increase was nearly entirely attributable to an increase in PTC, which was increased by 2.8 folds (P<0.001 for trend) with an AAPC of 6.1% (95% CI, 5.8-6.4). The incidence of CPTC was increased by 2.7 fold from 1992 to 2012 (P<0.001 for trend) with an AAPC of 6.3% (95% CI, 5.8-6.9). The incidence of FVPTC was increased by over 3 fold (P<0.001 for trend) with the AAPC being 5.3% (95% CI, 4.8-5.8) during the same period of time. There was also a significant increase in the incidence of FTC, MTC (P<0.001 for trend) and ATC (P=0.027 for trend), although the overall trends for these three thyroid cancers were relatively slow, with AAPC being 1.5% (95% CI, 0.8-2.2), 2.3% (95% CI, 1.2-3.4) and 1.6% (95% CI, 0.3-2.8), respectively. Thus, the incidence change occurred mainly with CPTC and FVPTC, which were the focus of the further analyses.
Table 1. Age-adjusted incidence rates (per 100,000) of thyroid cancer and their average annual percentage change between 1992 and 2012 in the USA.
| Histological type | n | Age-adjusted incidence rate | P for trend | AAPC | 95% CI | ||
|---|---|---|---|---|---|---|---|
|
| |||||||
| Overall | Year 1992 | Year 2012 | |||||
| All thyroid cancer | 75992 | 9.31 | 5.57 | 13.98 | <0.001 | 5.5* | 5.2-5.8 |
| PTC | 66695 | 8.15 | 4.51 | 12.82 | <0.001 | 6.1* | 5.8-6.4 |
| CPTC | 46603 | 5.69 | 3.30 | 8.96 | <0.001 | 6.3* | 5.8-6.9 |
| FVPTC | 19520 | 2.39 | 1.21 | 3.70 | <0.001 | 5.3* | 4.8-5.8 |
| FTC | 7013 | 0.87 | 0.80 | 0.86 | <0.001 | 1.5* | 0.8-2.2 |
| MTC | 1579 | 0.20 | 0.16 | 0.19 | <0.001 | 2.3* | 1.2-3.4 |
| ATC | 705 | 0.09 | 0.09 | 0.11 | 0.027 | 1.6* | 0.3-2.8 |
Notes: PTC, papillary thyroid cancer; CPTC, conventional papillary thyroid cancer; FVPTC, follicular variant of papillary thyroid cancer; FTC, follicular thyroid cancer; MTC, medullary thyroid cancer; ATC, anaplastic thyroid cancer; 95% CI, 95% confidence interval; AAPC, average annual percentage change.
Statistical significance (P<0.05) was found in incidence trends as indicated.
Incidence trends of CPTC and FVPTC and their patterns by patient sex
The patient demographic characteristics of the CPTC and FVPTC groups are presented in Supplemental Table 1. During the period of 1992-2012, a total of 46,603 cases of CPTC (IR=5.69, 95% CI, 5.64-5.74) and 19,520 cases of FVPTC (IR=2.39, 95 CI, 2.36-2.43) were reported; the IRR of CPTC/FVPTC was 2.38 (95% CI, 2.34-2.42, P<0.05), which was similar to the IRRs when male and female patients were examined separately (2.61 and 2.32, respectively) (Table 2).
Table 2. Joinpoint analysis of the age-adjusted incidence and trend of CPTC and FVTC by patient sex between 1992 and 2012 in the USA.
| n | IR (95% CI) |
IRR (95% CI) |
APC1 (95% CI) |
Joinpoint | APC2 (95% CI) |
AAPC (95% CI) |
Parallelismc | |
|---|---|---|---|---|---|---|---|---|
| Both Sex | ||||||||
| FVPTC | 19520 | 2.39 (2.36-2.43) | 1.00 | 6.6 (4.0-9.4)b | 2000 | 4.8 (3.8-5.8)b | 5.3 (4.8-5.8)b | 0.006 |
| CPTC | 46603 | 5.69 (5.64-5.74) | 2.38 (2.34-2.42)a | 1.5 (-6.1-9.7) | 1996 | 6.8 (6.1-7.5)b | 6.3 (5.8-6.9)b | |
| Female | ||||||||
| FVPTC | 15338 | 3.66 (3.60-3.72) | 1.00 | 5.4 (4.9-6.0) b | - | 5.4 (4.9-6.0) b | 0.005 | |
| CPTC | 35610 | 8.47 (8.38-8.56) | 2.32 (2.27-2.36)a | 6.5 (5.9-7.1)b | - | 6.5 (5.9-7.1)b | ||
| Male | ||||||||
| FVPTC | 4182 | 1.09 (1.05-1.12) | 1.00 | 4.3 (3.2-5.4)b | 2008 | 7.9 (1.5-14.7)b | 4.9 (4.2-5.6) b | 0.013 |
| CPTC | 10993 | 2.84 (2.78-2.89) | 2.61 (2.52-2.71)a | -4.0 (-16.3-10.2) | 1995 | 6.3 (5.6-7.1)b | 5.7 (5.0-6.4)b |
Notes: 95% CI, 95% confidence interval; APC, annual percentage change; APC1, the APC from 1992 to the year of joinpoint; APC2, the APC from the year of joinpoint to 2012; AAPC, average annual percentage change; CPTC, conventional papillary thyroid cancer; FVPTC, follicular variant of papillary thyroid cancer; IR, incidence rate; IRR, incidence rate ratio.
P value <0.05.
APC or AAPC was significantly different from 0 (2-sided P<0.05).
P value <0.05 on the parallelism test, indicating that the trends (slopes) between CPTC and FVPTC were significantly different.
The over rising incidence curves between 1992-2012 were steeper in CPTC than FVPTC in patients of both sexes or either sex alone (Fig. 2). The incidence trends from Joinpoint regression analyses demonstrated that age-adjusted incidence rates of both CPTC and FVPTC continuously increased between 1992 and 2012. However, one joinpoint emerged in incidence trend line of CPTC or FVPTC between 1992 and 2012 on the analysis of patients of both sexes (Fig. 2A). On the overall analysis of all cases (Table 2), the APC of CPTC between 1992 and 1996 was 1.5% (P>0.05), which jumped to 6.8% (P<0.05) between 1996 and 2012, while the APC of FVPTC between 1992 and 2000 was 6.6% (P<0.05), which dropped to 4.8% (P<0.05) between 2000 and 2012. A parallelism test indicated that the incidence trends of CPTC and FVPTC on the Joinpoint regression were significantly different (P=0.006).
Figure 2.
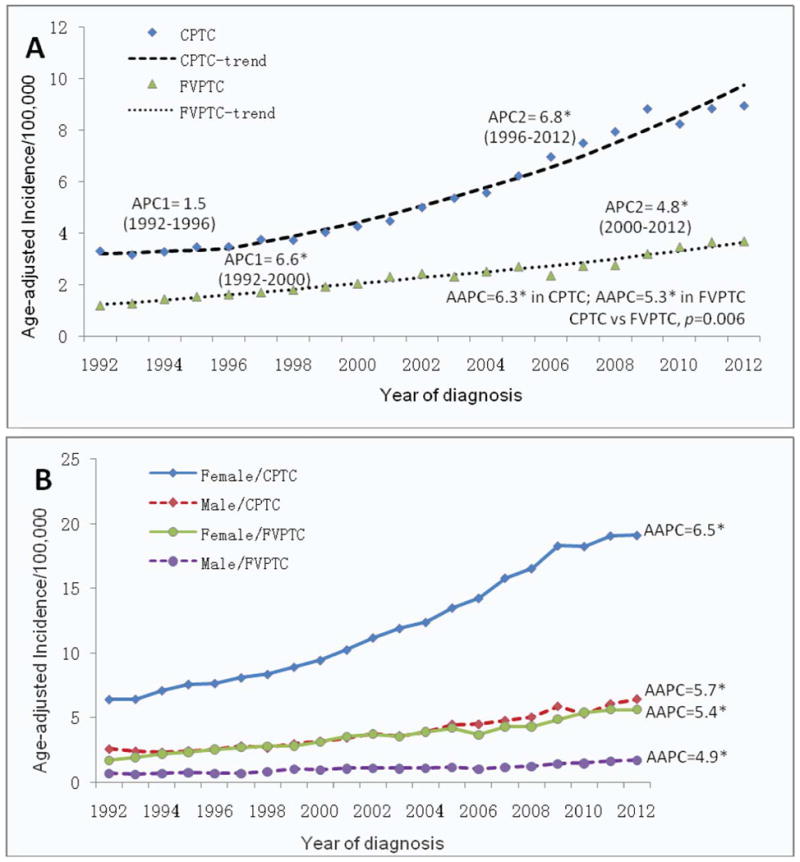
Fig. 2B and Table 2 show the incidence trends by patient sex for CPTC and FVPTC. When the two sexes were separated, joinpoints emerged in male sex with CPTC and FVPTC (Table 2). Specifically, the APC of CPTC in males between 1992 and 1995 was -4.0% (P>0.05), which robustly jumped to 6.3% (P<0.05) between 1995 and 2012. The APC of FVPTC in males was 4.3% (P<0.05) before 2008, which was moderately increased to 7.9% (P<0.05) after 2008. There was no clear joinpoint in females with CPTC or FVPTC, indicating a steady increase in the incidence of both cancers over this period of time in this population (AAPC=6.5% and 5.4%, respectively, P<0.05). However, a parallelism test showed a significant difference in the incidence trend between CPTC and FVPTC, higher in the former than the latter, both in males (P=0.013) and in females (P=0.005).
Incidence trends of CPTC and FVPTC by ethnicity/race and sex
We next analyzed the incidence patterns of CPTC and FVPTC by ethnicity/race and sex. As shown in Supplemental Table 2, the IRRs of females/males were 3.22-4.25 for FVPTC and 2.83-3.53 for CPTC; all were significant for each ethnic/racial group. The IRs of FVPTC in females were significantly higher in non-Hispanic whites, Hispanic whites and Asian/others than black females with IRRs of non-black/black being 1.11-1.48, which were all significant (P<0.005). The IRRs of non-black/black for CPTC in both females and males were 2.12-2.76, which were all significant (P<0.001). Although all the IRRs of non-black/black for FVPTC in males were >1.0, it was significant only in non-Hispanic whites (IRR=1.61, P<0.001).
We also analyzed the race-specific time trend of age-adjusted incidence of CPTC and FVPTC by sex from 1992 to 2012. During the 20-year period, the incidence of CPTC or FVPTC significantly increased in every ethnicity/race group and both sexes. Specifically, as shown in Supplemental Table 3 and Supplemental Fig. 1, in females, the AAPC of CPTC incidence was 7.9% (95% CI 6.7-9.1, P<0.05) in blacks, 7.0% (95% CI 6.4-7.6, P<0.05) in non-Hispanic whites, 5.6% (95% CI 4.8-6.3, P<0.05) in Hispanic whites, and 4.6% (95% CI 3.9-5.3, P<0.05) in Asian/others. The AAPC of CPTC in males was 6.5% (95% CI 5.7-7.1, P<0.05) in non-Hispanic whites, 4.9% (95% CI 3.5-6.3, P<0.05) in Hispanic whites, 4.1% (95% CI 2.9-5.4, P<0.05) in Asian/others, and 2.5% (95% CI 0.4-4.7, P<0.05) in blacks. The IRs of FVPTC in both sexes was the lowest in the blacks among virtually all the ethnic settings, while in both sexes, blacks showed higher AAPCs of FVPTC (female 6.7% and male 8.2%) than non-Hispanic whites (female 6.1% and male 5.3%), Hispanic whites (female 4.4% and male 4.1%) and Asian/others (female 2.8% and male 2.4%). Thus, for both CPTC and FVPTC, while black females had a lower IR than non-Hispanic white females, the former had a higher AAPC than the latter.
The presence of joinpoints varied in different settings. As shown in Supplemental Table 3 and Supplemental Fig. 1, for FVPTC, there was no joinpoint in all the ethnicity/race groups in both females and males except for the non-Hispanic white females. APC of FVPTC before the joinpoint 1996 was the highest in non-Hispanic white females (12.5%) among all groups, which dropped to 5.6% after 1996. For CPTC, in black females, APC was -1.2% before 1997, which rose to 9.2% after 1997; in non-Hispanic white females, the jointpint occurred in the most recent year of 2009, with APC being 7.7% before 2009 and 0.8% after 2009. This slowed rise in the incidence of CPTC in non-Hispanic white females is consistent with the flattened incidence curve in this ethnic population in the most recent two years (Supplemental Fig. 1). However, the overall incidence rising curves over the 20 years were steeper with CPTC than FVPTC in virtually all the ethnic backgrounds with both patient sexes (Supplemental Fig. 1).
We also performed joinpoint parallelism test to examine the difference in time trends among different groups as summarized in Supplemental Table 4. In females, the incidence trends of FVPTC among different ethnicity/race groups were all significantly different except for the comparison between non-Hispanic white females and black females (P=0.167). The incidence trends of CPTC were also significantly different among all ethnicity/race groups except for the comparison between Hispanic white females and Asian/other females (P=0.133). As an example, the incidence trends between black females and Hispanic white females were significantly different for both FVPTC and CPTC (P<0.001 for all). In males, a significant difference in incidence trends of FVPTC was also observed among various ethnic/race groups (Supplemental Table 4).
Incidence trends of CPTC and FVPTC by tumor size and SEER stage
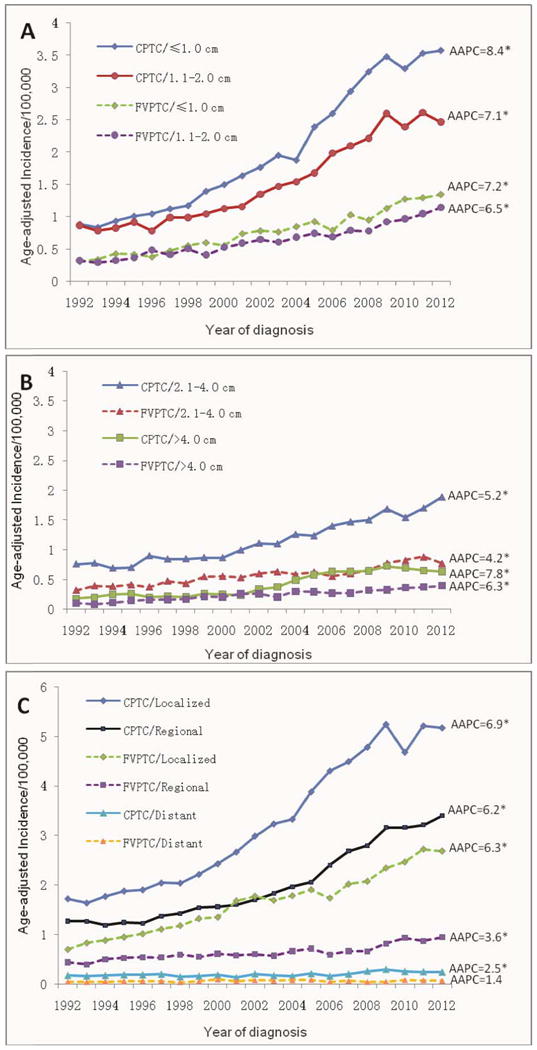
We also examined tumor size-specific and stage-specific incidences of CPTC and FVPTC as shown in Table 3 and Fig. 3. The changes of incidence trend were larger in small tumors than in large tumors (Fig. 3A and B) and in localized disease stage than in regional and distant disease stages (Fig. 3C), although, as shown in Table 3, the AAPCs of CPTC were significant among all tumor size groups and all SEER stage groups (P<0.05 for all). A significant joinpoint was identified in most of the tumor size and disease stage groups of CPTC. For example, the APC of CPTC with tumor size 2.1-4.0 cm was -5.2% before 1994, which jumped to 5.6% after 1994; and the APC of CPTC with regional metastasis was -1.1% before 1996, which jumped to 7.0% after 1996. For CPTC >4.0 cm, the jointpoint occurred in the most recent year of 2009, with APC being 9.3% before 2009 and -4.6% after 2009, representing a sharply decreased (actually negative) incidence trend in the most recent 2-3 years, consisting with the slightly downward incidence trend curve of CPTC >4.0 cm from 2009 to 2012 (Fig. 3B). No joinpoint was identified in the distant metastasis group of CPTC, indicating a steadily and slow rising incidence trend from 1992-2012. No joinpoint was identified for FVPTC in most of the tumor size groups except for the group of tumor >4.0 cm; in the latter, the APC was 12.8% before 1999, which dropped to 4.6% after 1999, indicating a slowing of the incidence trend of FVPTC >4.0 cm in the most recent decade. Nevertheless, over the course of 20 years, the overall rise of the incidence occurred virtually in all the tumor size and SEER stage groups in both CPTC and FVPTC and the rise was sharper in the former than the latter, particularly during the time before the most recent 2-3 years (Fig. 3).
Table 3. Comparison of overall trends in the incidence between CPTC and FVPTC by tumors size and SEER stage between 1992 and 2012 in the USA.
| FVPTC | CPTC | Joinpoint parallelisma | |||||||||||||
|---|---|---|---|---|---|---|---|---|---|---|---|---|---|---|---|
|
|
|||||||||||||||
| APC1 | 95% CI | Joinpoint | APC2 | 95% CI | AAPC | 95% CI | APC1 | 95% CI | Joinpoint | APC2 | 95% CI | AAPC | 95% CI | ||
| Tumor size | |||||||||||||||
| ≤1.0 cm | 7.2* | 6.4-7.9 | - | 7.2* | 6.4-7.9 | 9.3* | 8.6-10.0 | 2009 | 1.7 | (-4.1)-7.8 | 8.4* | 7.7-9.1 | 0.002 | ||
| 1.1-2.0 cm | 6.5* | 5.8-7.1 | - | 6.5* | 5.8-7.1 | 7.1* | 6.4-7.9 | - | 7.1* | 6.4-7.9 | 0.281 | ||||
| 2.1-4.0 cm | 4.2* | 3.5-5.0 | - | 4.2* | 3.5-5.0 | -5.2 | (-24.6)-19.2 | 1994 | 5.6* | 5.0-6.2 | 5.2* | 4.7-5.8 | 0.068 | ||
| >4.0 cm | 12.8* | 6.6-19.3 | 1999 | 4.8* | 3.4-6.2 | 6.3* | 5.3-7.4 | 9.3* | 7.3-11.3 | 2009 | -4.6 | (-19.9)-13.6 | 7.8* | 6.2-9.4 | 0.005 |
| SEER stage | |||||||||||||||
| Localized | 8.7* | 6.6-10.8 | 2001 | 5.1* | 4.2-6.1 | 6.3* | 5.7-6.9 | 7.6* | 6.9-8.3 | 2009 | 0.4 | (-5.9)-7.1 | 6.9* | 6.2-7.5 | 0.010 |
| Regional | 2.6* | 1.4-3.8 | 2007 | 7.3* | 2.5-12.3 | 3.6* | 2.9-4.3 | -1.1 | (-7.6)-5.8 | 1996 | 7.0* | 6.3-7.6 | 6.2* | 5.5-6.8 | <0.001 |
| Distant | 1.4 | (-0.6)-3.4 | - | 1.4 | (-0.6)-3.4 | 2.5* | 1.3-3.8 | - | 2.5* | 1.3-3.8 | 0.266 | ||||
Notes: 95% CI, 95% confidence interval; APC, annual percentage change; APC1, the APC from 1992 to the year of joinpoint; APC2, the APC from the year of joinpoint to 2012; AAPC, average annual percentage change; CPTC, conventional papillary thyroid cancer; FVPTC, follicular variant of papillary thyroid cancer.
APC or AAPC was significantly different from 0 (2-sided P<0.05).
P value <0.05 on the parallelism test, indicating that the trends (slopes) between CPTC and FVPTC are significantly different.
Figure 3.
Discussion
This is an analysis of the incidence and incidence trends of various thyroid cancers, particularly CPTC and FVPTC, in various ethnic and demographic settings on SEER 13, the most comprehensive recent thyroid cancer dataset in the USA, spanning 20 years from 1992 to 2012. The results showed a significant increase in age-adjusted IR of all thyroid cancers, particularly CPTC and FVPTC, over this period of time. The overall rising trend of CPTC incidence was most prominent and significantly higher than that of FVPTC. Although the overall incidence of FVPTC was also steadily increasing among most populations from 1992-2012, a slowed trend was generally seen in the recent decade compared with the earlier decade, whereas the incidence trend of CPTC was generally increased in the recent decade on the overall analysis except for certain ethnic/demographic settings in the most recent 2-3 years. Thus, this study for the first time unveils an interesting differentiation of the incidence rise trend in the last two decades between CPTC and FVPTC—generally increased in the former and generally decreased in the latter.
The present study also found a significant increase in incidence trend in all histological types of thyroid cancers albeit most robustly in PTC. This was different than the previous results on the analysis of SEER 9 that showed no significant changes between 1973 and 2002 in the incidence of FTC, MTC and ATC (Davies et al. 2006). However, the present study showed that the increase rate of the incidence of FTC and MTC was much slower than that of PTC, which is consistent with other previous studies (Enewold et al. 2009, Aschebrook-Kilfoy et al. 2011). Inconsistent with other reports (Davies et al. 2006, Davies et al. 2014), the present study found that the incidence trend of ATC had a small but significant increase in the recent two decades.
It was proposed that the increased incidence of PTC was attributed to the enhanced diagnostic detection in recent years (Davies et al. 2006, Davies et al. 2014). As in CPTC patients with small tumors and localized disease, in which our joinpoint analyses revealed high AAPCs in the recent decade, we similarly showed that CPTC with larger tumor (>2.0 cm) or metastasis (local or distant) also displayed remarkably increased AAPCs in the recent decade. These results seem to be inconsistent with the detection theory but suggest that enhanced diagnostic detection may not be the only cause for the increased incidence of CPTC. If enhanced diagnostic detection was the sole cause for the increased incidence, there would likely be a decrease in the incidence trend of large or advanced thyroid cancer in the recent decade, since through enhanced diagnostic detection many tumors would have been detected at the early stage, leaving today less chance to find advanced thyroid cancer. Only APCs of the extremely large tumors (tumors >4.0 cm) of both CPTC and FVPTC were decreased, particularly in the most recent 2-3 years for CPTC, which is likely attributable to the increased diagnostic surveillance and treatment seen in the recent decades. Our finding that, for both CPTC and FVPTC, black females had a higher AAPC than non-Hispanic white females in the recent decades is also inconsistent with the detection theory as there is no evidence that the former ethnic group receives more aggressive diagnostic detection for thyroid cancer than the latter in the recent decade in USA. The finding of a much lower trend in the incidence rise in FTC than PTC is similarly inconsistent with the detection theory since detection would be expected to similarly increase the clinical discovery and hence AAPC of both FTC and PTC. The differential AAPC between CPTC and FVPTC found in the present study is also inconsistent with the detection theory in that increased diagnostic detection would proportionately promote the diagnosis of both CPTC and FVPTC and yield equal AAPCs for the two PTC variants. Our results are, instead, consistent with the results on SEER 9 dataset suggesting that enhanced clinical detection could not fully explain the increase in the incidence of PTC (Li et al. 2013). Thus, these results provide further evidence that the currently proposed enhanced diagnostic detection theory cannot fully explain the rapidly rising incidence of PTC in the recent decades; it seems that an additional unknown etiology that has been preferentially driving the development of CPTC over FVPTC exists.
Interestingly, in opposite to the overall rapidly rising trend of the incidence of CPTC in non-Hispanic white females in the last two decades, the APC of CPTC in this population in the most recent 2-3 years after 2009 stopped rising and in fact became negative, suggesting that the diagnosis of CPTC seems to start reaching a plateau in the recent 2-3 years. As the incidence of CPTC in non-Hispanic white females constitute the bulk of the overall incidence of PTC in the USA, it is expectable, based on this finding, that the rapid incidence rise of PTC will halt and stay plateaued for the current and coming few years. To be consistent with this expectation is, in fact, the fact that the incidence of thyroid cancer in the USA in 2015 was very similar to that in 2014 (Howlader et al. 2015).
Our study has several strengths worth emphasizing. Previous studies mostly examined the cumulative incidences of thyroid cancers. Our study examined not only the incidences but also incidence trends and compared them between the major PTC variants FVPTC and CPTC in various ethnic/demographic settings over the recent two decades during which enhanced diagnostic detection using ultrasonography and fine-needle aspiration biopsy was widely seen. Importantly, we used the joinpoint regression analysis to specifically and accurately examine the incidence trends of PTC. This made it possible to identify a specific calendar year at which a significant change in the incidence trend occurred and to define the APCs/AAPCs before and after that time point. As a result, we were able to discover the remarkable differential incidence trends of CPTC and FVPTC. Thus, the present study represents an improved approach of evaluating the contribution of diagnostic detection to the increased incidence of thyroid cancer in the recent decades.
Like all the previously published studies using various SEER databases, this study shares the classical limitations of investigations using such a large population-based dataset. For example, although SEER conducts regular audits to evaluate both the quality and completeness of data, some misclassification of patient information, such as that on tumor size and subtype diagnosis, in this large national database is virtually inevitable. Also, despite being the most representative thyroid cancer dataset in the US, the SEER 13 regions represent only 13.4% of the US population. Nevertheless, SEER 13 is a large and comprehensive recent US cohort of thyroid cancer patients, which helps minimize the above limitations.
Conclusions
This study demonstrates significantly increased IRs in all thyroid cancers, particularly CPTC and FVPTC, in virtually all ethnic/demographic groups from 1992 to 2012 in the USA, but the incidence trends were different among different thyroid cancers, particularly sharply differentiable between CPTC and FVPTC. There were uneven IRs and incidence trends of PTC in different ethnic/demographic groups, as exemplified by the fact that IRs of both CPTC and FVPTC were lower in the black females than non-Hispanic white females but the AAPCs were higher in the former than the latter. There is also an interesting suggestion from the most recent 2-3 years that the incidence rise of PTC is likely becoming plateaued in the current and coming few years in the USA.
Supplementary Material
Acknowledgments
This project was supported by USA National Institutes of Health grants R01CA113507 and R01CA189224 to M Xing.
Footnotes
Disclosure of Conflict of Interest: The authors have nothing to disclose.
Declaration of interest: The authors declare that there is no conflict of interest that could be perceived as prejudicing the impartiality of the research reported.
References
- Aschebrook-Kilfoy B, Ward MH, Sabra MM, Devesa SS. Thyroid cancer incidence patterns in the United States by histologic type, 1992-2006. Thyroid. 2011;21:125–134. doi: 10.1089/thy.2010.0021. [DOI] [PMC free article] [PubMed] [Google Scholar]
- Carcangiu ML, Zampi G, Pupi A, Castagnoli A, Rosai J. Papillary carcinoma of the thyroid. Cancer. 1985;55:805–828. doi: 10.1002/1097-0142(19850215)55:4<805::aid-cncr2820550419>3.0.co;2-z. [DOI] [PubMed] [Google Scholar]
- Crile G, Jr, Hazard JB. Relationship of the age of the patient to the natural history and prognosis of carcinoma of the thyroid. Annals of Surgery. 1953;138:33–38. doi: 10.1097/00000658-195307000-00005. [DOI] [PMC free article] [PubMed] [Google Scholar]
- Davies L, Welch GH. Increasing incidence of thyroid cancer in the United States, 1973-2002. JAMA. 2006;295:2164–2167. doi: 10.1001/jama.295.18.2164. [DOI] [PubMed] [Google Scholar]
- Davies L, Welch HG. Current thyroid cancer trends in the United States. JAMA Otolaryngology Head & Neck Surgery. 2014;140:317–322. doi: 10.1001/jamaoto.2014.1. [DOI] [PubMed] [Google Scholar]
- Enewold L, Zhu K, Ron E, Marrogi AJ, Stojadinovic A, Peoples GE, Devesa SS. Rising thyroid cancer incidence in the United States by demographic and tumor characteristics, 1980-2005. Cancer Epidemiology, Biomarkers & Prevention. 2009;18:784–791. doi: 10.1158/1055-9965.EPI-08-0960. [DOI] [PMC free article] [PubMed] [Google Scholar]
- Fritz AG. International Classication of Diseases for Oncology. 3rd. Geneva: World Health Organization; 2000. [Google Scholar]
- Hedinger C, Williams ED, Sobin LH. The WHO histological classification of thyroid tumors: a commentary on the second edition. Cancer. 1989;63:908–911. doi: 10.1002/1097-0142(19890301)63:5<908::aid-cncr2820630520>3.0.co;2-i. [DOI] [PubMed] [Google Scholar]
- Hodgson NC, Button J, Solorzano CC. Thyroid cancer: is the incidence still increasing? Annals of Surgical Oncology. 2004;11:1093–1097. doi: 10.1245/ASO.2004.03.066. [DOI] [PubMed] [Google Scholar]
- Howlader N, Noone AM, Krapcho M, Garshell J, Miller D, Altekruse SF, Kosary CL, Yu M, Ruhl J, Tatalovich Z, et al. SEER Cancer Statistics Review, 1975-2012. National Cancer Institute; Bethesda, MD: 2015. [June 10, 2015]. http://seer.cancer.gov/csr/1975-2012/, based on November 2014 SEER data submission, posted to the SEER web site,April 2015. [Google Scholar]
- Hundahl SA, Fleming ID, Fremgen AM, Menck HR. A National Cancer Data Base report on 53,856 cases of thyroid carcinoma treated in the U.S., 1985-1995. Cancer. 1998;83:2638–2648. doi: 10.1002/(sici)1097-0142(19981215)83:12<2638::aid-cncr31>3.0.co;2-1. [DOI] [PubMed] [Google Scholar]
- Ito Y, Hirokawa M, Uruno T, Kihara M, Higashiyama T, Takamura Y, Miya A, Kobayashi K, Matsuzuka F, Miyauchi A. Prevalence and biological behaviour of variants of papillary thyroid carcinoma: experience at a single institute. Pathology. 2008;40:617–622. doi: 10.1080/00313020802320630. [DOI] [PubMed] [Google Scholar]
- Kilfoy BA, Zheng T, Holford TR, Han X, Ward MH, Sjodin A, Zhang Y, Bai Y, Zhu C, Guo GL, et al. International patterns and trends in thyroid cancer incidence, 1973–2002. Cancer Causes Control. 2009;20:525–531. doi: 10.1007/s10552-008-9260-4. [DOI] [PMC free article] [PubMed] [Google Scholar]
- Kim HJ, Fay MP, Feuer EJ, Midthune DN. Permutation tests for joinpoint regression with applications to cancer rates. Statistics in Medicine. 2000;19:335–351. doi: 10.1002/(sici)1097-0258(20000215)19:3<335::aid-sim336>3.0.co;2-z. [DOI] [PubMed] [Google Scholar]
- Li N, Du XL, Reitzel LR, Xu L, Sturgis EM. Impact of enhanced detection on the increase in thyroid cancer incidence in the United States: Review of incidence trends by socioeconomic status within the Surveillance, Epidemiology, and End Results Registry, 1980-2008. Thyroid. 2013;23:103–110. doi: 10.1089/thy.2012.0392. [DOI] [PMC free article] [PubMed] [Google Scholar]
- Pellegriti G, Frasca F, Regalbuto C, Squatrito S, Vigneri R. Worldwide increasing incidence of thyroid cancer: update on epidemiology and risk factors. Journal of Cancer Epidemiology. 2013;2013:965212. doi: 10.1155/2013/965212. [DOI] [PMC free article] [PubMed] [Google Scholar]
- Rosai J, Zampi G, Carcangiu ML. Papillary carcinoma of the thyroid: A discussion of its several morphologic expressions with particular emphasis on the follicular variant. American Journal of Surgery. 1983;7:809–817. [PubMed] [Google Scholar]
- Shi X, Liu R, Basolo F, Giannini R, Shen X, Teng D, Guan H, Shan Z, Teng W, Musholt TJ, et al. Differential clinicopathological risk and prognosis of major papillary thyroid cancer variants. J Clin Endocrinol Metab. 2016;101:264–274. doi: 10.1210/jc.2015-2917. [DOI] [PMC free article] [PubMed] [Google Scholar]
- Siegel R, Naishadham D, Jemal A. Cancer statistics, 2013. CA: a cancer journal for clinicians. 2013;63:11–30. doi: 10.3322/caac.21166. [DOI] [PubMed] [Google Scholar]
- Surveillance, Epidemiology, and End Results (SEER) Program (www.seer.cancer.gov) SEER*Stat Database: Incidence - SEER 13 Regs Research Data, Nov 2014 Sub (1992-2012) <Katrina/Rita Population Adjustment> - Linked To County Attributes - Total U.S., 1969-2013 Counties, National Cancer Institute, DCCPS, Surveillance Research Program, Surveillance Systems Branch, released April 2015, based on the November 2014 submission.
- Tiwari RC, Clegg LX, Zou Z. Efficient interval estimation for age-adjusted cancer rates. Statistical Methods in Medical Research. 2006;15:547–569. doi: 10.1177/0962280206070621. [DOI] [PubMed] [Google Scholar]
- Xing M. Molecular pathogenesis and mechanisms of thyroid cancer. Nature Reviews Cancer. 2013;13:184–199. doi: 10.1038/nrc3431. [DOI] [PMC free article] [PubMed] [Google Scholar]
- Yu XM, Schneider DF, Leverson G, Chen H, Sippel RS. Follicular variant of papillary thyroid carcinoma is a unique clinical entity: a population-based study of 10,740 cases. Thyroid. 2013;23:1263–1268. doi: 10.1089/thy.2012.0453. [DOI] [PMC free article] [PubMed] [Google Scholar]
Associated Data
This section collects any data citations, data availability statements, or supplementary materials included in this article.