

Abstract
Backgrounds: The deubiquitinating enzyme OTUB1 participates in multiple cellular processes. However, its expression and functions in gastric adenocarcinoma remains unknown. The aim of this study was to investigate the expression of OTUB1 and its biological role in gastric adenocarcinoma. Methods: We used immunohistochemistry to analyze OTUB1 expressions levels in 80 paired samples of gastric adenocarcinoma and adjacent normal tissue (ANT) and 30 samples of intraepithelial neoplasia (IN). We also analyzed the correlation between OTUB1 expression and clinicopathological parameters and patient survival status. Moreover, we performed wound-healing, transwell, RT-qPCR and Western blot assays to evaluate the impact of OTUB1 on tumor migration and invasion. Results: In gastric adenocarcinomas, staining for OTUB1 was localized in the cytoplasm. The proportion of samples that expressed OTUB1 and the intensity of its expression were much higher in gastric adenocarcinoma tissues (61 out of 80, 76.25%) than that in either IN (10 out of 30, 33.33%, p<0.001) or ANT (7 out of 80, 8.75%, p<0.001) samples. In malignant cases, higher expression OTUB1 levels were significantly associated with deeper tumor invasion depths (p=0.02), advanced lymph node status (p=0.008) and TNM stage (p=0.001), lymph duct invasion (p<0.001) and nerve invasion (p=0.013). Univariate and multivariate Cox regression analyses revealed that OTUB1 was an independent risk factor for disease-specific survival but not disease-free survival. In vitro wound-healing and transwell assays showed that OTUB1 overexpression promoted tumor cell migration and invasion in gastric cancer cells. Conclusion: OTUB1 contributes to gastric cancer development by enhancing tumor invasiveness. Targeting OTUB1 should be considered in future molecular therapies.
Keywords: OTUB1, gastric adenocarcinoma, prognosis, invasion
Introduction
Gastric cancer is one of the most common malignancies and the third leading cause of cancer-related deaths worldwide [1]. The majority of gastric cancers are adenocarcinomas. In these cancers, when patients are diagnosed at an advanced stage, they have a poor 5-year survival rate because of the high invasiveness and recurrence of this disease [2]. Because traditional TNM staging can provide only limited prognostic information, identifying new biological markers would be helpful for improving effective targeted therapies.
Ubiquitination is a posttranslational modification that participates in a large number of physical processes by regulating protein stability and signal transduction [3]. Deubiquitinating enzymes (DUBs) can reverse the process of ubiquitination by cleaving the isopeptide bonds of polyubiquitin moieties [4]. OTUB1 (OTU domain-containing ubiquitin aldehyde-binding protein 1, also called Otubain 1) is a DUB that belongs to the ovarian tumor (OTU) protein superfamily [5-7]. A limited number of studies have provided conflicting results regarding the functions of OTUB1. Dai et al. suggested that OTUB1 might have a tumor suppressor function because it induced p53dependent apoptosis and inhibited cell growth [8]. However Herhaus et al. showed that OTUB1 played crucial roles in transforming growth factor-β (TGF-β)-mediated gene transcription and cellular migration by stabilizing SMAD 2/3, suggesting that it might be involved in tumor migration [9]. In agreement with these results, recent studies have reported that OTUB1 is overexpressed and participatesin tumorigenesis in colorectal and prostate cancer [3,10,11]. However, the biological role of OTUB1 in gastric cancer remains unknown.
The primary aim of this study is to investigate whether OTUB1 was detectable in gastric adenocarcinomas and whether it is correlated with clinicopathological features and patient survival. In addition we sought to determine its function in gastric adenocarcinoma using in vitro experiments.
Methods
Patients and tissue handling
A total of 80 patients who underwent radical surgical resection for primary gastric carcinoma at Fudan University Shanghai Cancer Center from 2008 to 2009 were retrospectively evaluated. None of the patients had received preoperative therapy. All of the cases were histopathologically confirmed as gastric adenocarcinoma according to WHO classification of Tumors of the Digestive System 2010 version. Gastric adenocarcinoma stages were determined using the TNM classification system [12]. This study was approved by the Clinical Research Ethics Committee of Fudan University Shanghai Cancer Center. Written informed consent was obtained from all participants who were involved in this study.
Clinicopathological features, including patient’ age, and gender; tumor size, location, histologic stage, and depth of invasion; andthe status of lymphatic and nerve invasion, were collected from the medical record system of Shanghai Cancer Center. Slides and paraffin blocks were collected from the archives of the Pathology Department of Fudan University Shanghai Cancer Center. We selected paraffin-embedded blocks that showed the most obvious lesions for use in the tissue micro arrays (TMAs). A total of 80 paired samples of gastric adenocarcinoma and ANT, in addition to 30 IN samples were studied. All of the cases were reviewed by two pathologists were blind to the results of thestudy. Patient follow-up was performed every 3 months during the first year after surgery and every 3-6 months thereafter until April 30, 2015. Disease-free survival (DFS) was calculated from the date of surgery to the date of recurrence or the last follow-up. Disease-specific survival (DSS) was calculated from the date of surgery to the date of deathor the last follow-up for each specific gastric adenocarcinoma.
Immunohistochemistry and scoring
Immunohistochemistry was performed using the 4-μm-thick TMAs sections. Sections were deparaffinized in xylene, rehydrated in graded alcohol solutions and rinsed in PBS (pH=7.4, Gibco, Thermo Fisher, USA). After we blocked the endogenous peroxidase activity by incubating the slidesin 0.3% H2O2, tissue antigen retrieval was performed at 100°C in boiling water containing 0.01 M citrate (pH 6.0) for 7 minutes. Next, the sections were incubated with anti-OTUB1 antibodies (HPA039176, Sigma-Aldrich, St. Louis, MO USA) at 1:100 dilution overnight at 4°C and then stained using an Envision secondary antibody system (Dako, Agilent, USA). Finally, the signal was visualized using diamino-benzidine and the tissues were counterstained with hematoxylin.
The stained slides were evaluated by two independent experienced pathologists who specialized ingastroenterology. OTUB1 expression in tumor cells was scored using the following combined system as described in previous studies [3,13]: 0 (negative staining in the cytoplasm or weak staining in the cytoplasm, and the area of positive staining <20%), 1 (weak staining in thecytoplasm, and the area of positive staining was between 20-50%), 2 (moderate staining in the cytoplasm, and the area of positive staining was between 50%-75%), and 3 (strong staining in the cytoplasm, and the area of positive staining was >75%). The cases with a score of 0-1 were considered to display low expression, and those with a score of 2-3 were considered to displayhigh expression.
Cell lines and culture conditions
Six human gastric adenocarcinoma cell lines (AGS, HGC-27, MKN-45, MGC-803, SGC-7901, and NCI-N87) and the human normal gastric epithelial cell line GES-1 were purchased from the Fudan University IBS cell bank (Shanghai, China). All of the cells were cultured in Dulbecco’s modified Eagle’s medium (Gibco, Carlsbad, CA, USA) or RMPI-1640 (Gibco, Carlsbad, CA, USA) that was supplemented with 10% fetal bovine serum (FBS) (Gibco, Carlsbad, CA, USA), 50 U/mL penicillin and 50 μg/mL streptomycin (Gibco, Carlsbad, CA, USA). All of the cell lines were maintained at 37°C in a 5% CO2 humidified atmosphere.
Plasmids
The full-length OTUB1 sequence was amplified using PCR from cDNA obtained from AGS cells and then subcloned into the pcDNA3.1 (+) vector (Transheep, Shanghai, China). The pcDNA3.1-OTUB1 construct was constructed by Hanhen Co. Ltd. (Shanghai, China).
Antibodies and reagents
The following antibodies were used: E-Cadherin (#3195), N-Cadherin (D4R1H, #13116), MMP2 (D8N9Y, #13132), MMP9 (D6O3H, #13667) and GAPDH (D16H11, #5174) from Cell Signaling (Boston, Massachusetts, USA). The following reagents were used: Lipofectamine 3000 transfection reagent (Lot. 11668-027, Invitrogen, Carlsbad, CA, USA) and RIPA Lysis buffer (Lot. 89901, Thermo Scientific, USA).
Cell migration and invasion assays
We performed wound-healing and transwell assays to assess the effect of OTUB1 on cell motility and invasive potential. AGS and HGC-27 cells were either transfected with the pcDNA3.1-OTUB1 or pcDNA3.1 vectors and then seeded in 6-well plates. The cells were grown to confluence. Wounds were then scratched into the cultures using a sterile pipette tip, the cells were washed two times with PBS and then serum-free culture medium was added. The wound closing progress was observed every 24 h at 100× under a microscope (BX51, Olympus, Japan).
Cell invasion potential was assayed using transwell chambers (8 μm, 24-well format; Corning Co. NY, USA). A total of 3.0×10⁴ cells in serum-free medium were loaded into the upper inserts, and 500 μL culture medium containing 20% FBS was added into the lower chamber. After 24 h of incubation at 37°C, the cells that had migrated through the filters were fixed in ethanol and stained with crystal violet. The cells were photographed at 200× and counted at 400× under a microscope (BX51, Olympus, Japan).
Western blot analysis
The western blot analysis procedures were performed as previously described [14]. The cell lysates were boiled with loading buffer at 95°C for 5 min, separated on SDS-PAGE gels at 80 V for 2 h and then transferred to PVDF membranes for 2 h. Then, the membranes were blocked in 5% BSA for 30 min and incubated with primary antibodies at 4°C overnight. The membranes were then washed in 1% TBST three times and incubated with secondary antibodies for 1 h. The final detection of the substrates was achieved using an ECL system (#32209, Thermo Fisher, USA).
RNA preparation, reverse transcription, and quantitative real-time polymerase chain reaction (RealTime-qPCR)
Total RNA was extracted from the gastric cancer cell lines using Trizol (Invitrogen, Carlsbad, CA, USA) according to the manufacturer’s protocol. Real-time (RT) and quantitative polymerase chain reaction (qPCR) kits were used to evaluate OTUB1 expression in those cell lines. The RT-qPCR reactions were performed as previously described [15]. Relative gene expression levels were calculated using the comparative cycle threshold (CT) (2-ΔΔCT) method, and Glyceraldehyde-3-phosphate dehydrogenase (GAPDH) was used as the endogenous control to normalize the data. The following primers were used in this study: 5’-CAGC AAGAGATTGACTGTGAG-3’ (forward) and 5’-CTTGATCTTCTGTTGATAGATGTTGTC-3 (reverse) for OTUB1, 5’-GCACCAGGTTTGGAATGGG-3’ (forward) and 5’-CATGTTGGGAGAAGGGGTG-3’ (reverse) for N-cadherin, 5’-GACCGAGAGAGTTTCCCTACG-3’ (forward) and 5’-TCAGGCACCTGACCCTTGTA-3’ (reverse) for E-cadherin, 5’-TACAGGATCATTGGCTACACACC-3’ (forward) and 5’-GGTCACATCGCTCCAGACT-3’ (reverse) for MMP2, and 5’-TGTACCGCTATGGTTACACTCG-3’ (forward) and 5’-GGCAGGGACAGTTGCTTCT-3’ (reverse) for MMP9.
Statistical analysis
The significance of differences between two groups was estimated using Student’s t-tests, while Kruskal-Wallis one-way analysis of variance (ANOVA) was used to compare three or more groups. Associations between clinicopathological features and OTUB1 expression were explored utilizing chi-square tests, or Fisher’s exact probability test when the former was unsuitable. The Kaplan-Meier method and log-rank test were used for survival analysis, and Cox regression models were performed for the univariate and multivariate survival analysis. All statistical analyses were performed using SPSS 20.0 (IBM, SPSS, Chicago, IL, USA). The results were presented as the mean with standard error. A value of p<0.05 was taken to indicate a significant difference.
Results
OTUB1 was upregulated in gastric adenocarcinoma tissues
First, we performed immunohistochemistry experiments to examine the protein expression of OTUB1 in 80 paired gastric adenocarcinoma tissues and adjacent non-tumor (ANT) tissues, as well as 30 cases of intraepithelial neoplastic (IN) samples. We found that the OTUB1 signal in the gastric tumors was localized in the cytoplasm, which was consistent with the results of previous studies [3,10] (Figure 1). Staining for OTUB1 was more intense in gastric adenocarcinoma tissues than in either IN or ANT tissues (Figure 2). There were more samples with high OTUB1 expression in the gastric adenocarcinoma tissues (61 out of 80, 76.25%) than in either the IN (10 out of 30, 33.33%, p<0.001) or ANT tissues (7 out of 80, 8.75%, p<0.001). Taken together, these data indicate that OTUB1 was highly expressed in gastric adenocarcinoma.
Figure 1.
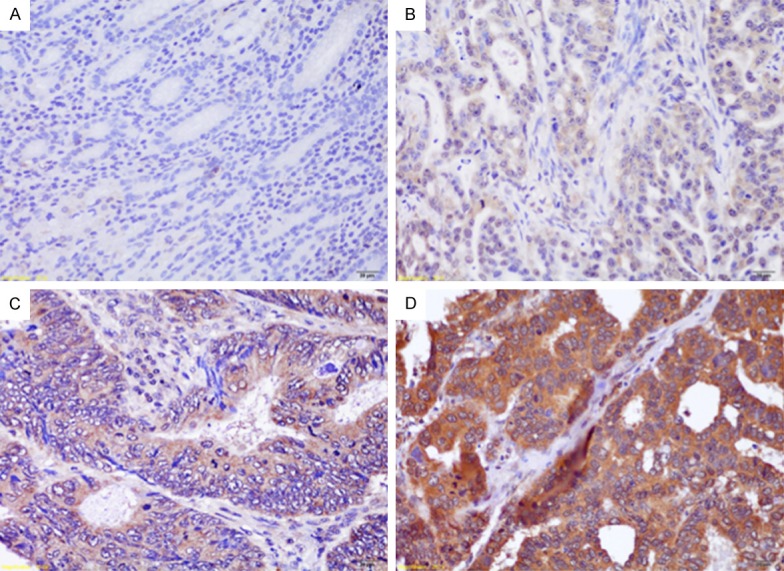
Examples of tissue samples with immunochemistry scores for OTUB1: 0 (A), 1 (B), 2 (C) and 3 (D). (Scale bars, 20 μm).
Figure 2.
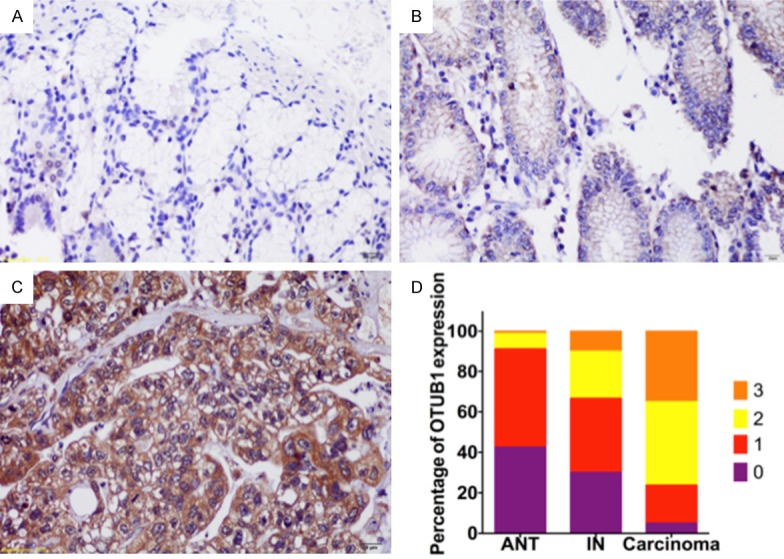
OTUB1 was highly expressed in GC. Immunochemistry results for OTUB1 in paratumorous (A), intraepithelial neoplasia (B) and gastric carcinoma (C) tissues. The expression scores for OTUB1 are showngraphed (D).
OTUB1 expression is correlated with clinicopathological factors ingastric adenocarcinoma
We next analyzed correlations between OTUB1 expression and clinicopathological features inpatients with gastric adenocarcinoma. As shown in Table 1, high OTUB1 expression was significantly associated with aggressive tumor features including deeper invasion depth (p=0.020), advanced lymph node status (p=0.008) and TNM stage (p=0.001), lymph duct invasion (p<0.001) and nerve invasion (p=0.013). However, no significant correlation was found between the expression of OTUB1 and gender, tumor size, and tumor differentiation grade.
Table 1.
Relationship between OTUB1 expression and clinicopathological features in GC patients
| Clinicopathological Features | N | % | OTUB1 Expression | χ2 | P value | ||
|---|---|---|---|---|---|---|---|
|
| |||||||
| Low | High | ||||||
| All cases | 80 | 100 | 19 | 61 | |||
| Age (years) | <60 | 35 | 43.75 | 9 | 26 | 0.133 | 0.716 |
| ≥60 | 45 | 56.25 | 10 | 35 | |||
| Gender | Male | 65 | 81.25 | 18 | 47 | 1.927 | 0.165 |
| Female | 15 | 18.75 | 1 | 14 | |||
| Tumor location | Upper | 19 | 23.75 | 9 | 10 | 11.675 | 0.009* |
| Middle | 25 | 31.25 | 1 | 24 | |||
| (Stomach) | Lower | 25 | 31.25 | 7 | 18 | ||
| Entire | 11 | 13.75 | 2 | 9 | |||
| Tumor size | <5 cm | 58 | 72.50 | 15 | 43 | 0.520 | 0.471 |
| ≥5 cm | 22 | 27.50 | 4 | 18 | |||
| Tumor grade | Low | 24 | 30.00 | 4 | 20 | 0.950 | 0.330 |
| High | 56 | 70.00 | 15 | 41 | |||
| Tumor depth | T1 | 5 | 6.25 | 3 | 2 | 9.787 | 0.020* |
| T2 | 16 | 20.00 | 6 | 10 | |||
| T3 | 15 | 18.75 | 5 | 10 | |||
| T4 | 44 | 55.00 | 5 | 39 | |||
| Lymph node | N0 | 23 | 28.75 | 11 | 12 | 11.819 | 0.008* |
| Station | N1 | 7 | 8.75 | 2 | 5 | ||
| N2 | 24 | 30.00 | 4 | 20 | |||
| N3 | 26 | 32.50 | 2 | 24 | |||
| Metastasis | - | 68 | 85.00 | 18 | 50 | 0.987 | 0.321 |
| + | 12 | 15.00 | 1 | 11 | |||
| TNM stage | I-II | 29 | 36.25 | 13 | 16 | 11.160 | 0.001* |
| III-IV | 51 | 63.75 | 6 | 45 | |||
| Lymph duct invasion | - | 31 | 38.75 | 14 | 17 | 12.813 | <0.001* |
| + | 49 | 61.25 | 5 | 44 | |||
| Nerve invasion | - | 39 | 48.75 | 14 | 25 | 6.201 | 0.013* |
| + | 41 | 51.25 | 5 | 36 | |||
p<0.05.
OTUB1 overexpression predicts a poor prognosis
To investigate the potential influence of OTUB1 on survival, we conducted a Kaplan-Meier analysis to assess survival inpatients with gastric adenocarcinoma. Tissue samples were divided according to their level of expression of OTUB1 into low (n=19) and high (n=61) groups using the scoring system described in the Methods section and previous studies [3,10]. The total median follow-up time for all patients who were still alive at the endpoint in this analysis was 44 months. In the subgroups, the median follow-up time for the patients who were still alive at the endpoint was 32 months in the group with high OTUB1 expression and 58 months in the group with low OTUB1 expression. Of the 80 patients included in the study, 39 died during follow-up.
The Kaplan-Meier analysis and log-rank tests showed that patients with higher OTUB1 expression levels had dramatically shorter DFS (Figure 3A, p=0.007) and DSS (Figure 3B, p=0.001) than were observed in those with lower levels. A further multivariate Cox analysis revealed that OTUB1 expression (p=0.043) was the independent risk factor for DSS but not for DFS in gastric adenocarcinoma (Tables 2, 3).
Figure 3.
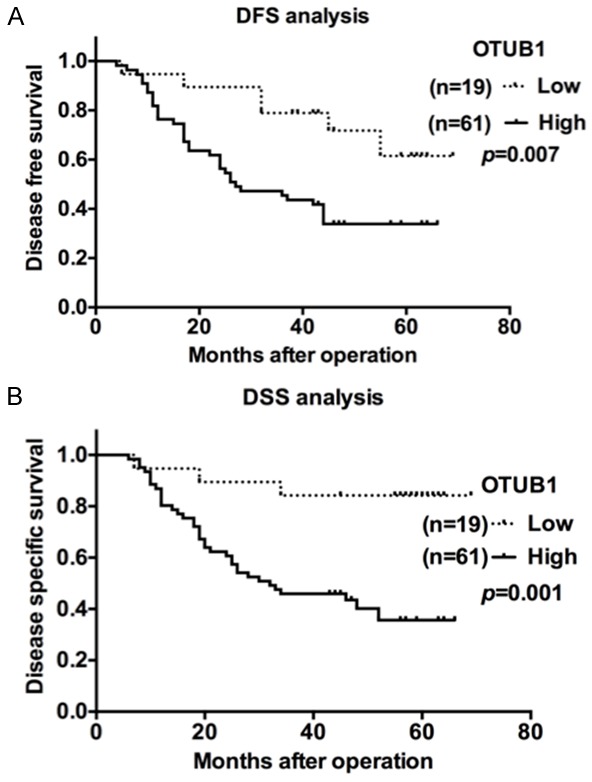
OTUB1 predicts a poor prognosis in gastric cancer. A. Kaplan-Meier disease-free survival (DFS) curves for GC patients with different OTUB1 levels (low, n=19 vs. high, n=61). B. Kaplan-Meier disease-specific survival (DSS) curves for GC patients with different OTUB1 levels (low, n=19 vs. high, n=61).
Table 2.
Univariate and Multivariate analyses of Disease-free survival in GC
| Variables | Categories | Univariate analysis | P value | Multivariate analysis | P value | ||
|---|---|---|---|---|---|---|---|
|
|
|
||||||
| HR | 95% CI | HR | 95% CI | ||||
| Tumor location | (Upper/Middle/Lower/Diffuse) | 1.215 | 0.906-1.629 | 0.194 | |||
| TNM stage | I-II/III-IV | 4.953 | 2.290-10.715 | <0.001* | 4.276 | 1.933-9.461 | <0.001* |
| Tumor size | <5 cm/≥5 cm | 1.334 | 0.715-2.492 | 0.365 | |||
| Tumor grade | (Low/High) | 0.944 | 0.512-1.738 | 0.852 | |||
| Lymphatic invasion | -/+ | 1.791 | 0.968-3.315 | 0.064 | |||
| Nerve invasion | -/+ | 2.003 | 1.111-3.614 | 0.021* | |||
| Tumor depth | 1/2/3/4 | 1.980 | 1.349-2.906 | <0.001* | |||
| N station | 0/1/2/3 | 1.666 | 1.273-2.182 | <0.001* | |||
| Metastasis | -/+ | 3.541 | 1.779-7.047 | <0.001* | 2.168 | 1.074-4.376 | 0.031* |
| OTUB1 expression | Low/High | 3.241 | 1.372-7.657 | 0.007* | |||
HR, hazard ratio; 95% CI, 95% confidence interval
p<0.05.
Table 3.
Univariate and Multivariate analyses of Disease-specific survival in GC
| Variables | Categories | Univariate analysis | P value | Multivariate analysis | P value | ||
|---|---|---|---|---|---|---|---|
|
|
|
||||||
| HR | 95% CI | HR | 95% CI | ||||
| Location | (Upper/Middle/Lower/Diffuse) | 1.241 | 0.894-1.724 | 0.197 | |||
| TNM stage | I-II/III-IV | 5.237 | 2.162-12.685 | <0.001* | 3.944 | 1.592-9.772 | 0.003* |
| Tumor size | <5 cm/≥5 cm | 1.560 | 0.801-3.038 | 0.191 | |||
| Tumor grade | (Low/High) | 0.844 | 0.434-1.644 | 0.618 | |||
| Lymphatic invasion | -/+ | 2.459 | 1.163-5.201 | 0.019* | |||
| Nerve invasion | -/+ | 1.879 | 0.980-3.603 | 0.057 | |||
| Tumor depth | 1/2/3/4 | 1.934 | 1.264-2.959 | 0.002* | |||
| N station | 0/1/2/3 | 1.657 | 1.229-2.235 | 0.001* | |||
| Metastasis | -/+ | 2.747 | 1.292-5.837 | 0.009* | |||
| OTUB1 expression | Low/High | 5.512 | 1.681-18.072 | 0.005* | 3.524 | 1.039-11.957 | 0.043* |
HR, hazard ratio; 95% CI, 95% confidence interval
p<0.05.
Experiments to establisheffective OTUB1 overexpressing cell lines
Because we found that OTUB1 expression was highly correlated with theinvasion-related index (Table 1), we next sought to determine what its functions are in cell invasion and mobility in vitro. The baseline expression of OTUB1 was examined in six gastric cancer cell lines including AGS, HGC-27, MGC-803, MKN-45, SGC-7901, and NCI-N87, in addition to the human normal gastric epithelial cell line GES-1, at both the RNA level and protein level. We found that OTUB1 was significantly overexpressed in gastric adenocarcinoma cell lines, while AGS and HGC-27 cells expressed the lowest levels of OTUB1 (Figure 4A, 4B). We therefore chose AGS and HGC-27 cells as the candidate cell lines for the interference experiments. We performed RT-qPCRat 48 hours after the cells were transiently expressed with pcDNA3.1-OTUB1, when they demonstrated effective upregulation of OTUB1 mRNA compared to the pcDNA3.1-vector-transfectedcontrols (Figure 4C).
Figure 4.
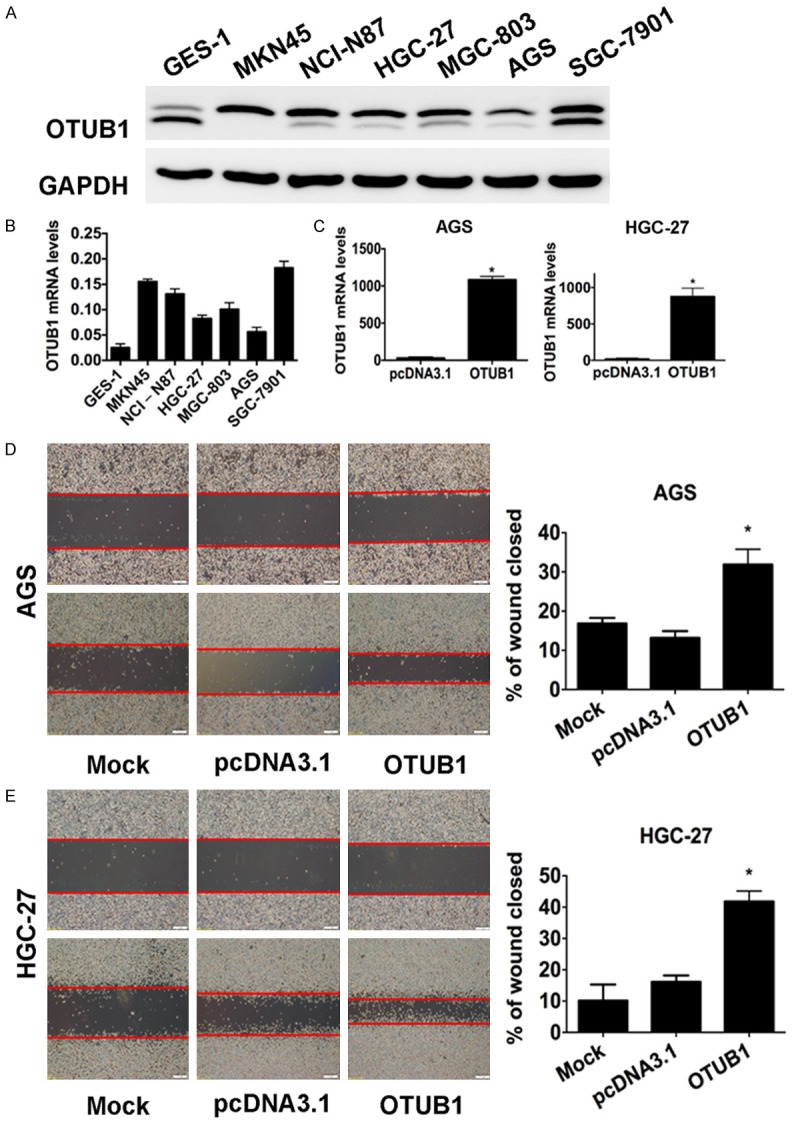
OTUB1 is overexpressed, and induced tumor cell migration in GC cell lines. A. Results of western blot analysis showing baseline OTUB1 levels in GES-1 and 6 GC cell lines. GAPDH was used as the endogenous control. B. A statistical analytical graph showing the baseline OTUB1 mRNA levels in the GES-1 and 6 GC cell lines, which were detected using RT-qPCR. C. A statistical analytical graph of OTUB1 mRNA levels in AGS and HGC-27 cells that were transfected with pcDNA3.1-OTUB1 and analyzed using RT-qPCR. *: p<0.01. D. Representative images (left) and quantification (right) of wound-healing assays performed using AGS cells (scale bars, 400 µm). *: p<0.01. E. Representative images (left) and quantification (right) of wound-healing assays performed using HGC-27 cells (scale bars, 400 µm). *: p<0.01.
OTUB1 enhanced tumor cell migration and invasion
Finally, we performed wound-healing and transwell assays to determine the influence of OTUB1 on tumor cell migration and invasion. We found that AGS and HGC-27 cells that overexpressed OTUB1 displayed significantly enhanced mobility (Figure 4D, 4E, p<0.05) and invasiveness (Figure 5A, p<0.05). Similarly, the results of RT-qPCR and Western blot analyses results confirmed that overexpressing OTUB1 in AGS and HGC-27 cells induced the expression of invasion-promoting genes such as N-Cadherin, MMP2 and MMP9 but suppressed E-Cadherin (Figure 5B, 5C). Collectively, these data suggest that OTUB1 promoted tumor cell migration and invasion in gastric carcinoma.
Figure 5.
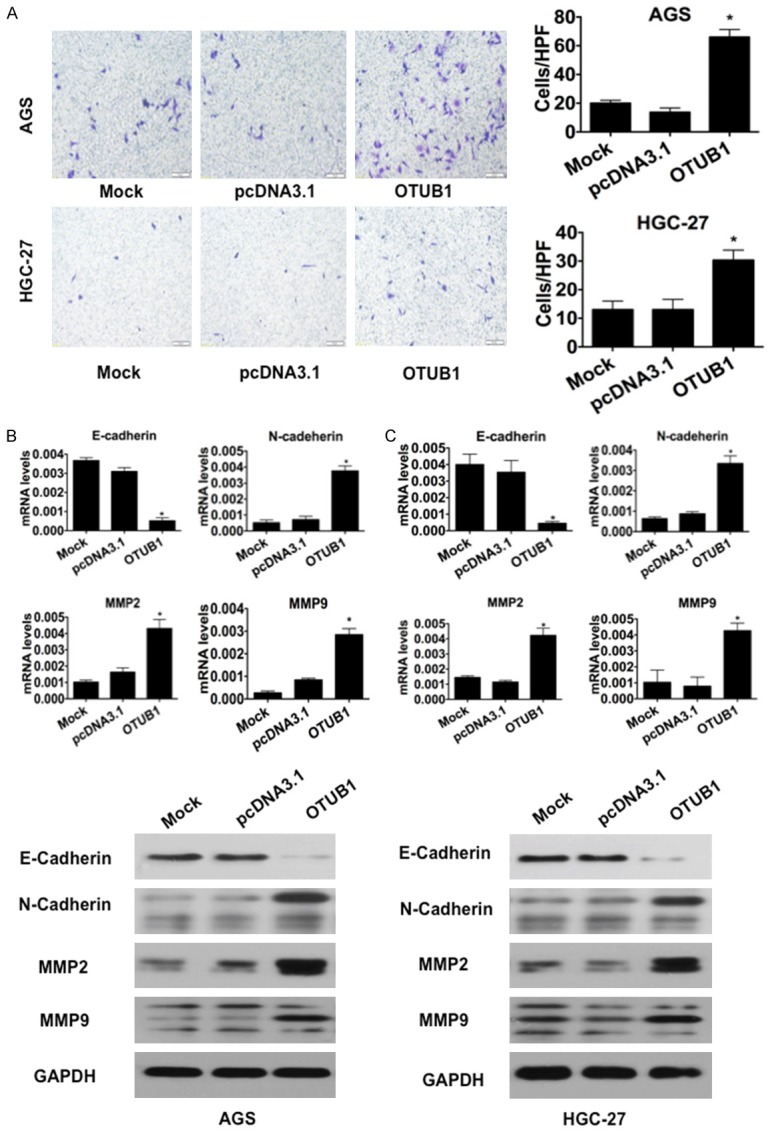
OTUB1 induced tumor cell invasion in GC cells. A. Representative images (left) and quantification (right) ofthe results of transwell invasion assays for the indicated cell lines (scale bars, 50 µm). *: p<0.01. **: p<0.05. B. Results of RT-qPCR and immunoblotting for E-cadherin, N-cadherin, MMP2 and MMP9 in AGS cells. GAPDH was used as the reference control. *: p<0.01. C. Results of RT-qPCR and immunoblotting for E-cadherin, N-cadherin, MMP2 and MMP9 in HGC-27 cells. GAPDH was used as the reference control. *: p<0.01.
Discussion
To our knowledge, this study is the first to investigate the expression of OTUB1 in a cohort of gastric cancer. We found that cells expressing higher levels of OTUB1 were associated with adverse clinicopathological features and lower survival rates in gastric adenocarcinoma patients. In vitro experiments further suggested that OTUB1 promoted tumor progression by enhancing tumor cell migration and invasion. We have therefore identified OTUB1 as a valuable prognostic biomarker for gastric adenocarcinoma.
Consistent with the results of previous reports, which showed that OTUB1 was upregulated in colorectal cancer [3,10], our study found that the proportion of samples with OTUB1 expression and the intensity of OTUB1 staining were much higher in gastric adenocarcinoma tissues than that in paired ANT tissues and IN tissues. In addition, OTUB1 expression levels were dramatically higher in IN tissues than in paired ANT tissues. This difference in the expression levels of OTUB1 between gastric ANT, IN and gastric adenocarcinoma indicatesthat OTUB1 expression increases with the malignant transformation of gastric lesions. Similar to the results in the sample tissues, we also found that the expression of OTUB1 was higher in gastric cancer cell lines than in normal gastric cells. Moreover, higher OTUB1 expression levels were significantly associated with advanced TNM stage and poorer survival in gastric adenocarcinoma patients. These results collectively indicate that OTUB1 is a potentially valuable prognostic predictor in clinical practice. Future studies containing larger samples with matching numbers of gastric adenocarcinoma, IN and ANT cases might support this suggestion. Moreover, it would be better if chronic gastritis cases were included in the research because it is currently believed that morphological lesions sequentially progress from normal mucosa to long-standing chronic gastritis to intraepithelial neoplasia to invasive carcinoma [16,17].
Because it isa relatively new oncogene that was first reported in 2003 [5], there is some debate regarding the biological role played by OTUB1 in tumorigenesis [8]. Dai et al. found that OTUB1 directly suppressed p53 ubiquitination to activate p53 and inhibit cell proliferation. This regulatory role of OTUB1 was observed in both lung cancer and osteosarcoma cell lines, suggesting that it might have broader tumor suppressor functions [8]. In addition, researchers have reported that the expression level of OTUB1 was elevated in colon and prostate cancer [3,10,11], and in breast cancer, OTUB1 overexpression was linked to chemotherapy sensitivity and poorer outcome in patients [18]. We hypothesized that OTUB1 might have complex effects in different types of malignancies because it regulates the expression and activity of many substrates and participates in multiple cell signaling pathways [7,19-21].
The present study demonstrates that OTUB1 critically contributes to the pathogenesis and aggressive biology of gastric adenocarcinoma. Although our research does notreveal the details of the mechanisms underlying OTUB1 functions, we believe thatit might prompt tumor cell invasion by modulating the activity of the TGF-β pathway. According to the reports of Herhaus et al., OTUB1 enhances TGF-β signaling by stabilizing SMAD 2/3 [9], to thereby promote tumor progression by inducing cell migration and epithelial-mesenchymal transition (EMT) [22]. Consistent with this notion, a study by Zhou et al. revealed that OTUB1 promotescolorectal cancer metastasis by facilitating EMT [3]. Similarly, we observed that the levels of invasion-promoting genes, including MMP2, MMP9 and N-Cadherin, were positively correlated with OTUB1 expression in gastric cell lines, whereas the expression of the invasion-suppressing gene E-cadherin was dramatically depressed after OTUB1 was transiently overexpressed. Future studies should focus on the molecules that are downstream of OTUB1 toilluminate the details of there gulatorynetwork controlled by OTUB1 in gastric cancer.
Conclusions
Our research shows that OTUB1 promotes tumor migration and invasion and that OTUB1 expression is dramatically elevated in gastric adenocarcinoma tissues. Higher levels of OTUB1 expression were significantly associated with advanced TNM stage and poor prognoses. OTUB1 is therefore a potentially valuable prognostic biomarker and therapeutic target for treating gastric cancer in clinical practice.
Acknowledgements
This study was supported by the grant from the Science and Technology Commission of Shanghai Municipality (No. 10DJ1400501), the National Clinical Key Discipline (2011-2015), Priority of Shanghai key discipline of medicine (2013-2015), the Shanghai R&D public service platform construction projects (12DZ2295100), the National Natural Science Foundation of China (81472220 and 81272299), and the Shanghai Science and Technology Development Fund (Domestic Science and Technology Cooperation Project, No. 14495800300).
Disclosure of conflict of interest
None.
References
- 1.Siegel R, Ma J, Zou Z, Jemal A. Cancer statistics, 2014. CA Cancer J Clin. 2014;64:9–29. doi: 10.3322/caac.21208. [DOI] [PubMed] [Google Scholar]
- 2.Hartgrink HH, Jansen EP, van Grieken NC, van de Velde CJ. Gastric cancer. Lancet. 2009;374:477–490. doi: 10.1016/S0140-6736(09)60617-6. [DOI] [PMC free article] [PubMed] [Google Scholar]
- 3.Zhou Y, Wu J, Fu X, Du W, Zhou L, Meng X, Yu H, Lin J, Ye W, Liu J, Peng H, Liu RY, Pan C, Huang W. OTUB1 promotes metastasis and serves as a marker of poor prognosis in colorectal cancer. Mol Cancer. 2014;13:258. doi: 10.1186/1476-4598-13-258. [DOI] [PMC free article] [PubMed] [Google Scholar]
- 4.Komander D, Rape M. The ubiquitin code. Annu Rev Biochem. 2012;81:203–229. doi: 10.1146/annurev-biochem-060310-170328. [DOI] [PubMed] [Google Scholar]
- 5.Balakirev MY, Tcherniuk SO, Jaquinod M, Chroboczek J. Otubains: a new family of cysteine proteases in the ubiquitin pathway. EMBO Rep. 2003;4:517–522. doi: 10.1038/sj.embor.embor824. [DOI] [PMC free article] [PubMed] [Google Scholar]
- 6.Wiener R, Zhang X, Wang T, Wolberger C. The mechanism of OTUB1-mediated inhibition of ubiquitination. Nature. 2012;483:618–622. doi: 10.1038/nature10911. [DOI] [PMC free article] [PubMed] [Google Scholar]
- 7.Soares L, Seroogy C, Skrenta H, Anandasabapathy N, Lovelace P, Chung CD, Engleman E, Fathman CG. Two isoforms of otubain 1 regulate T cell anergy via GRAIL. Nat Immunol. 2004;5:45–54. doi: 10.1038/ni1017. [DOI] [PubMed] [Google Scholar]
- 8.Sun XX, Challagundla KB, Dai MS. Positive regulation of p53 stability and activity by the deubiquitinating enzyme Otubain 1. EMBO J. 2012;31:576–592. doi: 10.1038/emboj.2011.434. [DOI] [PMC free article] [PubMed] [Google Scholar]
- 9.Herhaus L, Al-Salihi M, Macartney T, Weidlich S, Sapkota GP. OTUB1 enhances TGFbeta signalling by inhibiting the ubiquitylation and degradation of active SMAD2/3. Nat Commun. 2013;4:2519. doi: 10.1038/ncomms3519. [DOI] [PMC free article] [PubMed] [Google Scholar]
- 10.Liu X, Jiang WN, Wang JG, Chen H. Colon cancer bears overexpression of OTUB1. Pathol Res Pract. 2014;210:770–773. doi: 10.1016/j.prp.2014.05.008. [DOI] [PubMed] [Google Scholar]
- 11.Iglesias-Gato D, Chuan YC, Jiang N, Svensson C, Bao J, Paul I, Egevad L, Kessler BM, Wikstrom P, Niu Y, Flores-Morales A. OTUB1 de-ubiquitinating enzyme promotes prostate cancer cell invasion in vitro and tumorigenesis in vivo. Mol Cancer. 2015;14:8. doi: 10.1186/s12943-014-0280-2. [DOI] [PMC free article] [PubMed] [Google Scholar]
- 12.Wittekind C, Compton CC, Greene FL, Sobin LH. TNM residual tumor classification revisited. Cancer. 2002;94:2511–2516. doi: 10.1002/cncr.10492. [DOI] [PubMed] [Google Scholar]
- 13.Ruiter DJ, Ferrier CM, van Muijen GN, Henzen-Logmans SC, Kennedy S, Kramer MD, Nielsen BS, Schmitt M. Quality control of immunohistochemical evaluation of tumour-associated plasminogen activators and related components. European BIOMED-1 Concerted Action on Clinical Relevance of Proteases in Tumour Invasion and Metastasis. Eur J Cancer. 1998;34:1334–1340. doi: 10.1016/s0959-8049(98)00151-8. [DOI] [PubMed] [Google Scholar]
- 14.Wang YQ, Xu MD, Weng WW, Wei P, Yang YS, Du X. BCL6 is a negative prognostic factor and exhibits pro-oncogenic activity in ovarian cancer. Am J Cancer Res. 2015;5:255–266. [PMC free article] [PubMed] [Google Scholar]
- 15.Qi P, Xu MD, Ni SJ, Huang D, Wei P, Tan C, Zhou XY, Du X. Low expression of LOC285194 is associated with poor prognosis in colorectal cancer. J Transl Med. 2013;11:122. doi: 10.1186/1479-5876-11-122. [DOI] [PMC free article] [PubMed] [Google Scholar]
- 16.Fassan M, Simbolo M, Bria E, Mafficini A, Pilotto S, Capelli P, Bencivenga M, Pecori S, Luchini C, Neves D, Turri G, Vicentini C, Montagna L, Tomezzoli A, Tortora G, Chilosi M, De Manzoni G, Scarpa A. High-throughput mutation profiling identifies novel molecular dysregulation in high-grade intraepithelial neoplasia and early gastric cancers. Gastric Cancer. 2014;17:442–449. doi: 10.1007/s10120-013-0315-1. [DOI] [PubMed] [Google Scholar]
- 17.Rugge M, Pennelli G, Pilozzi E, Fassan M, Ingravallo G, Russo VM, Di Mario F. Gastritis: the histology report. Dig Liver Dis. 2011;43(Suppl 4):S373–384. doi: 10.1016/S1590-8658(11)60593-8. [DOI] [PubMed] [Google Scholar]
- 18.Karunarathna U, Kongsema M, Zona S, Gong C, Cabrera E, Gomes AR, Man EP, Khongkow P, Tsang JW, Khoo US, Medema RH, Freire R, Lam EW. OTUB1 inhibits the ubiquitination and degradation of FOXM1 in breast cancer and epirubicin resistance. Oncogene. 2016;35:1433–44. doi: 10.1038/onc.2015.208. [DOI] [PMC free article] [PubMed] [Google Scholar]
- 19.Goncharov T, Niessen K, de Almagro MC, Izrael-Tomasevic A, Fedorova AV, Varfolomeev E, Arnott D, Deshayes K, Kirkpatrick DS, Vucic D. OTUB1 modulates c-IAP1 stability to regulate signalling pathways. EMBO J. 2013;32:1103–1114. doi: 10.1038/emboj.2013.62. [DOI] [PMC free article] [PubMed] [Google Scholar]
- 20.Li S, Zheng H, Mao AP, Zhong B, Li Y, Liu Y, Gao Y, Ran Y, Tien P, Shu HB. Regulation of virus-triggered signaling by OTUB1- and OTUB2-mediated deubiquitination of TRAF3 and TRAF6. J Biol Chem. 2010;285:4291–4297. doi: 10.1074/jbc.M109.074971. [DOI] [PMC free article] [PubMed] [Google Scholar]
- 21.Nakada S, Tai I, Panier S, Al-Hakim A, Iemura S, Juang YC, O’Donnell L, Kumakubo A, Munro M, Sicheri F, Gingras AC, Natsume T, Suda T, Durocher D. Non-canonical inhibition of DNA damage-dependent ubiquitination by OTUB1. Nature. 2010;466:941–946. doi: 10.1038/nature09297. [DOI] [PubMed] [Google Scholar]
- 22.Akhurst RJ, Hata A. Targeting the TGFbeta signalling pathway in disease. Nat Rev Drug Discov. 2012;11:790–811. doi: 10.1038/nrd3810. [DOI] [PMC free article] [PubMed] [Google Scholar]