

Abstract
The dynamic and reversed expression of GATA1 and GATA2 are essential for proper erythroid differentiation. Our previous work demonstrates that LSD1, a histone H3K4 demethylase, represses GATA2 expression at late stage of erythroid differentiation. K562 and MEL cells were used and cultured in Roswell Park Memorial Institute-1640 medium (RPMI) and Dulbecco’s modified Eagle’s medium (DMEM), respectively. Western blot assay was used to examine the GATA1, GATA2, TAL1, HDAC1, HDAC2, CoREST and β-actin protein. The immunoprecipitation assay and GST pull-down assay were employed to detect the precipitated protein complexes and investigate the interaction between the proteins. The small interfering RNA (siRNA) and nonspecific control siRNA were synthesized to silence the target genes. Double fluorescence immunostaining was used to observe the association of LSD1 with GATA2 in K562 cells. The results indicated that knockdown of LSD1 in K562 cell causes increased H3K4 di-methylation at GATA1 locus and activates GATA1 expression, demonstrating that LSD1 represses GATA1 expression through LSD1-mediated histone demethylation. Upon induced erythroid differentiation of K562 cells, the interaction between GATA2 and LSD1 is decreased, consistent with a de-repression of GATA1 expression. Meanwhile, the interaction between TAL1 and LSD1 is increased, which forms a complex that efficiently suppresses GATA2 expression. In conclusion, these observations reveal an elegant mechanism to modulate GATA1 and GATA2 expression during erythroid differentiation. While LSD1 mainly forms complex with GATA2 to repress GATA1 expression in hematopoietic progenitor cells, it mostly forms complex with TAL1 to repress GATA2 expression in differentiated cells.
Keywords: GATA1, GATA2, LSD1, histone modification
Introduction
During erythoid differentiation, lineage- and stage-specific gene expression is or chestrated by highly interactive networks of transcription factors and epigenetic regulators. GATA1, which binds to the GATA binding site (T/A) GATA (A/G), is a key transcription factors that regulate erythorid differentiation [1-4]. GATA2 is predominantly expressed in hematopoietic stem cells (HSC) and early hematopoietic progenitor cells, and is essential for their proliferation and maintenance [5-7]. In contrast to GATA2, the expression of GATA1 is first initiated at the early stage of erythroid differentiation, which regulates the expression of a series of erythroid-specific genes for further differentiation. At the late stage of erythroid differentiation, GATA1 expression is increased further by GATA1-mediated auto-regulation. Meanwhile, the increased level of GATA1 also replaces GATA2 at the GATA binding sites in the GATA2 gene and suppresses the expression of GATA2 [8-10]. Such transition of dominant GATA transcription factors has been termed as the “GATA Factor Switching”.
The dynamic expression of GATA1 is crucial for proper erythroid differentiation, and is tightly regulated by interactions among multiple transcription factors, epigenetic regulators and cis-regulatory elements in the Gata1 gene locus. Gata1 locus contains multiple cis-regulatory elements involved in the regulation of Gata1 gene expression, including a Gata1 hematopoietic enhancer (G1HE), a palindromic GATA-binding site (dbG) and two adjacent CACCC boxes [11-15]. Upon erythroid differentiation, demethylation of GATA1 gene regulatory regions allows increased GATA2 binding to the GATA binding sites, which promotes the GATA1 gene expression in early hematopoietic progenitor cells [16].
Histone modifications, such as acetylation, phosphorylation, and methylation, play pivotal roles in regulating gene expression by altering chromatin structure [17-19]. Lysine methylation in vivo constitutes important regulatory signals that demarcate either negative or positive regulation of gene expression, depending on the context of a particular lysine residue and the number of methyl moieties added [20,21]. For example, genes that are repressed are generally associated with methylated lysine 9 or 27 on histone H3 (denoted as H3K9 and H3K27), whereas genes with active transcription are marked by methylations at H3K4, H3K36 and H3K79 residues [22]. Although histone methylation was suggested to be irreversible for a long time, the identification of the site-specific histone demethylases provides compelling evidence that this modification is dynamically regulated [23-26]. Lysine methylation is controlled by the opposing activities of lysine methyltransferases (KMTs) and lysine demethylases (KDMs) [24,27,28]. Lysine demethylases (KDMs) consist of the flavin adenine dinucleotide (FAD)-dependent lysine-specific demethylases, LSD1 and LSD2 [29-31], and the Jumonji C domain-containing histone demethylases [24]. LSD1 is the first identified histone demethylase, which contains three major domains: an N-terminal Swi3p/Rsc8p/Moira (SWIRM) domain, a C-terminal amine oxidase-like (AOL) domain, and a central protruding Tower domain [32-34]. LSD1 associates with other co-repressors such as HDAC1/2 and CoREST to form a core ternary complex, which is recruited to their target sites to repress transcription [35]. Since its identification, LSD1 has been shown to be crucial for a number of cellular processes, including ES cell pluripotency, cellular proliferation, and differentiation [36-41]. Knockdown of LSD1 disrupts normal erythroid differentiation.
Our previous work demonstrates that LSD1 interacts with T cell acute lymphocytic leukemia 1 (TAL1), another key transcription factor required for hematopoietic differentiation, and suppresses expression of TAL1 target genes through H3K4 demethylation [42,43]. For instance, LSD1 is recruited to the regulatory region of GATA2 gene by TAL1 and suppress GATA2 expression at late stage of erythroid differentiation [44]. Here, we report that LSD1 can form complex with GATA2 and TAL1 to repress GATA1 expression at undifferentiated cells.
Materials and methods
Cells culture and cell differentiation
K562 and MEL were gifts from Dr. Zhe Li (Harvard University). K562 cells were cultured in Roswell Park Memorial Institute-1640 medium (RPMI) (Gibco) with 10% fetal bovine serum (FBS), 100 U/ml of penicillin and 100 μg/ml of steptomycin. MEL cells were cultured in Dulbecco’s modified Eagle’s medium (DMEM) (Gibco) with 10% FBS, 100 U/ml of penicillin and 100 μg/ml of steptomycin. Cells were maintained at 37°C and 5% CO2 in a humidified incubator. For erythroid differentiation, K562 cells were treated with 40 μM hemin, while MEL cells were treated with 1% DMSO.
Western blot assay
Whole cell extracts were prepared by ice-cold whole cell extraction buffer (WCEB), which contains 25 mM β-glycerophosphate (pH 7.3), 5 mM EDTA, 2 mM EGTA, 5 mM β-mercaptoethanol, 1% Triton X-100, 0.1 M NaCl, and a protease inhibitor mixture (Roche Applied Science). The protein concentrations of whole cell lysateswere determined by Bradford methods. Equal amounts of protein (30 μg) wereboiled with SDS sample buffer (50 mM Tris [pH 6.8], 100 mM DTT, 2% SDS, 0.1% bromophenol blue, 10% glycerol) for 5 minutes, fractionatedby 10% SDS polyacrylamide gels (PAGE) and transferred to polyvinylidene fluoride (PVDF) membranes. After blocking in TBST with 3% bovine serum albumin (BSA) at 37°C for 1 hour, the membranes were incubated with the mouse anti-human LSD1 (ab17721, Abcam, UK), anti-huam GATA1 (ab11852, Abcam, UK), anti-human GATA2 (ab22849, Abcam, UK), anti-human TAL1 (ab75739, Abcam, UK), ant-human HDAC1 (ab7028, Abcam, UK), anti-human HDAC2 (ab7029, Abcam, UK) monoclonal antibodies and mouse anti-human CoREST (#07-455, Millipore, USA) monoclonal antibody and mouse anti-human β-actin (TA-09, ZSGB-BIO, USA) monoclonal antibody at 4°C overnight, washed 4×15 minutes in TBST, and incubated with appropriate horseradish peroxidase (HRP)-conjugated goat anti-rabbit polyclonal antibody (bs-0295G, Bioss, USA) and HRP-conjugated goat anti-mouse monoclonal antibody (bs-0296G, Bioss, USA) at 37°C for 1 hour. The membranes were washed 4×15 minutes in TBST and visualized by Tanon-5200 Chemiluminescent Imaging System (Tanon Science & Technology).
Immunoprecipitation
Nuclear extracts were prepared as described perviously [42]. Nuclear extract (800 μg) were incubated with 15 μg anti-LSD1 or 15 ug anti-GATA2 antibodies overnight and conjugated to Dynabeads Protein G (Novex by Life Technologies, 150198430) at 4°C for 2 hours. The beads were washed with RIPA buffer for three times (15 minutes each time), and protein was eluted with SDS sample buffer. The precipitated protein complexes were analyzed by 10% SDS-PAGE and Western blot.
GST pull-down assay
Glutathinoe-S-transferase (GST)-tagged LSD1 proteins were prepared as described previously [42]. Expression of GST-tagged LSD1 was confirmed by SDS-PAGE and Coomassie blue staining. Nuclear extracts (500 μg) were incubated with equal amount of GST-tagged LSD1 proteins at 4°C overnight. After washing with RIPA buffer (1% DOC Sodium deoxgoholate, 0.1% SDS) for 3 times, the proteins that bound to the beads were eluted with SDS sample buffer, and analyzed by SDS-PAGE and Western blot.
Double fluorescence immunostaining
K562 cells were fixed with 4% paraformaldehyde for 30 min, washed in PBS, then incubated in 0.3% Triton X-100, washed with PBS, and blocked in 1% BSA for 30 min, followed by incubation of LSD1 antibody at 4°C overnight and incubation of GATA2 antibody for 3 hours at 37°C. After PBS washed, the cells were incubated in secondary antibodies (anti-mouse IgG conjugated with cy3 and anti-Rabbit IgG conjugated with FITC), in PBS, and mounted with 6-diamidino-2-phenylindole (DAPI) to visualize the nucleus. Fluorescence photography was captured with a confocal microscope (Olympus).
siRNA knockdown
Small interfering RNA (siRNA) and nonspecific control siRNA were synthesized (Dharmacon), and transfected into K562 cells with Lipofectamine RNAiMAX (Life Technologies) following the manufacture’s instruction. The knockdown efficiencies were confirmed by Western blot or qPCR. The targeting sequences of siRNA were listed in Table 1.
Table 1.
The targeting sequences of siRNAs
| siRNAs | Sequences |
|---|---|
| siLSD1-1 | CUAUAAAGCUCCAAUACUG |
| siLSD1-2 | GGCUCUUCUAGCAAUACUA |
| siLSD1-3 | UCAAUGUCCUCAAUAAUAA |
| siLSD1-4 | GCAAGGAAUAUGAUGAAUU |
| siGATA2-1 | CUGAUGAGUUAAUUGUUUU |
| siGATA2-2 | GCAUGAAGAUGGAAAGUGG |
| siGATA2-3 | CCUGCAUGGACAGUUGUUU |
| siGATA2-4 | UCUUAUUCCUUUAAAGUGA |
Statistical analysis
Data were presented as mean ± SD. Statistical analysis was conducted using Student’s t test or one-way ANOVA with Graph Pad Prism 5 software. A probability value with P<0.05 was considered statistically significant.
Results
GATA2 associates with LSD1 complex
To investigate the potential interaction between GATA2 and LSD1 in hematopoietic cell lines, we performed co-immunoprecipitation in K562 nuclear extract with GATA2 and LSD1 antibodies respectively. The data demonstrated that GATA2 associated with LSD1 in K562 cells. Furthermore, GATA2 also associated with several other components of LSD1 complex, including CoREST, HDAC1 and HDAC2 (Figure 1A and 1B). Consistently, we found that LSD1 was co-localized with endogenous GATA2 in the nucleus (Figure 1C). Next, we sought to characterize which domain of LSD1 was involved in the interaction with GATA2. LSD1 and its truncated forms were expressed as GST fusion proteins (GST-LSD1) (Figure 1D). Wild-type and truncated GST-LSD1 were incubated with K562 nuclear extracts. GATA2 interacts with the truncated form of LSD1 that contains the SWIRM domain, while neither N-terminal nor C-terminal amine oxidase domain of LSD1 interacts with GATA2 (Figures 1E, 2). Together, these results demonstrated that LSD1 associates with GATA2 andt he SWIRM domain is required for the association.
Figure 1.
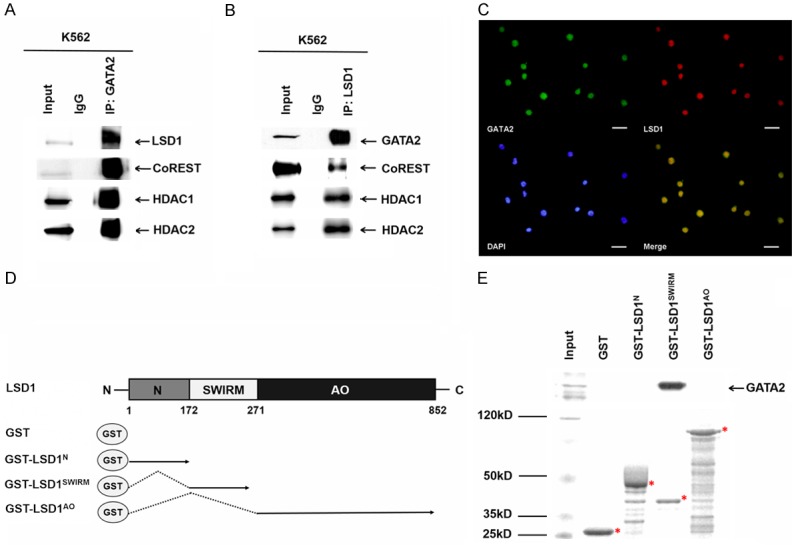
GATA2 associated with LSD1. A. K562 nuclear extract was immunoprecipitated by an anti-GATA2 antibody and subjected to western blotting analysis with anti-LSD1, anti-CoREST, anti-HDAC1, anti-HDAC2 antibody. B. K562 nuclear extract was immunoprecipitated by an anti-LSD1 antibody and subjected to western blotting analysis with with anti-LSD1, anti-CoREST, anti-HDAC1, anti-HDAC2 antibody. C. Immunofluorescence analysis showing the association of LSD1 (red) with GATA2 (green) in K562 cells. Scale bars = 20 μm. D. Schematic representations of the structure of LSD1 and the GST-LSD1 fusion proteins used in GST pull-down assays. E. GST, GST-LSD1N, GST-LSD1SWIRM and GST-LSD1AO fusion proteins were pre-adsorbed to glutathione-Sepharose beads, and incubated with K562 nuclear extracts. Proteins that were bound to LSD1 were eluted and resolved with a SDS-PAGE gel (lower panel), and subjected to western blotting analysis with an anti-LSD1 antibody (upper panel).
Figure 2.
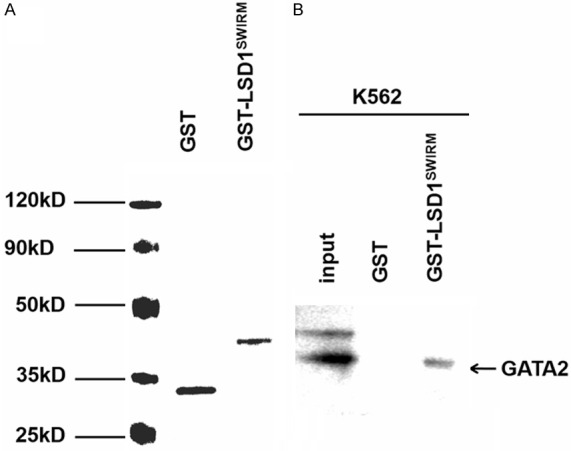
GST pull-down assay for LSD1 and GATA2. A. GST and GST-LSD1SWIRM fusion protein pre-adsorbed to glutathione-Sepharose beads. Coomassie staining of SDS-PAGE gels show the relative site of the proteins. B. Nuclear extract from K562 were incubated with LSD1 fusion proteins and precipitated with GST beads and analyzed with GATA2 antibody.
GATA2 represses GATA1 expression through LSD1-mediated H3K4 demethylation
To investigate the role of the GATA2 and LSD1 interaction in regulating GATA1 expression, we performed LSD1 and GATA2 knockdown and assessed the expression of GATA1 in undifferentiated K562 cells. KD of LSD1, GATA2, or both exhibited a significant increased expression of GATA1 (Figure 3A, 3B). There are several cis-regulatory elements in GATA1 genelocus, including double-GATA motif (dbG) and IE promoter, both of which are essential for erythroid cell-specific GATA1 expression. Double-GATA motif is a palindromic GATA-binding site located 700-bp 5’ to the IE exon, which has eight-fold higher binding affinity than a single GATA site [45-47], and GATA1 bind to IE promoter in both mouse and human erythroid cells (Figure 3C) [47,48]. To detect whether GATA2 binds to the cis-regulatory regions of the GATA1 locus, we performed Chromatin-Immunoprecipitation (ChIP) assay. ChIP results showed that GATA2 binds to both dbG and IE sites (Figure 3D). Interestingly, LSD1 also occupy at both dbG and IE sites (Figure 3E). After LSD1 knockdown, the H3K4 methylation at the dbG and IE sites increased, demonstrating that the binding of LSD1 complex caused H3K4 demethylation at these sites of GATA1 gene (Figure 3F).
Figure 3.
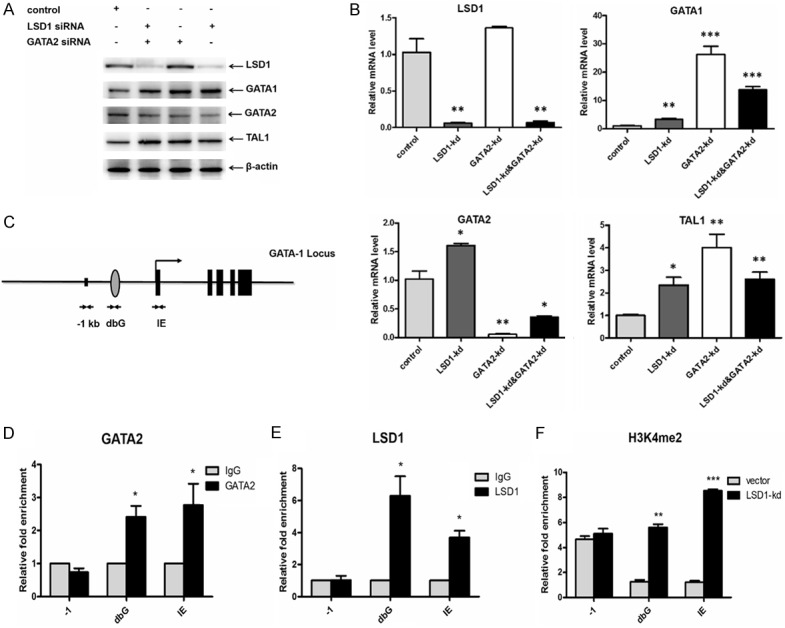
GATA2 recruits LSD1 to the GATA1 locus. A. LSD1, GATA2, GATA1, TAL1 expression in K562 cells with LSD1 KD, GATA2 KD as well as LSD1 and GATA2 double KD (KD, knock down). B. Quantitative PCR of LSD1, GATA2, GATA1, TAL1 in K562 cells with LSD1 KD, GATA2 KD as well as LSD1 and GATA2 double KD. C. A schematic map of GATA binding sites on the GATA1 locus. D. ChIP (ChIP, Chromatin-Immunoprecipitation) with anti-GATA2 antibody in K562 cells, and PCR with primers specific to the indicated sites of the GATA1 locus. E. ChIP with anti-LSD1 antibody in K562 cells, and PCR with primers specific to the indicated sites of the GATA1 locus. F. ChIP with anti-H3K4me2 antibody from control and LSD1-KD K562 cells and PCR with primers specific to the indicated sites in the Gata1 locus.
LSD1 and TAL1 gene expression are altered during erythroid differentiation
To study the function of LSD1-mediated GATA1 expression during erythroid differentiation, we investigated the expression of LSD1, TAL1, GATA1, GATA2 in induced K562 cells (Figure 4A, 4B). After induction with hemin, the K562 cell pellets became red, indicating expression of hemoglobin (Figure 4A). Indeed real-time PCR results demonstrated increased expression of β-globin in induced K562 cells (Figure 4B), suggesting an effective erythroid differentiation. The expression of GATA1 was increased, and the expression of GATA2, LSD1, CoREST, HDAC1 and HDAC2 were decreased during erythroid differentiation. Interestingly, the level of TAL1 expression was slightly increased at day 1, and decreased gradually at day 3 and 5 (Figure 4C, 4D).
Figure 4.

The expression of LSD1, TAL1, GATA1, GATA2 changes after induction of erythroid differentiation. (A) Photography of pellets of K562 cells after induction of erythroid differentiation (0 day, 1 day, 3 day, 5 day). (B) mRNA were prepared from K562 cells after induction of erythroid differentiation (0 day, 1 day, 3 day, 5 day). Transcriptional level of β-globin and β-actin were analyzed by quantitative PCR. (C) Cell lysates were prepared from K562 cells after induction of erythroid differentiation (0 day, 1 day, 3 day, 5 day), analyzed by SDS-PAGE and western blotting using GATA1-, GATA2-, LSD1-, CoREST-, HDAC1-, HDAC2-, TAL1- and β-actin specific antibodies. These results are representative of three experiments with different samples. (D) The relative expressions of GATA1, GATA2, LSD1, CoREST, HDAC1, HDAC2 and TAL1 protein from (C) were quantified (n = 3) and normalized to β-actin protein.
Interaction between GATA2 and LSD1 is decreased during erythroid differentiation
Immunoprecipitation experiments were performed with the GATA2, LSD1 and TAL1 antibodies in K562 cells during induced erythroid differentiation, and we found that the interaction between LSD1 and GATA2 was decreased at day 3 (Figure 5A, 5B). While the interaction between TAL1 and LSD1 was increased (Figure 5B), the interaction between TAL1 and GATA2 was decreased during the induced erythroid differentiation (Figure 5C). TAL1 might interact with GATA2 through LSD1 and form a super transcription complex. To prove this hypothesis, the nuclear extracts of wild-type and LSD1-KD K562 were subjected to immunoprecipitation with anti-GATA2 antibody. After knocked down of LSD1, the interaction between TAL1 and GATA2 was indeed decreased (Figure 5D).
Figure 5.
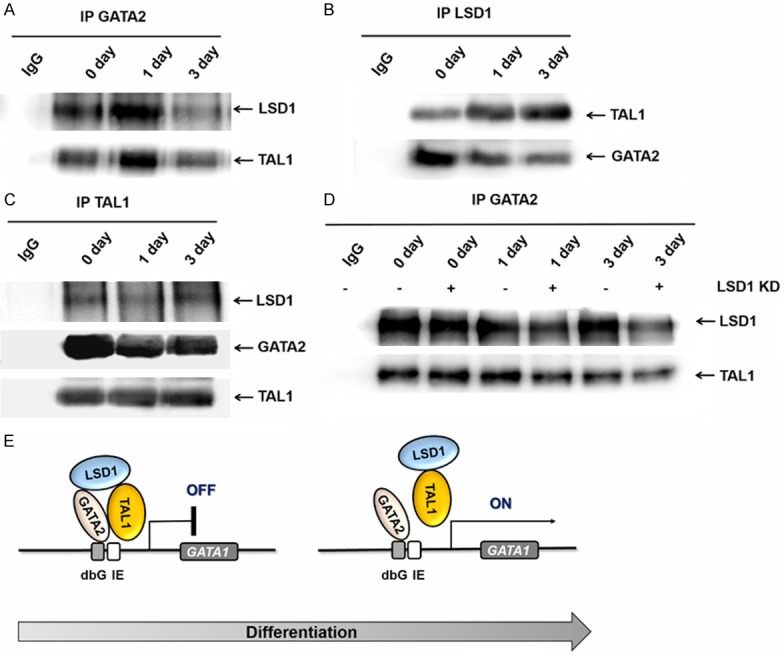
The mechanism of LSD1, TAL1, GATA2 coregulate Gata1 expression during erythroid differentiation. A. IP with the GATA2 antibody in K562 cells during differentiation, Western blots with TAL1 and LSD1. B. IP with the LSD1 antibody in K562 cells during differentiation, Western blots with GATA2, TAL1 and LSD1. C. IP with the TAL1 antibody in K562 cells during differentiation, Western blots with GATA2 and LSD1. D. Nuclear extract were prepared from K562 cells after induction of erythroid differentiation (0 day, 1 day, 3 day) and immunoprecipitated by an anti-GATA2 antibody and subjected to western blotting analysis with anti-LSD1, anti-TAL1 antibodies in wild-type and LSD1-KD cells. E. A proposed model to illustrate how LSD1 function in erythropoiesis. LSD1 is recruited to specific locus of Gata1 by GATA2 at early stage of erythropoiesis, which results in downregulation of the active histone marker H3K4me2 and promoter activity. During the initiation of erythropoiesis, LSD1 leaves GATA1 with TAL1, which allows GATA2 starts to activate GATA1 expression.
Discussion
In this study, we report a novel interaction between LSD1 and GATA2 that mediates repression of GATA1 expression. GATA2 recruits LSD1 to GATA binding sites of Gata1 gene and repress GATA1 expression through H3K4 demethylation in undifferentiated cells. Upon induced erythroid differentiation, LSD1 is released from GATA2, and therefore leads to the de-repression of GATA1 (Figure 5D).
It has been shown that GATA2 can bind to the promoter region of GATA1 and repress GATA1 expression in the hematopoietic stem and progenitor cells. Genome-wide researches have reported that GATA1 and TAL1 extensively co-occupy genomic sites in the erythroid cells. Some other studies also demonstrated the interaction between TAL1 and LSD1 or LSD1 and GATA1 [42,43]. However, the molecular mechanism underlying GATA2-mediated GATA1 expression was not clear explored till now. Our work clearly demonstrates that GATA2 can bind to the dbG and 1E sites in undifferentiated K562 cells. Furthermore, GATA2 recruits LSD1 to these sites and causes H3K4 demethylation. Our results show that GATA2 regulates GATA1 expression through an epigenetic mechanism.
Although the LSD1 molecule silences genes by acting as the histone deethylase protein, interestingly, the LSD1 is also a component of the histone deacetylase complexs [29,35,37]. The previous studies reported that the histone modification triggered by the LSD1 signaling pathway plays a critical role in a series of diseases, including colon cancer [49], bladder cancer [50] and the other cancers [51]. We speculated that the LSD1 would act as a promising therapeutic target for some of the diseases. Therefore, we investigated the function of GATA3 in this study by exploring the LSD1 histone modification.
In this study, the association between GATA2 and LSD1 is decreased after the induced differentiation of K562 cells. Such decreased association might be caused by the decreased expression of GATA2. However, we notice that the association between TAL1 and LSD1 is increased in the differentiated K562 cells, suggesting that TAL1 might be involved in this dissociation as well. Moreover, the pathology of GATA2 has also implicated in the lung cancer [52]. The targeting processes that occur downstream of GATA2 signaling with clinically approved drugs had a very important effect in some of the disease models [52]. Therefore, we speculated that the GATA2 may be a significant therapeutic target for some of the cancers and other diseases. However, the previous studies have not been discovered the effective and available compounds targeting the GATA2. Fortunately, our study discovered for the first time that the functions of GATA2 was completed through the LSD1 pathway, which would provide the promising method for anti-tumor therapy.
In conclusion, our findings reveal an elegant mechanism to modulate GATA1 and GATA2 expression during erythroid differentiation. While LSD1 mainly forms complex with GATA2 to repress GATA1 expression in hematopoietic progenitor cells, it mostly forms complex with TAL1 to repress GATA2 expression in differentiated cells.
Acknowledgements
We are grateful to Dr. Suming Huang for his suggestions and critical reading of this manuscript. This work was supported by grants obtained from the Natural Science Foundation of China (Grant No. 31100926, 31471356) and China Postdoctoral Science Foundation (Grant No. 20100481059, 2012T50290).
Disclosure of conflict of interest
None.
References
- 1.Ko LJ, Engel JD. DNA-binding specificities of the GATA transcription factor family. Mol Cell Biol. 1993;13:4011–4022. doi: 10.1128/mcb.13.7.4011. [DOI] [PMC free article] [PubMed] [Google Scholar]
- 2.Yamamoto M, Takahashi S, Onodera K, Muraosa Y, Engel JD. Upstream and downstream of erythroid transcription factor GATA-1. Genes Cells. 1997;2:107–115. doi: 10.1046/j.1365-2443.1997.1080305.x. [DOI] [PubMed] [Google Scholar]
- 3.Ferreira R, Ohneda K, Yamamoto M, Philipsen S. GATA1 function, a paradigm for transcription factors in hematopoiesis. Mol Cell Biol. 2005;25:1215–1227. doi: 10.1128/MCB.25.4.1215-1227.2005. [DOI] [PMC free article] [PubMed] [Google Scholar]
- 4.Moriguchi T, Yamamoto M. A regulatory network governing Gata1 and Gata2 gene transcription orchestrate erythroid lineage differentiation. Int J Hematol. 2014;100:417–424. doi: 10.1007/s12185-014-1568-0. [DOI] [PubMed] [Google Scholar]
- 5.Tsai FY, Keller G, Kuo FC, Weiss M, Chen J, Rosenblatt M. An early haematopoietic defect in mice lacking the transcription factor GATA-2. Nature. 1994;371:221–226. doi: 10.1038/371221a0. [DOI] [PubMed] [Google Scholar]
- 6.Tsai FY, Orkin SH. Transcription factor GATA-2 is required for proliferation/survival of early hematopoietic cells and mast cell formation, but not for erythroid and myeloid terminal differentiation. Blood. 1997;89:3636–3643. [PubMed] [Google Scholar]
- 7.Minegishi N, Suzuki N, Yokomizo T, Pan X, Fujimoto T, Takahashi S. Expression and domain-specific function of GATA-2 during differentiation of the hematopoietic precursor cells in midgestation mouse embryos. Blood. 2003;102:896–895. doi: 10.1182/blood-2002-12-3809. [DOI] [PubMed] [Google Scholar]
- 8.Ohneda K, Yamamoto M. Roles of hematopoietic transcription factors GATA-1 and GATA-2 in the development of red blood cell lineage. Acta Haematol. 2002;108:237–345. doi: 10.1159/000065660. [DOI] [PubMed] [Google Scholar]
- 9.Kaneko H, Shimizu R, Yamamoto M. GATA factor switching during erythroid differentiation. Curr Opin Hematol. 2010;17:163–168. doi: 10.1097/MOH.0b013e32833800b8. [DOI] [PubMed] [Google Scholar]
- 10.Suzuki M, Shimizu R, Yamamoto M. Transcriptional regulation by GATA1 and GATA2 during erythropoiesis. Int J Hematol. 2011;93:150–155. doi: 10.1007/s12185-011-0770-6. [DOI] [PubMed] [Google Scholar]
- 11.Onodera K, Takahashi S, Nishimura S, Ohta J, Motohashi H, Yomogida K, Hayashi N, Engel JD, Yamamoto M. GATA-1 transcription is controlled by distinct regulatory mechanisms during primitive and definitive erythropoiesis. Proc Natl Acad Sci U S A. 1997;94:4487–4492. doi: 10.1073/pnas.94.9.4487. [DOI] [PMC free article] [PubMed] [Google Scholar]
- 12.Tsai SF, Strauss E, Orkin SH. Functional analysis and in vivo footprinting implicate the erythroid transcription factor GATA-1 as a positive regulator of its own promoter. Genes Dev. 1991;5:919–931. doi: 10.1101/gad.5.6.919. [DOI] [PubMed] [Google Scholar]
- 13.Nishimura S, Takahashi S, Kuroha T, Suwabe N, Nagasawa T, Trainor C, Yamamoto M. A GATA box in the GATA-1 gene hematopoietic enhancer is a critical element in the network of GATA factors and sites that regulate this gene. Mol Cell Biol. 2000;20:713–723. doi: 10.1128/mcb.20.2.713-723.2000. [DOI] [PMC free article] [PubMed] [Google Scholar]
- 14.Ohneda K, Shimizu R, Nishimura S, Muraosa Y, Takahashi S, Engel JD. A minigene containing four discrete cis-elements recapitulates GATA-1 gene expression in vivo. Genes Cells. 2002;7:1243–1254. doi: 10.1046/j.1365-2443.2002.00595.x. [DOI] [PubMed] [Google Scholar]
- 15.Shimizu R, Hasegawa A, Ottolenghi S, Ronchi A, Yamamoto M. Verification of the in vivo activity of three distinct cis-acting elements within the Gata1 gene promoter-proximal enhancer in mice. Genes Cells. 2013;18:1032–1041. doi: 10.1111/gtc.12096. [DOI] [PubMed] [Google Scholar]
- 16.Takai J, Moriguchi T, Suzuki M, Yu L, Ohneda K, Yamamoto M. The Gata1 50 region harbors distinct cis-regulatory modules that direct gene activation in erythroid cells and gene inactivation in HSCs. Blood. 2013;122:3450–3460. doi: 10.1182/blood-2013-01-476911. [DOI] [PubMed] [Google Scholar]
- 17.Berger SL. The complex language of chromatin regulation during transcription. Nature. 2007;447:407–412. doi: 10.1038/nature05915. [DOI] [PubMed] [Google Scholar]
- 18.Bhaumik SR, Smith E, Shilatifard A. Covalent modifications of histones during development and disease pathogenesis. Nat Struct Mol Biol. 2007;14:1008–1016. doi: 10.1038/nsmb1337. [DOI] [PubMed] [Google Scholar]
- 19.Ruthenburg AJ, Li H, Patel DJ, Allis CD. Multivalent engagement of chromatin modifications by linked binding modules. Nat Rev Mol Cell Biol. 2007;8:983–994. doi: 10.1038/nrm2298. [DOI] [PMC free article] [PubMed] [Google Scholar]
- 20.Jenuwein T, Allis CD. Translating the histone code. Science. 2001;293:1074–1080. doi: 10.1126/science.1063127. [DOI] [PubMed] [Google Scholar]
- 21.Kouzarides T. Chromatin modifications and their function. Cell. 2007;128:693–705. doi: 10.1016/j.cell.2007.02.005. [DOI] [PubMed] [Google Scholar]
- 22.Dawson MA, Kouzarides T. Cancer epigenetics: from mechanism to therapy. Cell. 2012;150:12–27. doi: 10.1016/j.cell.2012.06.013. [DOI] [PubMed] [Google Scholar]
- 23.Klose RJ, Zhang Y. Regulation of histone methylation by demethylimination and demethylation. Nat Rev Mol Cell Biol. 2007;8:307–318. doi: 10.1038/nrm2143. [DOI] [PubMed] [Google Scholar]
- 24.Shi Y, Whetstine JR. Dynamic regulation of histone lysine methylation by demethylases. Mol Cell. 2007;25:1–14. doi: 10.1016/j.molcel.2006.12.010. [DOI] [PubMed] [Google Scholar]
- 25.Cloos PA, Christensen J, Agger K, Helin K. Erasing the methyl mark: histone demethylases at the center of cellular differentiation and disease. Genes Dev. 2008;22:1115–1140. doi: 10.1101/gad.1652908. [DOI] [PMC free article] [PubMed] [Google Scholar]
- 26.Greer EL, Shi Y. Histone methylation: a dynamic mark in health, disease and inheritance. Nat Rev Genet. 2012;13:343–357. doi: 10.1038/nrg3173. [DOI] [PMC free article] [PubMed] [Google Scholar]
- 27.Forneris F, Binda C, Battaglioli E, Mattevi A. LSD1: oxidative chemistry for multifaceted functions in chromatin regulation. Trends Biochem Sci. 2008;33:181–189. doi: 10.1016/j.tibs.2008.01.003. [DOI] [PubMed] [Google Scholar]
- 28.Black JC, Van Rechem C, Whetstine JR. Histone lysine methylation dynamics: establishment, regulation, and biological impact. Mol Cell. 2012;48:491–507. doi: 10.1016/j.molcel.2012.11.006. [DOI] [PMC free article] [PubMed] [Google Scholar]
- 29.Shi Y, Lan F, Matson C, Mulligan P, Whetstine JR. Histone demethylation mediated by the nuclear amine oxidase homolog LSD1. Cell. 2004;119:941–953. doi: 10.1016/j.cell.2004.12.012. [DOI] [PubMed] [Google Scholar]
- 30.Ciccone DN, Su H, Hevi S, Gay F, Lei H. KDM1B is a histone H3K4 demethylase required to establish maternal genomic imprints. Nature. 2009;461:415–418. doi: 10.1038/nature08315. [DOI] [PubMed] [Google Scholar]
- 31.Fang R, Barbera AJ, Xu Y, Rutenberg M, Leonor T. Human LSD2/KDM1b/AOF1 regulates gene transcription by modulating intragenic H3K4me2 methylation. Mol Cell. 2010;39:222–233. doi: 10.1016/j.molcel.2010.07.008. [DOI] [PMC free article] [PubMed] [Google Scholar]
- 32.Chen Y, Yang Y, Wang F, Wan K, Yamane K. Crystal structure of human histone lysine-specific demethylase 1 (LSD1) Proc Natl Acad Sci U S A. 2006;103:13956–13961. doi: 10.1073/pnas.0606381103. [DOI] [PMC free article] [PubMed] [Google Scholar]
- 33.Tochio N, Umehara T, Koshiba S, Inoue M, Yabuki T. Solution structure of the SWIRM domain of human histone demethylase LSD1. Structure. 2006;14:457–468. doi: 10.1016/j.str.2005.12.004. [DOI] [PubMed] [Google Scholar]
- 34.Stavropoulos P, Blobel G, Hoelz A. Crystal structure and mechanism of human lysine-specific demethylase-1. Nat Struct Mol Biol. 2006;13:626–632. doi: 10.1038/nsmb1113. [DOI] [PubMed] [Google Scholar]
- 35.Lan F, Nottke AC, Shi Y. Mechanisms involved in the regulation of histone lysine demethylases. Curr Opin Cell Biol. 2008;20:316–325. doi: 10.1016/j.ceb.2008.03.004. [DOI] [PMC free article] [PubMed] [Google Scholar]
- 36.Whyte WA, Bilodeau S, Orlando DA, Hoke HA, Frampton GM. Enhancer decommissioning by LSD1 during embryonic stem cell differentiation. Nature. 2012;482:221–225. doi: 10.1038/nature10805. [DOI] [PMC free article] [PubMed] [Google Scholar]
- 37.Adamo A, Sese B, Boue S, Castano J, Paramonov I, Barrero MJ. LSD1 regulates the balance between self-renewal and differentiation in human embryonic stem cells. Nat Cell Biol. 2011;13:652–659. doi: 10.1038/ncb2246. [DOI] [PubMed] [Google Scholar]
- 38.Sprüssel A, Schulte JH, Weber S, Necke M, Händschke K. Lysine-specific demethylase 1 restricts hematopoietic progenitor proliferation and is essential for terminal differentiation. Leukemia. 2012;26:2039–2051. doi: 10.1038/leu.2012.157. [DOI] [PubMed] [Google Scholar]
- 39.Whyte WA, Bilodeau S, Orlando DA, Hoke HA, Frampton GM. Enhancer decommissioning by LSD1 during embryonic stem cell differentiation. Nature. 2012;482:221–225. doi: 10.1038/nature10805. [DOI] [PMC free article] [PubMed] [Google Scholar]
- 40.Kerenyi MA, Shao Z, Hsu YJ, Guo G, Luc S, O’Brien K, Fujiwara Y, Peng C, Nguyen M, Orkin SH. Histone demethylase Lsd1 represses hematopoietic stem and progenitor cell signatures during blood cell maturation. Elife. 2013;2:e00633. doi: 10.7554/eLife.00633. [DOI] [PMC free article] [PubMed] [Google Scholar]
- 41.Amente S, Lania L, Majello B. The histone LSD1 demethylase in stemness and cancer transcription programs. Biochim Biophys Acta. 2013;1829:981–986. doi: 10.1016/j.bbagrm.2013.05.002. [DOI] [PubMed] [Google Scholar]
- 42.Hu X, Li X, Valverde K, Fu X, Noguchi C, Qiu Y, Huang S. LSD1-mediated epigenetic modification is required for TAL1 function and hematopoiesis. Proc Natl Acad Sci U S A. 2009;106:10141–10146. doi: 10.1073/pnas.0900437106. [DOI] [PMC free article] [PubMed] [Google Scholar]
- 43.Li Y, Deng C, Hu X, Patel B, Fu X, Qiu Y, Brand M, Zhao K, Huang S. Dynamic interaction between TAL1 oncoprotein and LSD1 regulates TAL1 function in hematopoiesis and leukemogenesis. Oncogene. 2012;31:5007–5018. doi: 10.1038/onc.2012.8. [DOI] [PMC free article] [PubMed] [Google Scholar]
- 44.Guo Y, Fu X, Jin Y, Sun J, Liu Y, Huo B, Li X, Hu X. Histone demethylase LSD1-mediated repression of GATA-2 is critical for erythroid differentiation. Drug Des Devel Ther. 2015;9:3153–3162. doi: 10.2147/DDDT.S81911. [DOI] [PMC free article] [PubMed] [Google Scholar]
- 45.Trainor CD, Omichinski JG, Vandergon TL, Gronenborn AM, Clore GM, Felsenfeld G. A palindromic regulatory site within vertebrate GATA-1 promoters requires both zinc fingers of the GATA-1 DNA-binding domain for high-affinity interaction. Mol Cell Biol. 1996;16:2238–2247. doi: 10.1128/mcb.16.5.2238. [DOI] [PMC free article] [PubMed] [Google Scholar]
- 46.Trainor CD, Ghirlando R, Simpson MA. GATA zinc finger interactions modulate DNA binding and transactivation. J Biol Chem. 2000;275:28157–28166. doi: 10.1074/jbc.M000020200. [DOI] [PubMed] [Google Scholar]
- 47.Valverde-Garduno V, Guyot B, Anguita E, Hamlett I, Porcher C, Vyas P. Differences in the chromatin structure and cis-element organization of the human and mouse GATA1 loci: implications for cis-element identification. Blood. 2004;104:3106–3116. doi: 10.1182/blood-2004-04-1333. [DOI] [PubMed] [Google Scholar]
- 48.Lin T, Ponn A, Hu X, Law BK, Lu J. Requirement of the histone demethylase LSD1 in Snai1-mediated transcriptional repression during epithelial-mesenchymal transition. Oncogene. 2010;29:4896–4904. doi: 10.1038/onc.2010.234. [DOI] [PMC free article] [PubMed] [Google Scholar]
- 49.Ding J, Zhang ZM, Xia Y, Liao GQ, Pan Y, Liu S, Zhang Y, Yan ZS. LSD1-mediated epigenetic modification contributes to proliferation and metastasis of colon cancer. Br J Cancer. 2013;109:994–1003. doi: 10.1038/bjc.2013.364. [DOI] [PMC free article] [PubMed] [Google Scholar]
- 50.Lan W, Zhang D, Jiang J. The roles in LSD1-mediated epigenetic modifications in maintaining the pluripotency of bladder cancer stem cells. Med Hypotheses. 2013;81:823–825. doi: 10.1016/j.mehy.2013.09.005. [DOI] [PubMed] [Google Scholar]
- 51.Amente S, Lania L, Majello B. The histone LSD1 demethylase in stemness and cancer transcription programs. Biocheim Biophys Acta. 2013;1829:981–986. doi: 10.1016/j.bbagrm.2013.05.002. [DOI] [PubMed] [Google Scholar]
- 52.Kumar M, Hancock D, Molina-Arcas M, Steckel M, East P, Diefenbacher M. The GATA-2 transcriptional network is requisite for RAS oncogene-driven non-small cell lung cancer. Cell. 2012;149:642–655. doi: 10.1016/j.cell.2012.02.059. [DOI] [PubMed] [Google Scholar]