Abstract
The Magadi tilapia, Alcolapia grahami, a small cichlid fish of Lake Magadi, Kenya lives in one of the most challenging aquatic environments on earth, characterized by very high alkalinity, unusual water chemistry, and extreme O2, ROS, and temperature regimes. In contrast to most fishes which live at temperatures substantially lower than the 36–40 °C of mammals and birds, an isolated population (South West Hot Springs, SWHS) of Magadi tilapia thrives in fast-flowing hotsprings with daytime highs of 43 °C and night-time lows of 32 °C. Another population (Fish Springs Lagoon, FSL) lives in a lagoon with fairly stable daily temperatures (33–36 °C). The upper critical temperatures (Ctmax) of both populations are very high; moreover the SWHS tilapia exhibit the highest Ctmax (45.6 °C) ever recorded for a fish. Routine rates of O2 consumption (MO2) measured on site, together with MO2 and swimming performance at 25, 32, and 39 °C in the laboratory, showed that the SWHS tilapia exhibited the greatest metabolic performance ever recorded in a fish. These rates were in the basal range of a small mammal of comparable size, and were all far higher than in the FSL fish. The SWHS tilapia represents a bellwether organism for global warming.
The Magadi tilapia, Alcolapia grahami, thrives in one of the most extreme environments on earth, characterized by high pH (up to 10.0), extreme alkalinity (>300 mmol L−1), high temperature (>40 °C), high levels of reactive O2 species (>8 μmol L−1), unusual water chemistry with salinity close to 60% seawater, and large daily fluctuations in O2 levels (severe hypoxia to hyperoxia)1,2,3,4. Two isolated populations were first described by Coe1, one living in fast-flowing hot springs (South West Hot Springs, SWHS), the other in a cooler man-made lagoon (Fish Springs Lagoon, FSL) where the water is virtually static, contained by a retaining wall built by a local industry. Physical barriers between the sites are severe1, but the amount of gene flow between the two populations remains controversial5,6,7.
Virtually all previous physiological research has been performed on the FSL fish due to their ease of capture and proximity to the town of Magadi. It is clear that they have very unusual physiology2,3,4,8–12. Perhaps the most notable physiological adaptation is 100% ureotelism; this is the only known teleost fish which excretes entirely urea and no ammonia8. Furthermore, routine metabolic rate is high10,12,13, and about 50% of it appears to be spent on acid-base regulation11. However, the two populations exhibit clear morphological differences, with the SWHS fish appearing more streamlined and having a much higher mass-specific gill area than the FSL fish14. Little else is known about the SWHS fish, apart from the facts that they are also ureotelic5 and have very high mitochondrial respiration rates15.
In the present study, we further characterized the two habitats, and compared the temperature tolerance and metabolic performance of the two populations. Based on the very high daily temperature and more energetically-challenging environment of the SWHS fish, and the limited physiological and anatomical knowledge summarized above, we hypothesized that both temperature tolerance and metabolic performance of the former would be exceptional. Indeed the current data show that both upper critical temperature and aerobic metabolic capacity of the SWHS tilapia surpass those of any other teleost fish.
Results and Discussion
Habitat Characteristics
We characterized the diurnal temperature, dissolved O2, and pH profiles at the two sites (FSL, Aug. 1; SWHS, Aug. 5, 2013) in the coolest month of the year, taking care to place the probe in locations where the fish were present at mid-day. At the SWHS site where the very shallow (<12 cm), fast-flowing water is under direct sunlight, temperature varied dramatically over the day from 43 °C at 14:00 to 32 °C during the night (Fig. 1). Additionally, we routinely observed fish moving through thermal spring plumes at 43.7–44.2 °C, though not staying there. Fish were never observed in a 44.8 °C plume. Dissolved O2 varied from super-saturation during daylight hours to hypoxia during the night and anoxia at dawn, whereas water pH was stable at ~9.40. At FSL, where the current is negligible and the water is deeper (~1 m) but again under direct sunlight, conditions were much more constant with diurnal temperature variations of 33–36 °C, dissolved O2 variations of 30–80% saturation, and stable pH ~ 9.75 (Fig. 2). Other aspects of water chemistry were also very different at the two sites, with much higher ions, osmolality, total CO2, and titratable alkalinity at SWHS (Table 1), yet lower pH, in accord with a previous report5. Far more avian predators were also seen at SWHS.
Figure 1. Continuous 24-h record of (A) water temperature, (B) pH, and (C) dissolved O2 (% saturation) at the SWHS site on Aug. 5, 2013.
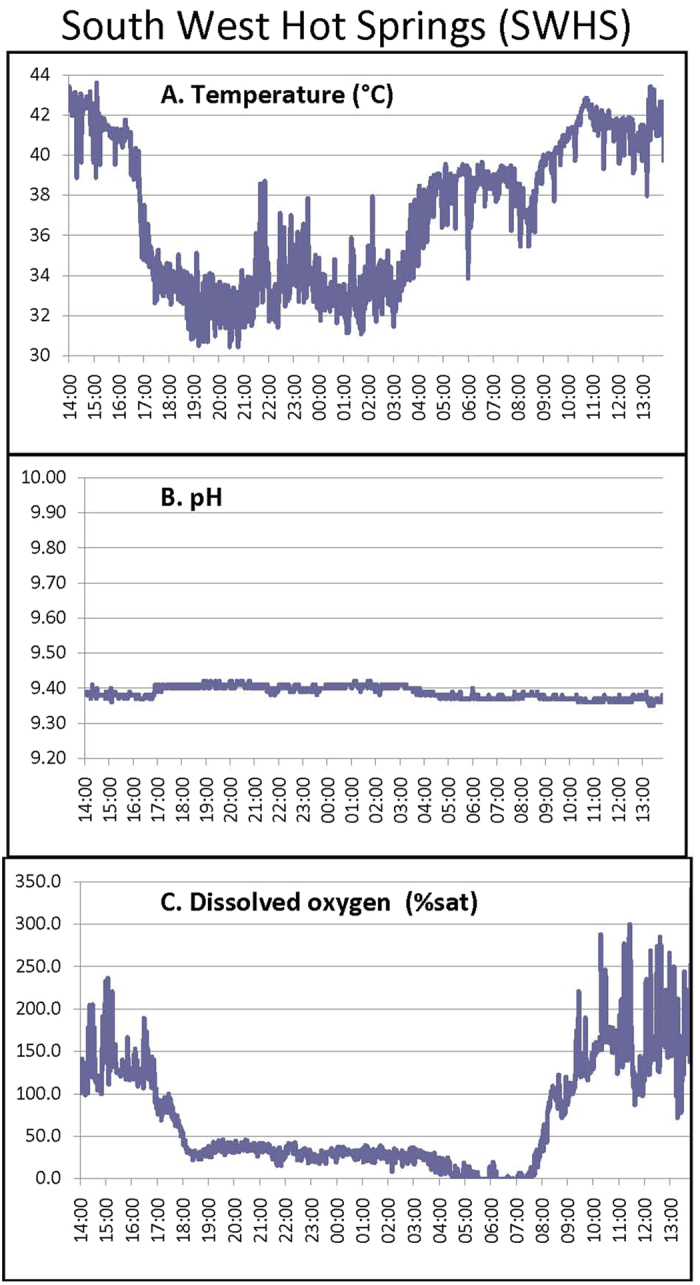
Figure 2. Continuous 24-h record of (A) water temperature, (B) pH, and (C) dissolved O2 (% saturation) at the FSL site on Aug. 1, 2013.
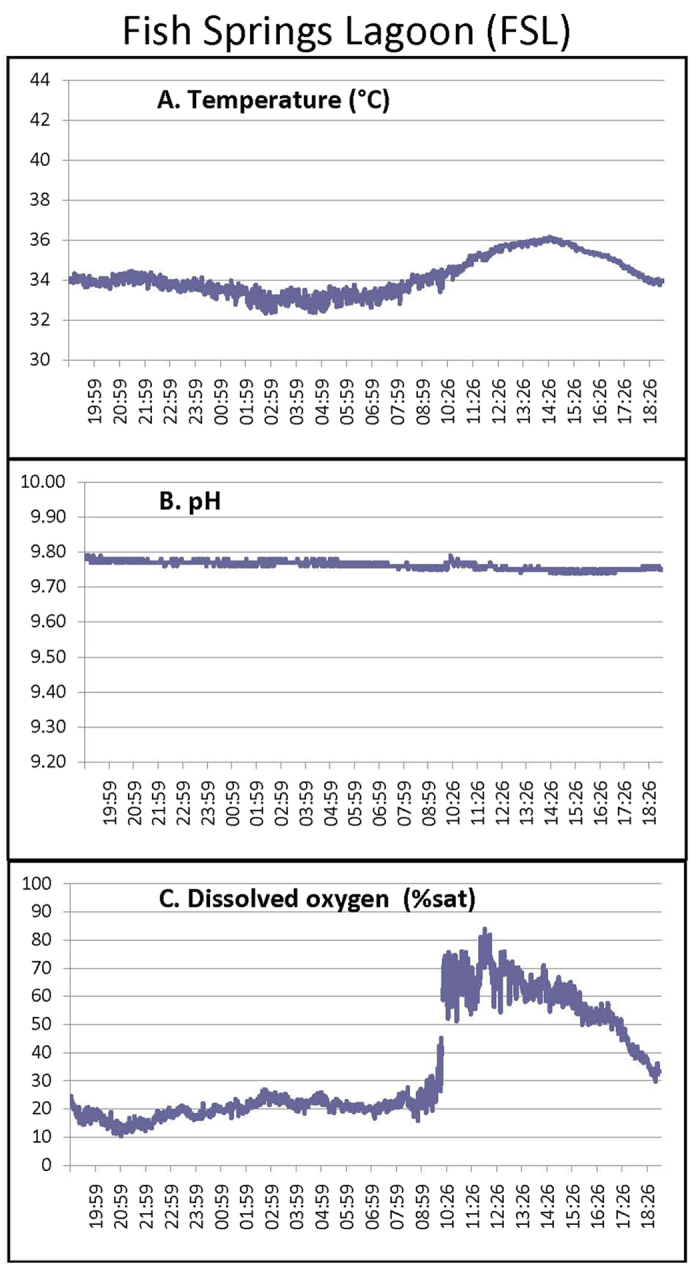
Table 1. Measured water chemistry at Fish Springs Lagoon (FSL) and South West Hot Springs (SWHS) in August 2013.
| FSL | SWHS | |
|---|---|---|
| pH | ~9.75 | ~9.40 |
| Titratable Alkinity (to pH 4.0, mmol L−1) | 230 | 378 |
| Total CO2 (mmol L−1) | 165 | 282 |
| Na+ (mmol L−1) | 392 | 674 |
| Cl− (mmol L−1) | 125 | 190 |
| K+ (mmol L−1) | 2.7 | 4.3 |
| Ca2+ (mmol L−1) | 0.10 | 0.05 |
| Mg2+ (mmol L−1) | 0.002 | 0.001 |
| Osmolality (mosm kg−1) | 513 | 880 |
Critical Temperatures
Field Ctmax, measured at lakeside using a standardized protocol16 in SWHS fish freshly caught from water at 40–41 °C, was 45.6 ± 0.1 °C (N = 8), the highest ever recorded for a fish (Table 2). FSL fish were also very temperature tolerant: the comparable field Ctmax for FSL fish caught from 33 °C water was 43.6 ± 0.1 °C (N = 8). In both cases, field Ctmin values were approximately 30 °C lower than Ctmax. After transportation to the laboratory and holding at 33 °C in their respective waters for 4 days, Ctmax had dropped by 1.9 °C, and Ctmin by 3.2 °C in SWHS fish, whereas these values were essentially unchanged in FSL fish.
Table 2. Maximum (Ctmax ) and minimum (Ctmin) critical temperatures for loss of equilibrium in Magadi tilapia collected from South West Hot Springs (SWHS) or Fish Springs Lagoon (FSL).
| Ctmax (°C) | Ctmin (°C) | |
|---|---|---|
| SWHS Magadi tilapia fielda | 45.6 ± 0.1 | 17.6 ± 0.4 |
| SWHS Magadi tilapia labb | 43.7 ± 0.4 | 14.4 ± 0.1 |
| FSL Magadi tilapia fielda | 43.6 ± 0.5 | 13.2 ± 0.3 |
| FSL Magadi tilapia labb | 44.5 ± 0.0 | 12.4 ± 0.3 |
| Sheepshead minnow labc | 45.1 ± 0.1 | |
| Sheepshead minnow labd | 44.2 ± 0.1 | 11.3 ± 0.2 |
| Yucatan pupfish labe | 45.3 ± 0.1 | |
| Common killifish labf | 42.5 ± 0.2 | 9.6 ± 0.2 |
Values are means ± 1SEM for all fish, with N = 8 for Magadi tilapia. Comparisons are made to other fish species which previously held the record for the world’s most high temperature tolerant fish.
aAlcolapia grahami Measurements made shortly after capture from 40–41 °C water for SWHS fish and from 33 °C water for FSL fish.
bAlcolapia grahami Measurements made after the fish were held for 4 days at 33 °C in their respective waters in the laboratory.
cCyprinodon variegatus variegatus Measurements made in the laboratory after fish were held for 30 days with a daily 5 °C thermoperiod ranging from 37–42 °C27.
dCyprinodon variegatus variegatus Measurements made in the laboratory after fish were held for 30 days at 38 °C27.
eCyprinodon artifrons Measurements made in the laboratory after fish were held for 8 days with a daily 15 °C thermoperiod ranging from 26–41 °C28.
fFundulus heteroclitus Measurements were made in the laboratory after fish were held for 21 days at 34 °C29.
Routine Metabolism
Routine MO2, measured in the laboratory at 25 °C, 32 °C, and 39 °C using Tusker chamber respirometers10, was significantly higher by 1.4–2.3 fold in the SWHS fish at all three temperatures (25 °C, 32 °C, and 39 °C) (Fig. 3A). Routine MUrea-N, measured simultaneously, was higher only at 25 °C and 32 °C (Fig. 3B). These laboratory MO2 and MUrea-N values for FSL tilapia were in the same general range as for previous reports on “resting” FSL fish at comparable temperatures10,11,12. The much higher MO2 values for SWHS fish were approximately double those predicted by meta-relationships with temperature for fish in general17. Routine metabolism increased to a greater extent with temperature (2 comparisons across 3 temperatures) in FSL fish [MO2 Q10 = 2.78 (2), MUrea-N Q10 = 4.94 (2)] than in SWHS fish [MO2 Q10 = 2.46 (2), MUrea-N Q10 = 2.97 (2)].
Figure 3. The influence of temperature on (A) routine MO2 and (B) routine MUrea-N in the laboratory in Magadi tilapia from SWHS and FSL.
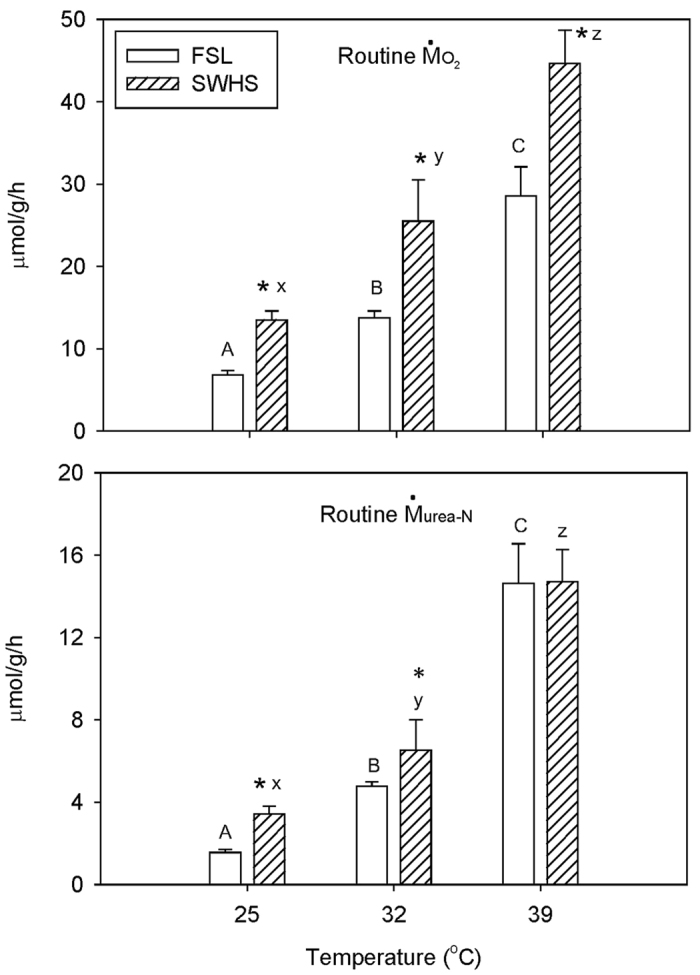
Means ± 1 SEM (N = 5–7). For (A) routine MO2 the overall effects of both population and temperature (2-way ANOVA) are significant (P < 0.05); interaction effects are not significant. For (B) routine MUrea-N, the overall effects of both population and temperature (2-way ANOVA) are significant (P < 0.05); interaction effects are not quite significant (P = 0.052). Rates for FSL fish sharing the same letters are not significantly different (P > 0.05). Rates for SWHS fish sharing the same letters are not significantly different (P > 0.05). Asterisks indicate significant differences (P < 0.05) between FSL and SWHS fish at the same temperature.
Routine MO2 was also measured in the field on freshly caught fish using Tusker chambers immersed in the lake, to hold ambient temperature. Routine field MO2 in SWHS fish was 87.7 ± 12.0 (15) μmol g−1 h−1 at a water temperature of 41 °C. These routine rates for SWHS fish in the field are truly exceptional; a similarly sized small mammal, the 6-g adult pygmy mouse (Baiomys taylori), has an identical routine metabolic rate (87.1 ± 9.8 μmol g−1 h−1) at an air temperature of 30–33 °C (thermoneutral zone)18. Routine MO2 in FSL fish in the field was 4-fold lower, 22.2 ± 1.5 (10) μmol g−1 h−1 at 33 °C. Routine MUrea-N in the field scaled in proportion: 21.5 ± 3.3 (15) μmol g−1 h−1 at 41 °C in SWHS fish versus 5.8 ± 0.6 (10) μmol g−1 h−1 at 33 °C in FSL fish.
Swimming Performance and Metabolism
Critical swimming speed19 (Ucrit, 7.5–9.5 body lengths sec−1) in Blazka-style swim tunnels20 was high and independent of temperature (25, 32, 39 °C) in the SWHS fish, but significantly lower at both 25 °C and 39 °C in FSL fish, collapsing to only about 2 body lengths sec−1 at 39 °C (Fig. 4). In both populations MO2 increased approximately linearly with swimming speed, but the rates associated with any swimming speed at any temperature were higher (by 1.1–2.5-fold) in the SWHS fish (Fig. 5). In contrast to MO2, MUrea-N did not increase with swimming speed in either population, though again rates were generally higher in SWHS fish (Supplementary Fig. S1). The lack of increase in MUrea-N with increased aerobic metabolic rate during swimming was seen previously in FSL tilapia after exhaustive exercise9; possible explanations include either a switch away from amino-acid based fuels and/or inhibition of urea synthesis to reduce costs during exercise.
Figure 4. The influence of temperature on critical swimming speed (Ucrit) in Magadi tilapia from SWHS and FSL.
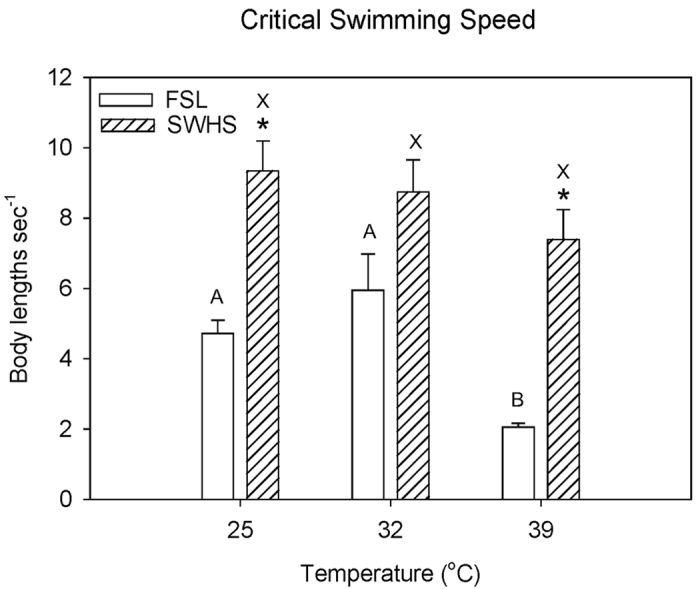
Means ± 1 SEM (N = 5–7). The overall effects of both population and temperature (2-way ANOVA) are significant (P < 0.05); interaction effects are not significant. Values for FSL fish sharing the same letters are not significantly different (P > 0.05). Values for SWHS fish sharing the same letters are not significantly different (P > 0.05). Asterisks indicate significant differences (P < 0.05) between FSL and SWHS fish at the same water temperature.
Figure 5. The influence of temperature on MO2 during swimming at increasing speeds in Magadi tilapia from (A) SWHS and (B) FSL. Means ± 1 SEM (N = 5–7).
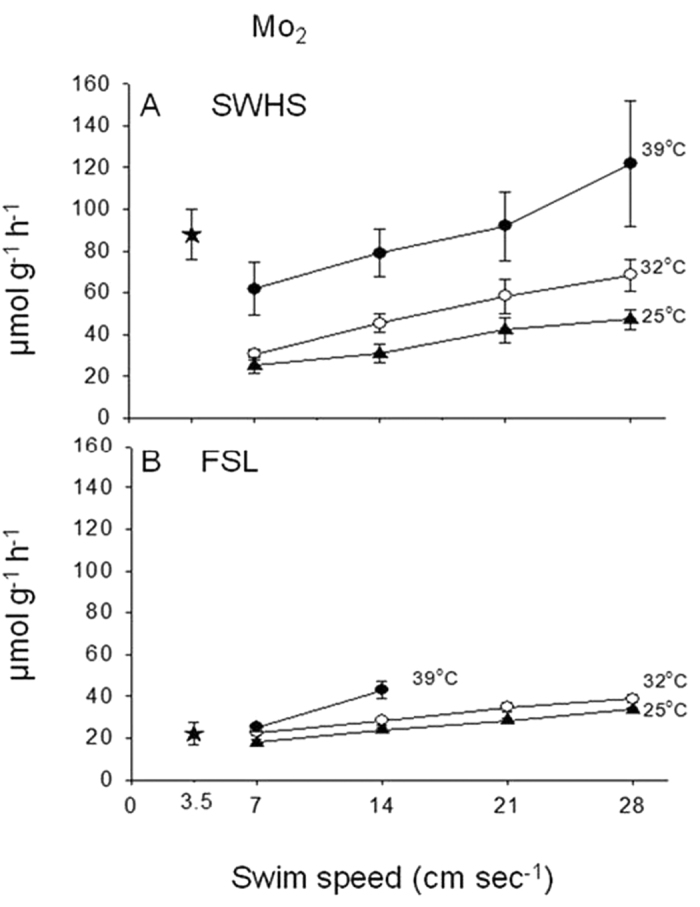
The overall effects of population, temperature, and swimming speed (3-way ANOVA) are all significant (P < 0.05); interaction effects are not significant. Also shown (as stars) are the routine MO2 values measured in the field for freshly caught fish (SWHS, N = 15, at 41 °C; FSL, N = 10, at 33 °C).
Anecdotally, we noticed in both populations, that if an air bubble was provided in the swimming respirometer after exhaustion, the fish would continuously breathe air for up to 40 min, presumably to help satisfy the demands of excess post-exercise O2 consumption.
Q10 values for MO2 during swimming, calculated for individual speeds, averaged 2.00 ± 0.26 (8 comparisons across 3 temperatures) in SWHS fish indicating a continuing ability to increase metabolism with temperature in the face of exercise, whereas in FSL fish the mean Q10 value during swimming was only 1.35 ± 0.07 (6 comparisons across 3 temperatures), indicating limited capacity. Mean Q10 values for MUrea-N during swimming were 2.15 ± 0.53 (8) for SWHS and only 1.30 ± 0.21 (6) for FSL, indicating similar limitation. Notably these Q10 patterns contrasted with those for routine metabolism reported above which increased more quickly with temperature in FSL fish than in SWHS fish.
Values for MO2(min) (calculated rate of O2 consumption at zero activity), MO2(max) (calculated rate of O2 consumption at maximum sustainable swimming activity) and aerobic scope (the difference between these two values) (Fig. 6) illustrate the dramatic differences between the two populations, and the exceptional capacity of the SWHS fish. MO2(min), MO2(max), and aerobic scope values for FSL tilapia did not differ across temperatures (25, 32, 39 °C); factorial aerobic scope was approximately 3. The relatively high measured routine MO2 at 39 °C (Fig. 3B) consumed much of the aerobic scope of the FSL fish, explaining their poor swimming performance at this temperature. In contrast MO2(max), and aerobic scope steadily increased with temperature in SWHS fish (Fig. 6), while routine MO2 (Fig. 3B) remained close to MO2(min), accounting for only a small fraction of the aerobic scope at all temperatures. Interestingly, MO2(min) only differed from the FSL values at 39 °C, but MO2(max), and aerobic scope were significantly greater at all three temperatures. Factorial aerobic scope in SWHS tilapia was about 6 at 25 °C and 32 °C, falling to 4 at 39 °C.
Figure 6. The effect of temperature on calculated MO2(min), MO2(max), and aerobic scope in Magadi tilapia from SWHS and FSL.
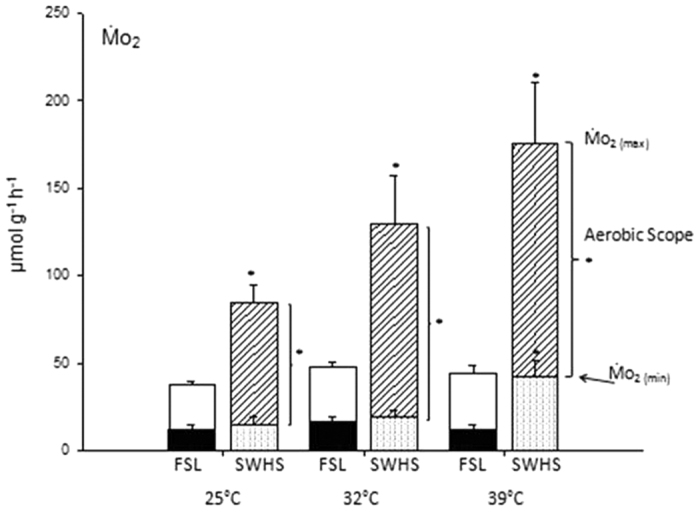
Means ± 1 SEM (N = 5–7). The overall effects of population (2-way ANOVA) are significant (P < 0.05) for all three parameters, whereas those of temperature are significant only for MO2(max), but there are significant interaction effects for MO2(min) and aerobic scope. Asterisks indicate significant differences (P < 0.05) between FSL and SWHS fish at the same temperature.
MO2(max) at 39 °C in SWHS tilapia was 175.4 ± 34.6 (6) μmol g−1 h−1. It is impressive that this fish can sustain an MO2(max) equal to about one-third of the MO2(max) (507 μmol g−1 h−1) of the pygmy mouse18,21. We believe that these rates for SWHS tilapia are indicative of the greatest metabolic performance ever recorded in a fish of comparable size. The obvious comparison is with tunas, but there appear to be no published data for 3-g tunas, and they are not endothermic at this size. It is also doubtful whether even adult tuna ever reach body temperatures of 39 °C. The smallest tuna studied appears to be a 24-g kawaka (Euthynnus affinis) which exhibited an MO2(max) of about 94 μmol g−1 h−1 at a Ucrit of about 4 body lengths sec−1 at 24° 22; application of a standard teleost allometric scaling coefficient17 would raise this to 145 μmol g−1 h−1 for a theoretical 3-g tuna. The previous record for highest MO2(max) in a teleost appears to be 164 μmol g−1 h−1 in 0.019-g larvae of the damselfish Chromis atripectoralis swimming at a Ucrit >30 body lengths sec−1 at 30 °C23; this would scale to only 57 μmol g−1 h−1 for a theoretical 3-g larva.
Perspectives
At least in part, this exceptional metabolic performance is explained by the very high area, thin diffusion distance, and high morphometric diffusing capacity for O2 (DO2) in the gills of Alcolapia grahami; DO2 is twice as high in the SWHS fish as in the FSL fish, and is second only to that in tuna on a mass-specific basis14. Mitochondrial respiration rates are also considerably higher than in other fish, but only to the extent expected because of the higher temperature15. Other key parts of the O2 delivery system (cardiac output, blood O2 characteristics, tissue vascularization) have yet to be examined. The metabolic differences observed could be phenotypic, genotypic or both. At present, it is unclear whether the FSL and SWHS populations are genetically distinct5,6,7. With respect to the current debate about the O2-and capacity-limited thermal tolerance (OCLTT) hypothesis24,25, the pattern of aerobic metabolism in FSL fish (Fig. 6) does not fit the idealized OCLTT model. Nevertheless, encroachment of routine MO2 on aerobic scope coupled with declining performance at the highest temperature (39 °C) is in accord with the theory. The pattern for SWHS fish may or may not fit the model because aerobic scope continued to increase to 39 °C (Fig. 6); experiments closer to lethal temperatures (Table 2) will be required to see if aerobic scope eventually declines as Ctmax is approached. The SWHS tilapia lives in a fluctuating thermal environment which comes within 3 °C of this Ctmax on a daily basis (Fig. 1, Table 2), and is clearly at the mercy of ambient air temperatures. Already classified by IUCN26 as “threatened (vulnerable)”, it will be a bellwether organism for studying the impacts of climate change. All these are exciting areas for future investigation on this unique teleost athlete.
Methods and Materials
Fish Capture and Habitat Characterization
Research was performed under a research and ethics clearance permit (NCST/RR1/12/1/MAS/99) from the National Council for Science and Technology (NCST Kenya), and with the permission of the Magadi Soda Foundation. Experiments were carried out in accordance with the approved guidelines of NCST Kenya and experimental protocols were approved by the Animal Use and Ethics Committee of the Faculty of Veterinary Medicine, University of Nairobi. All foreign researchers were licensed by NCST and formally appointed as visiting researchers at the University of Nairobi. Collections were made under permission from the Dept. of Fisheries, Ministry of Fisheries (Kenya). All surviving fish were returned to their original collection sites.
Adult Magadi tilapia, Alcolapia grahami (2.97 ± 0.14 g, 6.41 ± 0.12 cm fork length) were collected by beach seine from two sites at the edge of Lake Magadi, Kenya, in July and August, 2013: Fish Spring Lagoons (FSL) (GPS coordinates = 1°53′30.2″S, 36°18′09.9″E) and South West Hot Springs (SWHS) (2°00′04.0″S, 6°13′55.2″E). Water chemistry at the two sites (Table 1) was determined by previously described methods5. The daily cycle of water temperature, pH, and dissolved O2 was continuously recorded for 24 h at the two sites (FSL, Aug. 1; SWHS, Aug. 5, 2013) using a multi-parameter meter and probe system (HI 9828, Hanna Instruments, Woonsocket, RI, USA). Fish were studied either shortly after capture at lakeside or after transport by vehicle (FSL = 15 min; SWHS = 90 min), together with water from the two sites, to a field laboratory set up in a classroom of Magadi Secondary School.
Measurements of Critical Temperatures
Upper (Ctmax) and lower (Ctmin) critical temperatures were determined by a standardized protocol16 in which temperature was either increased or decreased at a linear rate of 0.3 °C min−1 and loss of equilibrium was the endpoint. Temperature was monitored continuously by a Symphony SP70P probe and meter (VWR, Radner, PA, USA) referenced to a precision thermometer serial 210620, traceable to NIST standards (H-B Instrument, Trappe, PA, USA). Ct measurements were made either on freshly collected fish or on fish which had been held for 4 days at 33 °C in their source water in the laboratory, and were designated as “field” or “lab” respectively. During the 4-day holding, the fish were fed to satiation daily with US Sera Goldy Colour Spirulina (Sera North America Inc., Montgomeryville, PA, USA). Water was changed daily.
Respirometry
After capture, fish for respirometry experiments were held overnight without feeding in their appropriate water at 33 °C in the laboratory. Gut clearance occurred during this time. Experiments commenced the next morning, and were always performed using water from the appropriate source. In these trials, O2 was measured using a portable WTW Oxi325 Oximeter (Weilheim, Germany); urea-N determinations and calculations of O2 consumption (MO2) and urea-nitrogen excretion (MUrea-N) rates were performed as described previously10,11. This species is capable of supplementary air-breathing via a physostomous swimbladder4,12,13, but access to air was not provided in any of the respirometry experiments. Temperature coefficients (Q10 values)17 for MO2 and MUrea-N were calculated based on group means. Fish weights and body lengths (nose to fork of caudal fin) were measured after completion of respirometry experiments.
Routine rates of MO2 and MUrea-N were measured in amber 500-ml bottles (“Tusker chambers”)10 fitted with aeration devices. In the laboratory, fish were allowed to settle for 1 h in the chambers at the chosen test temperature (25, 32, or 39 °C), then a water sample was taken for urea-N analysis. A final sample was taken after 0.3–3 h, depending on temperature. The respirometer was sealed in the middle of the flux period for a sufficient time to allow depletion of O2 to no less than 60% saturation, and then aeration was resumed. Blanks without fish were run simultaneously. In the field, a similar procedure was used to measure routine rates, but freshly collected fish were employed, and the respirometers were incubated directly in the lake so as to maintain ambient temperature, which was 33 °C in FSL and 41 °C in SWHS at the time of these measurements.
Swimming respirometry was performed using the 3.2-L Blazka-style swim tunnels described by Wilson et al.20 which were calibrated using an Onicon flowmeter, model F-1100 (Clearwater, Florida, USA). The four respirometers were submerged, in pairs, in two temperature-controlled baths (200-L) filled with the appropriate water. In each run, three were used for fish swimming, and the fourth as a blank at the same velocities. Each was fitted with an aeration device. Fish were allowed to settle for 1 h at about 3 cm sec−1, and then the respirometer was flushed (0.25 h), and the first test velocity was set to 7 cm sec−1 for a 1-h swimming period. The respirometer was then flushed again (0.25 h), during which time the velocity was increased to 14 cm sec−1, with subsequent parallel 1-h swimming periods at 21 and 28 cm sec−1, each followed by 0.25-h flushes. Thereafter, further progressive speed increments of 7 cm sec−1 were applied for 0.5-h swimming periods until the fish exhausted. These 7 cm sec−1 increments represented about 1.1 body lengths sec−1 (typical fish length = 6.0–6.7 cm). Exhaustion was defined as failure of the fish to leave the rear screen and start swimming again, after the velocity had been briefly stopped and restarted three times. The exact time of the failure was recorded and used in the calculation of critical swimming speed (Ucrit) by the method of Brett19. Only the first four 1-h periods were used for respirometry, as this duration was necessary for accurate determination of MUrea-N. In the middle of each period, aeration was suspended and the respirometer was sealed for MO2 determination, using a duration in which O2 depletion occurred to no less than 60% saturation. The subsequent periods were used only to assess swimming performance. This protocol was adopted to fit into a 9-h period (daylight hours only) in light of security concerns (bandits) when travelling to and from our laboratory.
Data Analysis
For each fish, MO2 was plotted against swimming speed. As with other high performance fish swimming at high temperature22, the relationships were better described by linear rather than exponential relationships for most fish (33 out of 37), so linear regression was used throughout to predict MO2(min) at 0 body lengths sec−1 and MO2(max) at Ucrit, with the difference representing aerobic scope. Data have been expressed as means ± 1 SEM (N). Data were transformed as required to achieve normal distribution and homogeneity of variance prior to analysis by three-way ANOVA (population x temperature x swimming speed) or two-way ANOVA (population x temperature) as appropriate, followed by the Holm-Sidak post hoc test (P < 0.05) to identify individual differences.
Additional Information
How to cite this article: Wood, C. M. et al. Mammalian metabolic rates in the hottest fish on earth. Sci. Rep. 6, 26990; doi: 10.1038/srep26990 (2016).
Supplementary Material
Acknowledgments
We thank Tata Chemicals Magadi (John Ndonga, Lemarron Kaanto, John Kabera), the Magadi Soda Foundation, the Magadi Secondary School (Rosemary Ndavuta), drivers George and Dishon Muthee, numerous unnamed Kenyan guides and guards, Linda Diao, Sunita Nadella, and Victor Ong’era for technical assistance, and Drs. Richard Brill, Kathryn Dickson, and Sigal Balshine for advice. Supported by grants from the Natural Sciences and Engineering Research Council of Canada (NSERC, Discovery Program) to CMW, the National Research Foundation of South Africa to JNM, and by the Brazilian National Council for Scientific and Technological Development (CNPq) to AB. CMW was supported by the Canada Research Chairs Program. AB is a CNPq Research Fellow, and is supported by the International Research Chair Program from the International Development Research Centre (Canada).
Footnotes
Author Contributions The study was conceived by C.M.W., H.L.B. and K.V.B. Experiments were performed by C.M.W., K.V.B., G.D.B., J.N.M. and O.E.J., with preliminary trials by H.L.B., and field work by A.B., L.F.B., G.D.K., M.B.P., and K.M.L. R.O.O. provided overall organization and logistics. The article was written by C.M.W. with input from all authors.
References
- Coe M. J. The biology of Tilapia grahami Boulenger in Lake Magadi, Kenya. Acta Trop. 23, 146–177 (1966). [Google Scholar]
- Johansen K., Maloiy G. M. O. & Lykkeboe G. A fish in extreme alkalinity. Resp. Physiol. 24, 156–162 (1975). [DOI] [PubMed] [Google Scholar]
- Pörtner H. O., Schulte P. M., Wood C. M. & Schiemer F. Niche dimensions in fishes: An integrative view. Illustrating the role of physiology in understanding ecological realities. Physiol. Biochem. Zool. 83, 808–826 (2010). [DOI] [PubMed] [Google Scholar]
- Johannsson O. E. et al. Air breathing in the Lake Magadi tilapia Alcolapia grahami, under normoxic and hyperoxic conditions, and the association with sunlight and ROS. J. Fish Biol. 84, 844–863 (2014). [DOI] [PubMed] [Google Scholar]
- Wilson P. J. et al. Discordance between genetic structure and morphological, ecological, and physiological adaptation in Lake Magadi tilapia. Physiol. Biochem. Zool. 77, 537–555 (2004). [DOI] [PubMed] [Google Scholar]
- Kavembe G. D., Machado-Schiaffino G. & Meyer A. Pronounced genetic differentiation of small, isolated, and fragmented tilapia populations inhabiting the Magadi Soda Lake in Kenya. Hydrobiologia 739, 55–71 (2014). [Google Scholar]
- Ford A. G. et al. High levels of interspecific gene flow in an endemic cichlid fish: adaptive radiation from an extreme lake environment. Mol. Ecol. 24, 3421–3440 (2015). [DOI] [PMC free article] [PubMed] [Google Scholar]
- Randall D. J. et al. Urea excretion as a strategy for survival in a fish living in a very alkaline environment. Nature 337, 165–166 (1989). [DOI] [PubMed] [Google Scholar]
- Wood C. M., Perry S. F., Wright P. A., Bergman H. L. & Randall D. J. Ammonia and urea dynamics in the Lake Magadi tilapia, a ureotelic teleost fish adapted to an extremely alkaline environment. Resp. Physiol. 77, 1–20 (1989). [DOI] [PubMed] [Google Scholar]
- Wood C. M. et al. Urea production, acid-base regulation and their interactions in the Lake Magadi tilapia, a unique teleost adapted to a highly alkaline environment. J. Exp. Biol. 189, 13–36 (1994). [DOI] [PubMed] [Google Scholar]
- Wood C. M. et al. Obligatory urea production and the cost of living in the Magadi tilapia revealed by acclimation to reduced salinity and alkalinity. Physiol. Biochem. Zool. 75, 111–122 (2002). [DOI] [PubMed] [Google Scholar]
- Narahara A. et al. Respiratory physiology of the Lake Magadi tilapia (Oreochromis alcalicus grahami), a fish adapted to a hot, alkaline, and frequently hypoxic environment. Physiol. Zool. 69, 1114–1136 (1996). [Google Scholar]
- Franklin C. E., Crockford T., Johnston I. A. & Kamunde C. Scaling of oxygen consumption in Lake Magadi tilapia, Oreochromis alcalicus grahami: a fish living at 37 °C. J. Fish. Biol. 46, 829–834 (1995). [Google Scholar]
- Maina J. N. et al. A comparative allometric study of the morphometry of the gills of an alkalinity adapted cichilid fish, Oreochromis alcalicus grahami. Int. J. Salt Lake Res. 5, 131–156 (1996). [Google Scholar]
- Johnston I. A., Guderley H., Franklin C. E., Crockford T. & Kamunde C. Are mitochondria subject to evolutionary temperature adaptation? J. Exp. Biol. 195, 293–306 (1994). [DOI] [PubMed] [Google Scholar]
- Becker C. D. & Genoway R. G. Evaluation of the critical thermal maximum for determining thermal tolerance of freshwater fish. Environ. Biol. Fish. 4, 245–256 (1979). [Google Scholar]
- Clarke A. & Johnston N. M. Scaling of metabolic rate with body mass and temperature in teleost fish. J. Anim. Ecol. 68, 893–905 (1999). [Google Scholar]
- Hudson J. W. Temperature regulation and torpidity in the pygmy mouse, Baiomys taylori. Physiol. Zool. 38, 243–254 (1965). [Google Scholar]
- Brett J. R. The respiratory metabolism and swimming performance of young sockeye salmon. J. Fish. Res. Bd. Can. 21, 1183–1226 (1964). [Google Scholar]
- Wilson R. W., Bergman H. L. & Wood C. M. Metabolic costs and physiological consequences of acclimation to aluminum in juvenile rainbow trout (Oncorhynchus mykiss). 2: Gill morphology, swimming performance, and aerobic scope. Can. J. Fish. Aquat. Sci. 51, 536–544 (1994). [Google Scholar]
- Rosenmann M. & Morrison P. Maximum oxygen consumption and heat loss facilitation in small homeotherms by He-O2. Am. J. Physiol. 226, 490–495 (1974). [DOI] [PubMed] [Google Scholar]
- Sepulveda C. & Dickson K. A. Maximum sustainable speeds and cost of swimming in juvenile kawakawa tuna (Euthynnus affinis) and chub mackerel (Scomber japonicus). J. Exp. Biol. 203, 3089–3101 (2000). [DOI] [PubMed] [Google Scholar]
- Nilsson G. E., Östlund-Nilsson S., Penfold R. & Grutter A. S. From record performance to hypoxia tolerance: respiratory transition in damselfish larvae settling on a coral reef. P Roy. Soc. B.–Biol. Sci. 274, 79–85 (2007). [DOI] [PMC free article] [PubMed] [Google Scholar]
- Pörtner H. O. Oxygen-and capacity-limitation of thermal tolerance: a matrix for integrating climate-related stressor effects in marine ecosystems. J. Exp. Biol. 213, 881–893 (2010). [DOI] [PubMed] [Google Scholar]
- Clark T. D., Sandblom E. & Jutfelt F. Aerobic scope measurements of fishes in an era of climate change: respirometry, relevance and recommendations. J. Exp. Biol. 216, 2771–2782 (2013). [DOI] [PubMed] [Google Scholar]
- Bayona J. & Akinyi E. Alcolapia grahami. The IUCN Red List of Threatened Species (2006): Available at: http://dx.doi.org/10.2305/IUCN.UK.2006.RLTS.T60453A12368415.en. (Accessed 8th March 2016).
- Bennett W. A. & Beitinger T. L. Temperature tolerance of the sheepshead minnow, Cyprinodon variegatus. Copeia 1997, 77–87 (1977). [Google Scholar]
- Heath A. G., Turner B. J. & Davis W. P. Temperature preferences and tolerances of three fish species inhabiting hyperthermal ponds on mangrove islands. Hydrobiologia 259, 47–55 (1993). [Google Scholar]
- Fangue N. A., Hofmeister M. & Schulte P. M. Intraspecific variation in thermal tolerance and heat shock protein gene expression in common killifish, Fundulus heteroclitus. J. Exp. Biol. 209, 2859–2872 (2006). [DOI] [PubMed] [Google Scholar]
Associated Data
This section collects any data citations, data availability statements, or supplementary materials included in this article.


