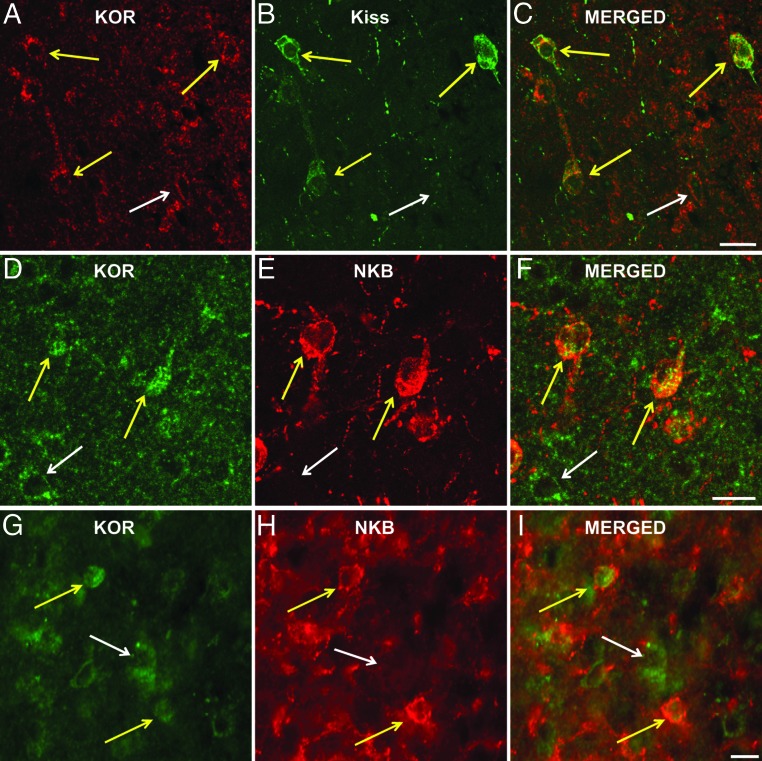
Figure 5.
Representative images showing KOR colocalization in KNDy cells. Upper panels (A–C) are confocal images of 1-μm-thick optical sections showing KOR-ir (red) and kisspeptin-ir (green) cells in the ARC. Middle and lower panels are confocal (D–F) and light microscopic fluorescent (G–I) images of KOR-ir (green) and NKB-ir (red) in the ARC. Cells colocalizing KOR and either kisspeptin or NKB are denoted by yellow arrows. Single-labeled KOR cells are denoted by white arrows. Scale bars, 50 μm. Kiss, kisspeptin.

