Abstract
Purpose
To investigate differences in joint space width (JSW) and meniscal extrusion (ME) between non-weight bearing (NWB) and weight bearing (WB) examinations of knee joints with medial compartment osteoarthritis (OA) using a cone-beam CT (CBCT) extremity imaging system.
Materials and methods
In this IRB approved prospective study, informed consent was obtained for 17 patients symptomatic for OA (11 F,6 M; 31–78 years, mean 56 years) and 18 asymptomatic controls (0 F,18 M; 29–48 years, mean 38.5 years) enrolled for CBCT exams in NWB and WB positions. Three independent observers measured medial tibiofemoral JSW and ME. Measurements were compared between NWB and WB images using paired Wilcoxon signed-rank sum test.
Results
OA subjects exhibited a statistically significant reduction in JSW between NWB and WB scans (average and , p = 0.016) and increase in ME (average and , p = 0.018)). For non-OA subjects, the change in JSW and ME between NWB and WB exams was reduced (average and ; average and ) and was not statistically significant. Inter-observer agreement was evaluated using Bland–Altman limits of agreement, with good agreement for all measurements (correlation coeffficient 0.89–0.98).
Conclusion
The ability to conduct NWB and WB exams in CBCT with a dose profile that is favorable in comparison to multidetector CT (MDCT) and with image quality sufficient for morphological analysis of joint space narrowing and meniscal extrusion could provide a valuable tool for OA diagnosis and treatment assessment.
Keywords: Cone-beam CT, Extremity imaging, Osteoarthritis, Weight bearing imaging, Functional imaging
1. Introduction
Osteoarthritis (OA) of the knee is the most common chronic joint disease, with a rising prevalence of about 15% [1]. Currently, weight bearing plain radiography is the most common imaging modality to monitor the severity and progression of knee OA by demonstrating the narrowing of joint space width (JSW). Accurate and reproducible JSW evaluation using plain radiography requires careful positioning of both the X-ray system and the patient [2] and does not provide information on soft tissue structures or 3D orientation of osseous structures. Multidetector computed tomography (MDCT) and magnetic resonance imaging (MRI) provide detailed assessment of cartilage disease and other structural damage in patients with knee OA, such as meniscal or ligamentous injuries [3], which can contribute to joint space narrowing and progression of disease. For example, in addition to cartilage damage, the presence of meniscal extrusion (ME) can contribute to narrowing of knee JSW [4,5] and is a strong predictor of further cartilage loss in patients with knee OA [6].
Cone-beam computed tomography (CBCT) uses a large-area detector (>1000 detector rows covering ~30 × 30 cm2) and a pyramid-shaped X-ray beam to acquire a volumetric image in a single rotation. A CBCT system for extremity imaging has been recently developed [7] and translated to a clinical prototype with the ability to acquire both weight bearing (WB) and non-weight bearing (NWB) exams of the lower extremities. Feasibility of CBCT scanning in either configuration was recently confirmed [8], and initial results demonstrated reduced radiation exposure, soft tissue image quality sufficient for visualization of ligaments, cartilage, and menisci, and bone visualization meeting or exceeding the performance of high-resolution MDCT [9,10]. Other work also demonstrates the ability to acquire images of the lower extremities in a physiologic WB setup, which may improve diagnosis and management of certain pathologies in WB joints, like the ankle and the knee [11].
The purpose of the current study was to test the hypothesis that there is a significant difference in measurements of JSW and ME between NWB and WB examinations of the knee joints with known medial compartment OA using a dedicated CBCT extremity system.
2. Methods
2.1. Patient population
Institutional review board approval was obtained for this prospective study. Informed consent was obtained from 17 symptomatic patients (11 females, 6 males; age range: 31–78 years, mean age: 56 years) with diagnosis of OA in their medial tibiofemoral compartment, independent of the CBCT studies reported below, as per the clinical symptoms and findings in plain radiographs. The severity of OA was classified in plain radiographs using a previously described grading classification system [3] based on (a) joint space narrowing, (b) subchondral sclerosis, (c) osteophyte formation, and (d) subchondral cysts. Informed consent was also obtained from 18 asymptomatic control subjects (0 females, 18 males; age range: 29–48 years, mean age: 38.5 years) who had no history of OA of their knee joint. These control subjects were imaged for pathologies other than OA, such as, knee pain and muscle strain. None of the controls had any evidence of OA in the scans or their respective medical histories. The lack of asymptomatic female subjects is acknowledged as a potential limitation and unintended selection bias in the study, although the effect on the findings is believed to be minor. All images were acquired using the nominal knee scan protocol identified in previous work and technical assessment. The case and control populations were not age and gender matched, and there was statistically significant difference between cases and controls in age (p < 0.001) and gender (p < 0.001).
2.2. CBCT acquisition protocol
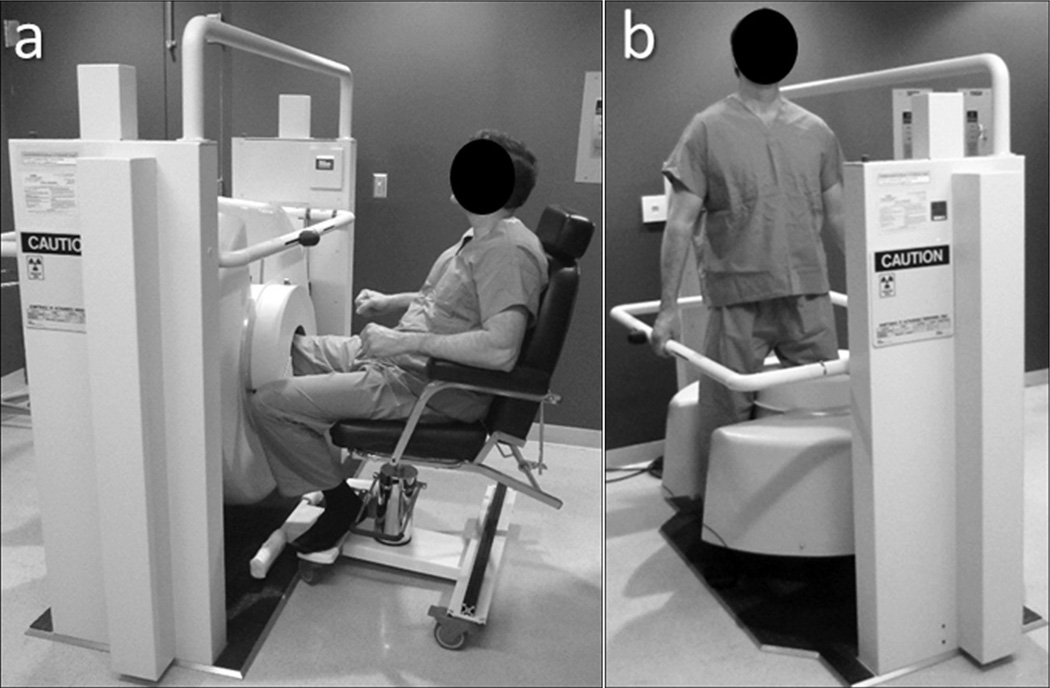
All participants (n = 35) underwent two scans of their knee joint: one NWB (sitting position with the imaged knee placed in extension within the CBCT gantry) and the other WB (normal standing pose) as shown in Fig. 1. For the WB position, the scan was performed with the participant standing with feet approximately at shoulder width and distributing their weight evenly between both legs. The nominal scan protocol was based on previous technical assessment [9,10], using a technique of 80 kVp and 108 mAs for all scans. For this scan protocol, the radiation dose was ~9 mGy, measured using a Farmer ionization chamber at the center of a stack of three 16 cm diameter computed tomography dose index (CTDI) phantoms [12]. Conversion factors for size-specific dose estimates (SSDE) [13] was 0.8 for a large knee (20 cm diameter); giving SSDE of ~9.0 mGy (16 cm diameter) and 7.2 mGy (20 cm diameter), for a medium and large knee, respectively. Each CBCT scan was reconstructed as two 3D volume images using 3D filtered back projection: (a) Bone reconstruction (0.26 mm isotropic voxels and a sharp (ramp) reconstruction filter) and (b) Soft-tissue reconstruction (0.52 mm isotropic voxels and a smooth (Hann) reconstruction filter).
Fig. 1.
Photograph showing a volunteer in (a) sitting (non-weight bearing, NWB) and (b) standing (weight bearing, WB) positions for knee scans on the CBCT scanner.
2.3. Image interpretation
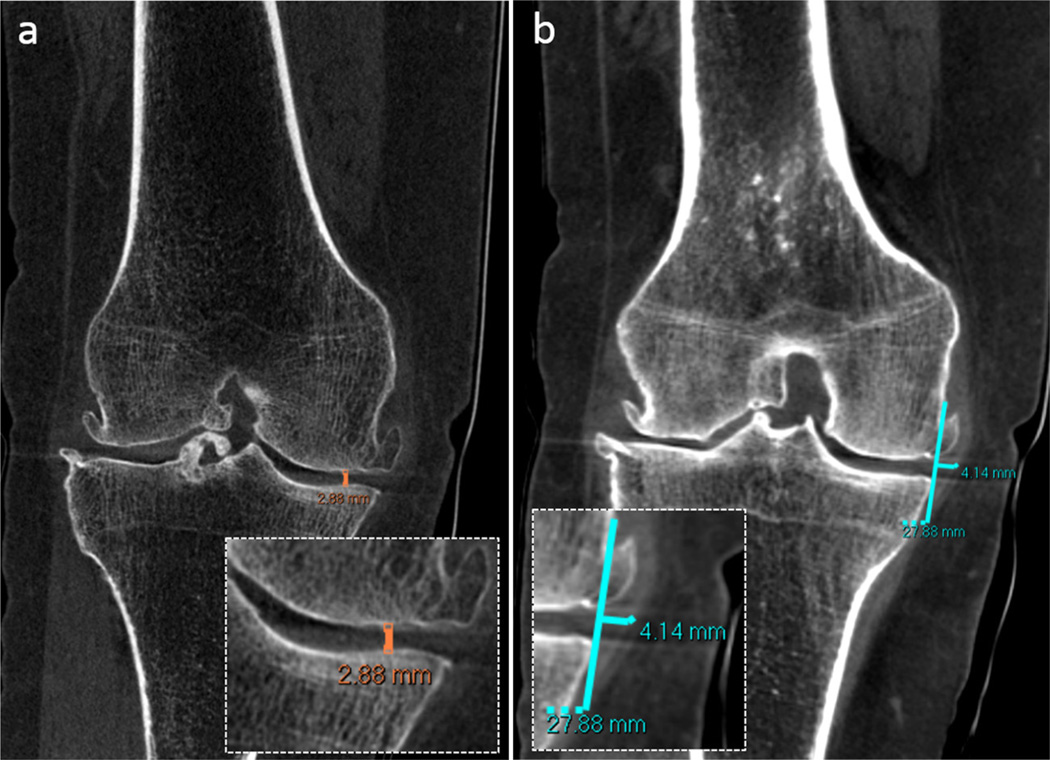
The CBCT images were read by 3 independent observers (two board certified, fellowship trained musculoskeletal radiologists and one postdoctoral radiology fellow with two years of experience interpreting musculoskeletal CT examinations). Images were read in a dark reading room using 3D visualization software (VuePACS, Carestream Health, Rochester, NY). As illustrated in Fig. 2, JSW was defined as the minimum distance between the articular surfaces of the medial femoral and tibial condyles [14] as measured in the coronal plane (Fig. 2a). Similarly, ME was measured as described by Miller et al. [15] as the extent of medial meniscus extruding beyond the medial margin of the tibial plateau and femoral condyle (Fig. 2b).
Fig. 2.
CBCT images with zoom insets showing measurement of (a) joint space width (JSW) and (b) meniscal extrusion (ME) on a coronal CBCT image displayed in bone window and soft tissue window, respectively.
2.4. Statistical analysis
Measurements of JSW and ME were compared between NWB and WB images using paired Wilcoxon signed-rank test. The p values were adjusted using a Bonferrroni correction (equal to 2, corresponding to the two outcome measures) to reduce the chances of Type I errors for multiple comparisons. Pearson correlation and linear regression tests were performed to assess the association and predictability of the measurements (JSW and ME) obtained during NWB examinations and the corresponding changes in measurements for WB images (described as the difference in corresponding measurements between the NWB and WB examinations).
To estimate interobserver agreement, Bland–Altman limits of agreement were calculated for each measurement (both JSW and ME) in the NWB images for both OA and control groups between each pair of observers. The mean of two observers’ measurements was used as the estimated reference measurement for each comparison. Pearson correlation between each pair of measurements was calculated to assess linear association between each pair of observers.
3. Result
A summary of measurements for JSW and ME is presented in Tables 1 and 2. Disease severity in the OA subjects was graded using radiographs for each subject acquired as part of the standard of care. Of the 17 symptomatic subjects with OA, 3 (17.6%) were severe, 12 (70.6%) were moderate, and 2 (11.8%) were mild in the severity of disease in the medial compartment according to the previously described grading system based on plain radiographs [3]. Additionally, OA severity was graded according to the lateral tibiofemoral compartment for all symptomatic subjects: 7 (41.1%) were normal, 8 (47.1%) were mild, and 2 (11.8%) were moderate.
Table 1.
Comparison of medial JSW and ME measured by three observers for OA and non-OA study participants in non-weight bearing (NWB) and weight bearing (WB) imaging setup.
| NWB (median, 95% CI) | WB (median, 95% CI) | p Value* | |
|---|---|---|---|
| OA | |||
| Medial Joint Space Width (JSW) | |||
| Obs 1 | 1.9 (1.3–2.5) mm | 1.3 (0.7–1.9) mm | p < 0.001 |
| Obs 2 | 2.3 (1.8–2.8) mm | 1.9 (1.2–2.6) mm | p < 0.001 |
| Obs 3 | 2.0 (1.6–2.4) mm | 1.4 (0.8–2.0) mm | p = 0.005 |
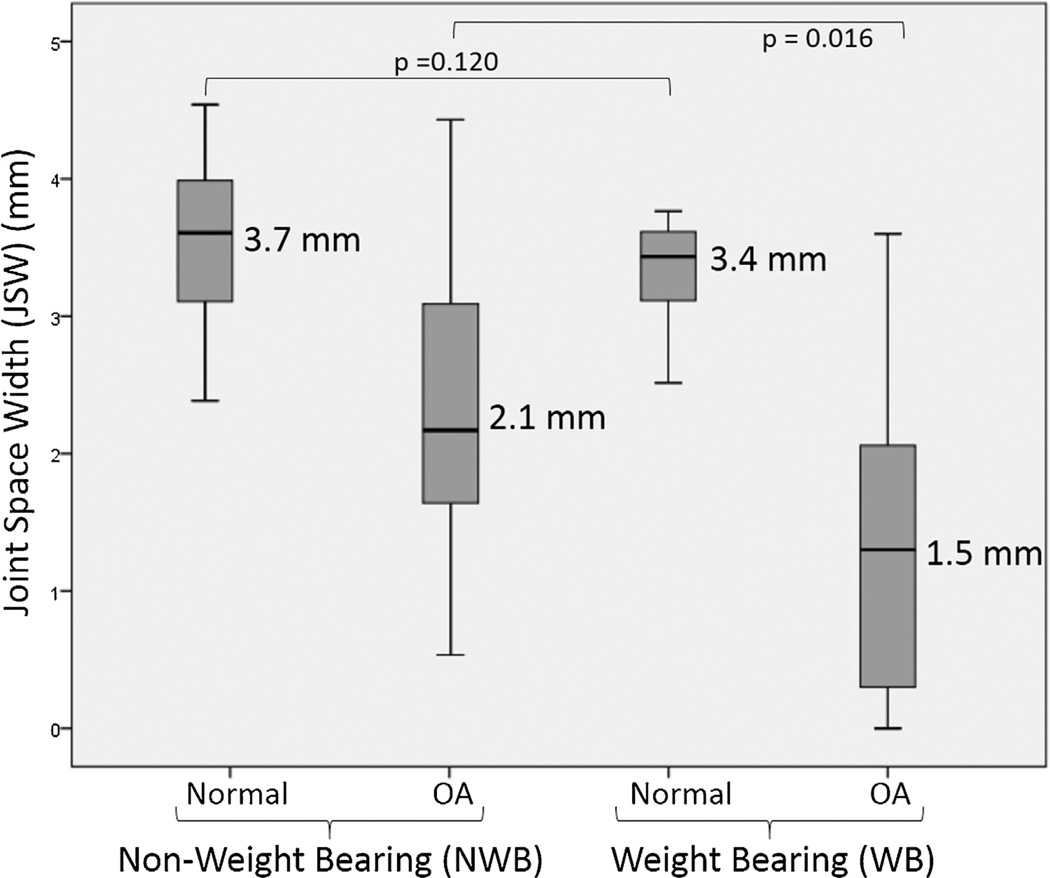
| Average | 2.1 mm | 1.5 mm | p = 0.016 |
| Meniscal Extrusion (ME) | |||
| Obs 1 | 6.2 (4.9–7.5) mm | 7.7 (6.3–9.2) mm | p = 0.001 |
| Obs 2 | 7.4 (5.9–8.9) mm | 8.1 (6.7–9.6) mm | p = 0.004 |
| Obs 3 | 7.1 (5.7–8.5) mm | 8.9 (7.6–1.0) mm | p = 0.001 |
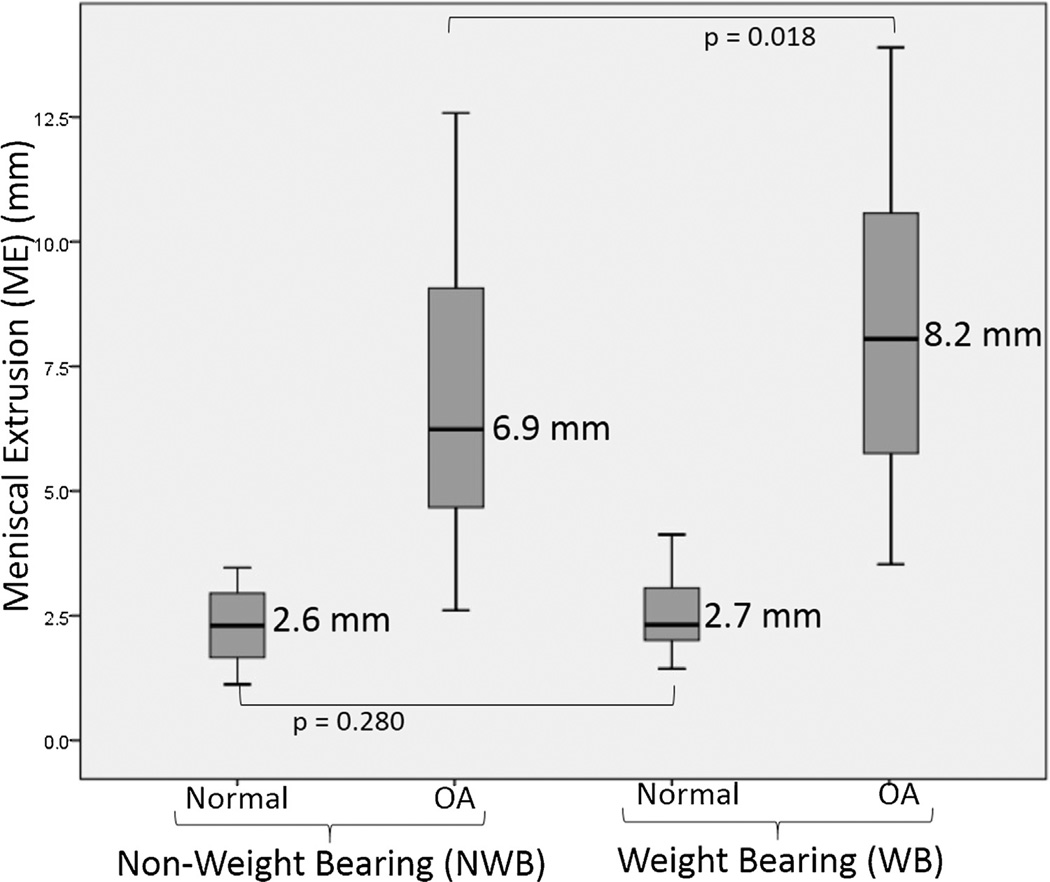
| Average | 6.9 mm | 8.2 mm | p = 0.018 |
| Non OA | |||
| Medial Joint Space Width (JSW) | |||
| Obs 1 | 3.4 (3.1–3.7) mm | 3.3 (3.1–3.5) mm | p = 0.261 |
| Obs 2 | 3.9 (3.6–4.2) mm | 3.6 (3.3–3.9) mm | p = 0.100 |
| Obs 3 | 3.7 (3.4–4.0) mm | 3.4 (3.1–3.7) mm | p = 0.160 |
| Average | 3.7 mm | 3.4 mm | p = 0.120 |
| Meniscal Extrusion (ME) | |||
| Obs 1 | 2.4 (2.0–2.7) mm | 2.4 (2.0–2.8) mm | p = 0.115 |
| Obs 2 | 2.8 (2.3–3.3) mm | 3.0 (2.3–3.6) mm | p = 0.085 |
| Obs 3 | 2.5 (2.2–2.9) mm | 2.7 (2.3–3.1) mm | p = 0.060 |
| Average | 2.6 mm | 2.7 mm | p = 0.280 |
NWB = non weight bearing; WB = weight bearing; JSW = joint space width; ME = meniscal extrusion; Obs = observer.
A p-value of (0.05/2 = 0.025; 2 measurements for each observer) was considered significant after Bonferroni correction for multiple tests.
Table 2.
Comparison of change in medial JSW and ME between OA and non-OA study participants.
| OA (median, 95% CI) | Non OA (median, 95% CI) | p Value | |
|---|---|---|---|
| Change in Medial JSW | |||
| Obs 1 | 0.4 (0.1–0.7) mm | 0.2 (0.1–0.3) mm | p = 0.015 |
| Obs 2 | 0.5 (0.2–0.8) mm | 0.4 (0.3–0.5) mm | p = 0.020 |
| Obs 3 | 0.6 (0.4–0.8) mm | 0.3 (0.2–0.5) mm | p = 0.001 |
| Average | 0.5 mm | 0.3 mm | p = 0.008 |
| Change in ME | |||
| Obs 1 | 1.0 (0.1–1.1) mm | 0.5 (0.2–0.8) mm | p = 0.005 |
| Obs 2 | 1.3 (0.9–1.7) mm | 0.6 (0.2–1.0) mm | p = 0.010 |
| Obs 3 | 1.1 (0.6–1.6) mm | 0.6 (0.4–0.8) mm | p = 0.020 |
| Average | 1.1 mm | 0.6 mm | p = 0.001 |
JSW = joint space width; Obs = observer.
As in Table 1, a Bonferroni correction factor of 2 is considered in relation to the two outcome measure, implying statistical significance in the measured difference for p < 0.025.
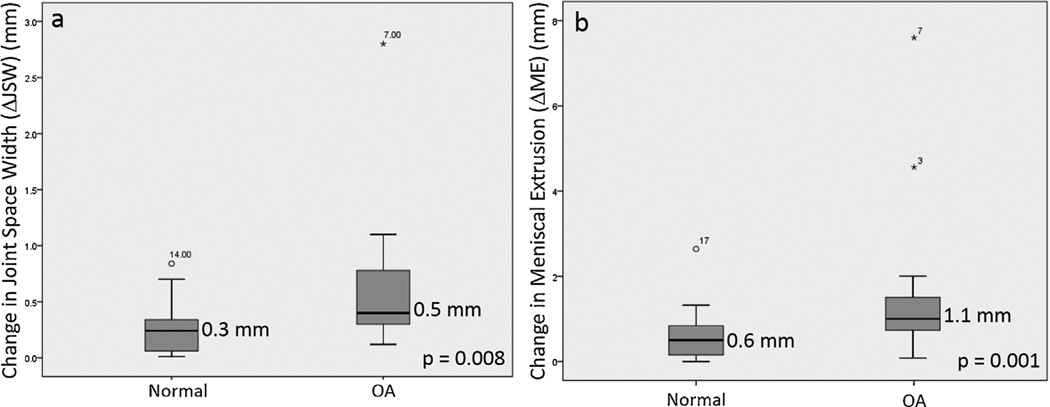
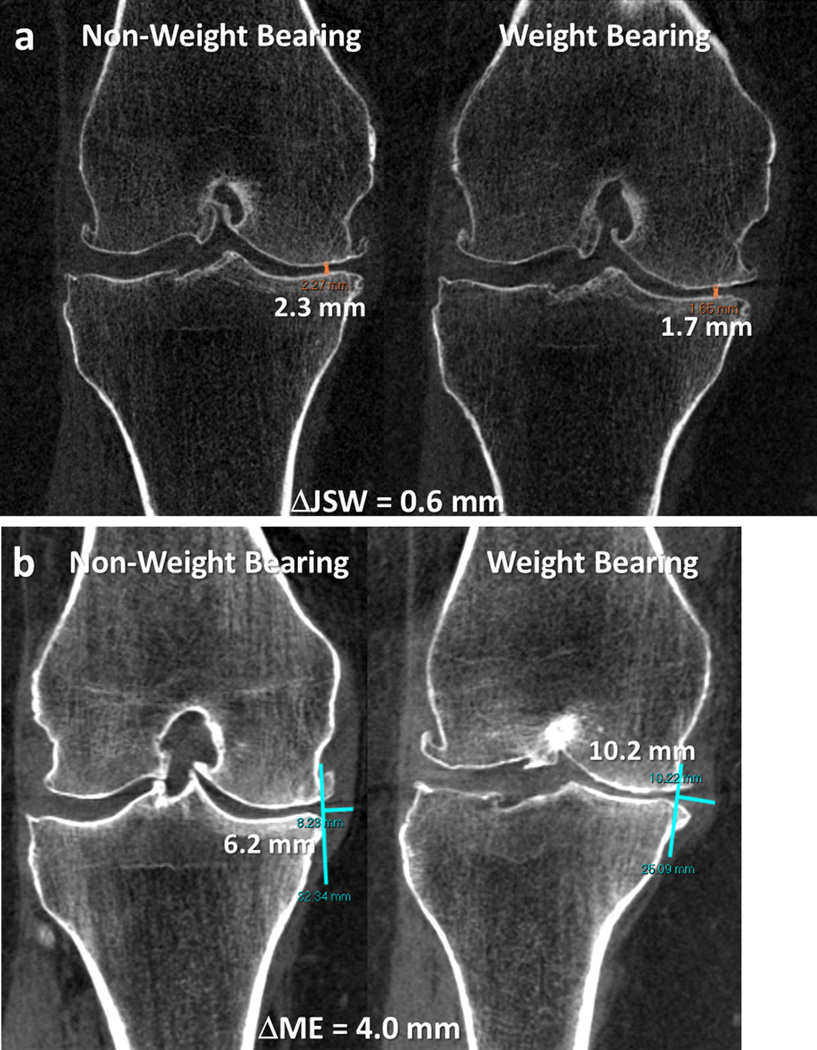
Fig. 3 summarizes the measurements of JSW between non OA (normal) and OA subjects imaged in NWB and WB configurations. Similarly, Fig. 4 summarizes the measurements of ME, and Fig. 5 the changes in these metrics (ΔJSW and ΔME, respectively). As detailed in Table 1, the measurements of JSW and ME for OA subjects were significantly different between the WB and NWB images for all readers and on average pooled across three readers (for JSW, p = 0.016; for ME, p = 0.018); however, there was no significant difference in corresponding measurements in asymptomatic control subjects (for JSW, p = 0.0120; for ME, p = 0.280). Additionally, as shown in Table 2, the corresponding changes in JSW and ME measured between WB and NWB configurations were larger in OA subjects compared to asymptomatic control subjects, for all readers. Fig. 6 depicts representative images for an OA subject, qualitatively illustrating the change in JSW and ME as visualized in coronal slices of the CBCT volume (bone and soft-tissue windows in Fig. 6a and b, respectively).
Fig. 3.
Joint space width (JSW) measured in normal and OA cases in NWB and WB configurations. Box and whisker plots show the median (horizontal bar), mean (values noted), interquartile range, and range with p-values computed according to an unpaired Student t-test (unequal variance).
Fig. 4.
Meniscal extrusion (ME) measured in normal and OA cases in NWB and WB configurations. Box and whisker plots show the median (horizontal bar), mean (values noted), interquartile range, and range with p-values computed according to an unpaired Student t-test (unequal variance).
Fig. 5.
Change in (a) joint space width (JSW) and (b) meniscal extrusion (ME) for normal and OA cases. Box and whisker plots show the median (horizontal bar), mean (values noted), interquartile range, and range. The p-values were computed from an unpaired Student t-test (unequal variance).
Fig. 6.
Representative case for a participant with OA in standing and sitting configurations, showing the (a) change in joint space width and the (b) change in meniscal extrusion.
Pearson’s correlation and linear regression suggests a weak association of changes in measurements (JSW and ME) between the NWB and WB images and corresponding measurements obtained from NWB examinations alone, as reflected in Table 3.
Table 3.
Correlation and linear regression for prediction of ME measurements obtained in NWB examination and changes in measurements between WB and NWB examination.
| Observers | Measurement | Pearson coefficient R2 | p-Value | Correlation co-efficient (95% CI) |
|---|---|---|---|---|
| Obs 1 | ME | 0.080 | 0.090 | 0.280 (− 0.05, 0.56) |
| JSW | <0.001 | 0.990 | 0.001 (− 0.33, 0.33) | |
| Obs 2 | ME | 0.020 | 0.460 | 0.120 (− 0.21, 0.44) |
| JSW | 0.002 | 0.760 | − 0.050 (− 0.38, 0.29) | |
| Obs 3 | ME | 0.230 | 0.300 | 0.380 (0.18, 0.70) |
| JSW | 0.002 | 0.820 | 0.030 (− 0.36, 0.30) |
JSW = joint space width; ME = meniscal extrusion.
3.1. Observer agreement
Interobserver agreement (Table 4) revealed that the Bland-Altman limits of agreement between each pair of observers were narrower for JSW measurements in comparison to ME measurements. Correlation coeffficients derived from comparisons between each pair of observations indicated high correlation for all measurements (r > 0.89).
Table 4.
Interobserver agreement for 3 observers using Bland–Altman for all metrics across OA and non OA study participants
| Observers | Measurement | Mean percentage difference between observers | 95% limits of agreement | Correlation coefficient |
|---|---|---|---|---|
| 1 versus 2 | JSW | − 20.2 (− 39.1, 7.5) | − 38.9, 18.5 | 0.90 (0.82. 0.95) |
| ME | − 5.8 (− 49.1, 38.7) | − 71.7, 60.0 | 0.94 (0.88, 0.97) | |
| 1 versus 3 | JSW | − 4.4 (−23.9, 19.2) | − 39.4, 30.5 | 0.92 (0.86, 0.96) |
| ME | − 5.5 (− 36.5, 24.1) | − 48.6, 37.7 | 0.98 (0.96, 0.99) | |
| 2 versus 3 | JSW | 16.3 (− 11.7, 29.9) | − 26.0, 48.5 | 0.89 (0.79, 0.94) |
| ME | 0.5 (− 40.1, 42.1) | − 63.4, 64.4 | 0.95 (0.91, 0.98) |
JSW = joint space width; NWB = non-weight bearing; WB = weight bearing.
4. Discussion
In this study, we demonstrated that the medial tibiofemoral JSW and ME change significantly in patients with OA between a WB and NWB setup using a CBCT extremity scanner. CBCT images provide image data with isotropic spatial resolution, which can be reconstructed in any plane in support of accurate measurements of JSW, as opposed to plain radiographs, where JSW measurements can be highly dependent on the positioning of the patient and X-ray beam [16]. Plain standing radiographs require precise positioning of the patient as well as the X-ray beam. For example, the Rosenberg view requires the patient stands at 45° knee flexion and the X-ray beam directed at 10° caudal from the horizontal plane. Since CBCT data is isotropic and volumetric, it is not strongly restricted by such careful positioning constraints, and images can reconstructed in any plane for accurate interpretation of the joint space. For the WB setup, the patients were imaged in a natural stance with weight evenly distributed between two legs. Future work could include purposely loading up to 100% of the subject’s weight onto the imaged leg, which may further accentuate abnormal changes in JSW and/or ME. In this study, observers determined the JSW using manual measurement of minimum distance between the articular surfaces of the medial femoral condyle and medial tibial plateau. In addition to determination of JSW changes in a WB exam using simple distance measurement, the availability of isotropic data enables more sophisticated analysis of contact pressure in WB versus NWB images [17,18] and other image-based morphometry that could augment diagnostic accuracy [19]. Such analysis may improve understanding of the pathophysiology and progression of disease in patients with medial tibiofemoral compartment OA.
In addition to JSW changes in a WB exam, the increase of ME in WB images suggests an inability of the meniscus to distribute stresses normally, which should be oriented centrifugally on the meniscus. Therefore, the presence and extent of ME during WB CBCT imaging may correlate with the inability of the meniscus to distribute the WB force, which may prove helpful in determining severity and further progression of OA. Using Pearson’s correlation and linear regression, we also demonstrated that there is weak association of the changes in ME between WB and NWB scans, and the ME measurements obtained from NWB scans alone. This finding suggests that ME measurements obtained from conventional NWB studies (such as conventional MDCT and MRI exams in which the patient lays on a support table) may not provide a reliable predictor of changes in extent of ME in the WB condition.
The measurements in this study demonstrated a high level of interobserver agreement in terms of the correlation between each pair of independent observers for both JSW and ME measurements. The limits of interobserver agreement were wider for ME measurements than for JSW measurements, likely due to variability in assessing the soft tissue meniscal margins in the ME measurement (as opposed to more conspicuous osseous cortical margins for the JSW measurements) [10].
This study had a variety of limitations. First, the changes in lateral tibiofemoral joint space were not evaluated, and more comprehensive analysis of morphology throughout the intra-articular space is the subject of other work. However, the prevalence of lateral tibiofemoral compartment OA is lower compared to medial tibiofemoral OA [20], which is also reflected in the OA severity grading scores in symptomatic subjects, where medial compartment exhibited more severe OA as compared to the lateral compartment; some symptomatic patients did not exhibit OA in the lateral compartment (n = 7/17, 41%). Second, MR images were not available for the subjects in this study, and future work will include MRI as a basis for diagnosis and grading of cartilage damage. Third, although the observers were not informed whether each case was a symptomatic or control case during interpretation, it was not possible to completely blind the observers for the presence of OA, since it was easy for expert readers to detect the imaging features of OA in the CBCT images. Another limitation was that due to the small sample size, the ME and JSW measurements were not analyzed in relation to the various gradings of OA obtained from initial plain radiography. Finally, the case and control population were not age matched and showed a significant difference in their gender and body-mass index (BMI). Therefore, one may posit that the lack of a significant difference between the WB and NWB measurements for the control group may be due to their lower BMI; however, data from a previous study demonstrated that differences in BMI, height, or weight do not significantly alter the JSW during weight bearing examination [21].
This study shows the value of WB volumetric imaging of the knee using CBCT to measure functional information on joint space narrowing along with soft tissue visualization for assessment of meniscal extrusion. The CBCT prototype for extremity imaging provided high spatial resolution of bone structures in combination with soft tissue visualization sufficient for assessment of the meniscus. Future work includes clinical studies to assess the value of CBCT in diagnosis and assessment of other pathologies, including trauma, fracture healing, and neoplasms.
Acknowledgments
Funding
This project was funded by Carestream Health Inc. and NIH Grant No.R21-AR-062293.
Abbreviations
- JSW
joint space width
- ME
meniscal extrusion
- MDCT
multidetector computed tomography
- CBCT
cone beam computed tomography
- WB
weight bearing
- NWB
non weight bearing
- CTDI
computed tomography dose index
- SSDE
size-specific dose estimates
Footnotes
Conflict of interest
None.
Contributor Information
Gaurav K. Thawait, Email: gthawai1@jhmi.edu.
Shadpour Demehri, Email: sdemehr1@jhmi.edu.
Abdullah AlMuhit, Email: almuhit@gmail.com.
Wojciech Zbijweski, Email: wzbijewski@jhu.du.
John Yorkston, Email: john.yorkston@carestream.com.
Filippo Del Grande, Email: filippo.delgrande@gmail.com.
Bashir Zikria, Email: bzikria2@jhmi.edu.
John A. Carrino, Email: carrinoj@hss.edu.
Jeffrey H. Siewerdsen, Email: jeff.siewerdsen@jhu.edu.
References
- 1.Lawrence RC, Helmick CG, Arnett FC, Deyo RA, Felson DT, Giannini EH, Heyse SP, Hirsch R, Hochberg MC, Hunder GG, Liang MH, Pillemer SR, Steen VD, Wolfe F. Estimates of the prevalence of arthritis and selected musculoskeletal disorders in the United States. Arthritis Rheum. 1998 May 5;41:778–799. doi: 10.1002/1529-0131(199805)41:5<778::AID-ART4>3.0.CO;2-V. [DOI] [PubMed] [Google Scholar]
- 2.Mazzuca SA, Brandt KD, Dieppe PA, Doherty M, Katz BP, Lane KA. Effect of alignment of the medial tibial plateau and X-ray beam on apparent progression of osteoarthritis in the standing anteroposterior knee radiograph. Arthritis Rheum. 2001 Aug 8;44:1786–1794. doi: 10.1002/1529-0131(200108)44:8<1786::AID-ART315>3.0.CO;2-L. [DOI] [PubMed] [Google Scholar]
- 3.Chan WP, Lang P, Stevens MP, Sack K, Majumdar S, Stoller DW, Basch C, Genant HK. Osteoarthritis of the knee: comparison of radiography, CT, and MR imaging to assess extent and severity. AJR Am. J. Roentgenol. 1991 Oct 4;157:799–806. doi: 10.2214/ajr.157.4.1892040. [DOI] [PubMed] [Google Scholar]
- 4.Adams JG, McAlindon T, Dimasi M, Carey J, Eustace S. Contribution of meniscal extrusion and cartilage loss to joint space narrowing in osteoarthritis. Clin. Radiol. 1999 Aug 8;54:502–506. doi: 10.1016/s0009-9260(99)90846-2. [DOI] [PubMed] [Google Scholar]
- 5.Gale DR, Chaisson CE, Totterman SM, Schwartz RK, Gale ME, Felson D. Meniscal subluxation: association with osteoarthritis and joint space narrowing. Osteoarthr. Cartil. 1999 Nov 6;7:526–532. doi: 10.1053/joca.1999.0256. [DOI] [PubMed] [Google Scholar]
- 6.Cohen SB, Short CP, O’Hagan T, Wu HT, Morrison WB, Zoga AC. The effect of meniscal tears on cartilage loss of the knee: findings on serial MRIs. Phys. Sportsmed. 2012 Sep 3;40:66–76. doi: 10.3810/psm.2012.09.1983. [DOI] [PubMed] [Google Scholar]
- 7.Zbijewski W, De Jean P, Prakash P, Ding Y, Stayman JW, Packard N, Senn R, Yang D, Yorkston J, Machado A, Carrino JA, Siewerdsen JH. A dedicated cone-beam CT system for musculoskeletal extremities imaging: design, optimization, and initial performance characterization. Med. Phys. 2011;38(8):4700–4713. doi: 10.1118/1.3611039. [DOI] [PMC free article] [PubMed] [Google Scholar]
- 8.Zbijewski W, Sisniega A, Stayman JW, Muhit A, Thawait G, Packard N, Senn R, Yang D, Yorkston J, Carrino JA, Siewerdsen JH. High-performance soft-tissue imaging in extremity cone-beam CT. Proc. Soc. Photo. Opt. Instrum. Eng. 2014 Mar 19;9033:903329. doi: 10.1117/12.2043463. [DOI] [PMC free article] [PubMed] [Google Scholar]
- 9.Carrino JA, Al Muhit A, Zbijewski W, Thawait GK, Stayman JW, Packard N, Senn R, Yang D, Foos DH, Yorkston J, Siewerdsen JH. Dedicated cone-beam CT system for extremity imaging. Radiology. 2014 Mar 3;270:816–824. doi: 10.1148/radiol.13130225. [DOI] [PMC free article] [PubMed] [Google Scholar]
- 10.Demehri S, Muhit A, Zbijewski W, Stayman JW, Yorkston J, Packard N, Senn R, Yang D, Foos D, Thawait GK, Fayad LM, Chhabra A, Carrino JA, Siewerdsen JH. Assessment of image quality in soft tissue and bone visualization tasks for a dedicated extremity cone-beam CT system. Eur. Radiol. 2015 Jun 6;25:1742–1751. doi: 10.1007/s00330-014-3546-6. [DOI] [PubMed] [Google Scholar]
- 11.Hirschmann A, Pfirrmann CW, Klammer G, Espinosa N, Buck FM. Upright cone CT of the hindfoot: comparison of the non-weight-bearing with the upright weight-bearing position. Eur. Radiol. 2014 Mar 3;24:553–558. doi: 10.1007/s00330-013-3028-2. [DOI] [PubMed] [Google Scholar]
- 12.Dixon RL, Anderson JA, Bakalyar DM, et al. Co Mprehensive Methodology for the Evaluation of Radiation Dose in X-ray Computed Tomography. AAPM Task Group Report. 2010;111 [Google Scholar]
- 13.Boone JM, Strauss KJ, Cody DD, et al. Size-Specific Dose Estimates (SSDE) in Pediatric and Adult Body CT Examinations. AAPM Task Group Report. 2011;204 [Google Scholar]
- 14.Hellio Le, Graverand MP, Mazzuca S, Duryea J, Brett A. Radiographic grading and measurement of joint space width in osteoarthritis. Rheum. Dis. Clin. N. Am. 2009 Aug 3;35:485–502. doi: 10.1016/j.rdc.2009.08.005. [DOI] [PubMed] [Google Scholar]
- 15.Miller TT, Staron RB, Feldman F, Cepel E. Meniscal position on routine MR imaging of the knee. Skeletal Radiol. 1997 Jul 7;26:424–427. doi: 10.1007/s002560050259. [DOI] [PubMed] [Google Scholar]
- 16.Brandt KD, Mazzuca SA, Conrozier T, Dacre JE, Peterfy CG, Provvedini D, Ravaud P, Taccoen A, Vignon E. Which is the best radiographic protocol for a clinical trial of a structure modifying drug in patients with knee osteoarthritis? J. Rheumatol. 2002 Jun 6;29:1308–1320. [PubMed] [Google Scholar]
- 17.Wilson W, van Donkelaar CC, van Rietbergen R, Huiskes R. The role of computational models in the search for the mechanical behavior and damage mechanisms of articular cartilage. Med. Eng. Phys. 2005 Dec 10;27:810–826. doi: 10.1016/j.medengphy.2005.03.004. [DOI] [PubMed] [Google Scholar]
- 18.Kazemi M, Dabiri Y, Li LP. Recent advances in computational mechanics of the human knee joint. Comput. Math. Methods Med. 2013;2013:718423. doi: 10.1155/2013/718423. [DOI] [PMC free article] [PubMed] [Google Scholar]
- 19.Cao Q, Thawait G, Gang GJ, Zbijewski W, Reigel T, Brown T, Corner B, Demehri S, Siewerdsen JH. Characterization of 3D joint space morphology using an electrostatic model (with application to osteoarthritis) Phys. Med. Biol. 2015 Jan 3;60:947–960. doi: 10.1088/0031-9155/60/3/947. [DOI] [PMC free article] [PubMed] [Google Scholar]
- 20.Ahlbäck S. Osteoarthrosis of the knee. A radiographic investigation. Acta Radiol. Diagn. (Stockh.) 1968;277(Supl):7–72. [PubMed] [Google Scholar]
- 21.Jacobsen S, Sonne-Holm S, Søballe K, Gebuhr P, Lund B. Factors influencing hip joint space in asymptomatic subjects. A survey of 4151 subjects of the Copenhagen City Heart Study: the Osteoarthritis Substudy. Osteoarthr. Cartil. 2004 Sep 9;12:698–703. doi: 10.1016/j.joca.2004.06.002. [DOI] [PubMed] [Google Scholar]


