

Abstract
Conventional microfluidic devices typically require highly precise pumps or pneumatic control systems, which add considerable cost and the requirement for power. These restrictions have limited the adoption of microfluidic technologies for point-of-care (POC) applications. Paper networks provide an extremely low-cost and pumpless alternative to conventional microfluidic devices by generating fluid tranport through capilarity. We revisit well-known microfluidic devices for hydrodynamic focusing, sized-based extraction of molecules from complex mixtures, micromixing, and dilution, and demonstrate that paper-based devices can replace their expensive conventional microfluidic counterparts.
Introduction
Since the 1990’s microfluidic systems have been heavily investigated as a platform for diagnostic devices due to their reduced reagent consumption and low cost compared to conventional laboratory systems.1–2 However, the early promise of this technology has yet to be fully realized.3–4 One factor limiting the widespread use of microfluidic technologies has been the size, complexity, and cost of pumps or pressure control systems needed to precisely move small volumes of fluids. Fabrication techniques for conventional microfluidic devices can also be complex and expensive, and few are economically viable for mass production. As a consequence, some of the most elegant “first generation” microfluidic devices have yet to achieve commercial utility.
In contrast, capillary flow diagnostic devices, commonly referred to as lateral flow strips, are single-use point-of-care (POC) tests that have been widely adopted in both the developing and developed worlds. Although these lateral flow tests are reliable and inexpensive, because they are essentially one dimensional (1D) devices, they are restricted to simple operations, exhibit limited sensitivity, and are typically non-quantitative.5 There is currently great interest in developing new paper-based diagnostics to address these shortcomings by going beyond the historical single-strip format.6–8 In some of these new paper-based devices, enhanced function and multiplexing has been achieved through coupling a single inlet to multiple reaction sites in both 2D9 and 3D10 constructs. Recently, our laboratory has demonstrated controlled transport of multiple fluid flows for sequential delivery of fluids in two-dimensional paper‡ networks (2DPNs) as a means to extend the capabilities and performance of lateral flow technologies while minimizing manufacturing costs. In contrast to previous paper designs, these 2DPNs combine multiple inlets to common detection regions, allowing “programmed” sequencing of chemical processes.11–12
Moving from conventional microfluidic systems to a paper-based regime would have several substantial advantages: greatly reduced cost, simplified fabrication, elimination of the requirement for pumps or power, and removal of problems associated with bubbles that plague microfluidic systems. Although the benefits of a paper-based system seem clear, it had yet to be determined whether simple paper-based systems could support the elegant functions of some of the initial microfluidic devices developed in our laboratory, such as the H-filter13–15 and T-sensor.15–18 A hallmark of these and other classic microfluidic devices is the exploitation of adjacent flow streams supported by low Reynolds number laminar flow.19 Microfluidic devices utilize the unique properties of laminar flow for applications exploiting microscale diffusion,20–21 biomolecular and cellular analyses,22–23 hydrodynamic focusing24 and dilution and/or gradient generation.25–27 We demonstrate translation of several conventional microfluidic devices that exploit adjacent flow streams onto 2DPNs. These inexpensive and simple paper-based devices perform hydrodynamic focusing, diffusion-based analyte extraction from a complex mixture, micromixing, and rapid (single- or serial) dilutions.
Theory
Steady-state fluid transport in 2DPNs
Laminar flow behavior occurs at low Reynolds numbers, which is commonly achieved for typical flow velocities when one dimension of a device is less than 1 mm.15,28 In paper devices, laminar flow is guaranteed since the relevant length scale is the membrane pore diameter (~1–10 μm) resulting in Reynolds numbers on the order of 10−3 at typcial lateral flow rates. Fluid flow in a porous medium, such as a nitrocellulose membrane, exhibits Darcy flow.29 Assuming the sample pad is an infinite source and the absorbent pad is an infinite sink, the flow in a fully wetted paper device is approximated by Darcy’s law:
where Q is volumetric flow rate, κ is the permeability of the paper, wh is the paper cross-sectional area of width w and height h, μ is the dynamic viscosity, and ΔP is the pressure drop occurring over the length, L, of the paper network.
Flow in conventional microfluidic ducts is commonly explained with an analogy to electrical circuits; the same approximation holds for paper devices, where the resistance to flow, , corresponds to electrical resistance, the volumetric flow rate, Q, to electrical current and the pressure drop, ΔP, to a drop in potential.30 A pressure drop occurs between the source pads and the absorbent pad, which is equivalent to electrical ground. The resistance to flow, R, is directly proportional to the length of the fluid path, L. The volumetric flow rate in paper devices can therefore be controlled by simply varying the fluid path length between the fluid source and sink. For this work we assume that the characteristics intrinsic to the membrane material κ, and h are constant, and that all fluids have the same viscosity, μ. The volumetric flow rate, Qi, can be calculated for each laminar flow stream, i, in a paper device by:
The flow behavior of a paper Y device can be mathematically described as a two component system that consists of two inlets and a common channel. The Darcy’s law equations for the inlets are:
Pressures are, by definition, equal at a node junction, which in this case, occurs at the junction of the two inlet streams. The pressure created by each source pad is also equal since the pad heights are the same, thus the pressure drop over each inlet arm (from source pad to the inlet junction) is the same, ΔP1 = ΔP2. The widths of each inlet arm are also equal (w1 = w2 ), therefore, the volumetric flow rates entering the inlet junction simplify to:
Assuming incompressible fluids, the volumetric flow rate of each sub-stream in the common channel is equal to the volumetric flow rate of the corresponding inlet. The volumetric flow rates for each sub-stream in the common channel are:
The lengths of the each segment in the common channel are equal (L3 = L4) and the pressure drop down the common channel is the same for both sub-streams since the pressure is equal for each sub-stream at the inlet junction and at atmospheric pressure in the absorbent pad. It follows that the ratio of volumetric flow rates within the common channel is equal to the ratio of the sub-stream widths within the common channel:
Therefore, Darcy’s law predicts that the ratio of the inlet arm lengths is equal to the ratio of sub-stream widths in the common channel:
Figure 1b shows three different fluid path length ratios and the resulting predictable widths of the sub-streams in the common channel. Experimental data strongly correlates with the Darcy prediction with a correlation coefficient of 0.94 as shown in Figure 1c.
Fig 1.

Demonstration of flow control and diffusion in a paper Y device. (a) A schematic of the paper Y device. The interface of the two sub-streams in the common channel is indicated by the dashed line for the case when L1 < L2. (b) An image series of a single paper Y device showing the effect of varying the fluid path lengths. Inlets contain tartrazine (left) and erioglaucine (right). (c) Plot of the ratio of inlet arm length (L2 / L1) to the ratio of the stream widths (w3 / w4) as measured at 0.5 cm from the inlet junction. We estimate the error for the measurement of width, w, to be approximately 0.05 cm due to the diffusion interface. The error for the measurement of L was estimated to be approximately 0.2 cm due to uncertainty of the leading edge of the fluid at the source. (d) A paper Y device was loaded with DI H2O on the left and erioglaucine on the right. At a distance of 2 cm from the inlet junction, the optical absorption by erioglaucine was measured in the red channel of an RGB image to determine a diffusion profile where the intensity was normalized by dividing by the maximum intensity. (e) Plot of the diffusion profile of erioglaucine for n = 3 paper devices. An image of a single device is shown in (d).
Materials and Methods
Device construction and assembly
Paper devices were cut from 12 μm pore diameter nitrocellulose membranes (AE 100 or FF 125/100, Whatman, Piscataway, NJ) using a CO2 laser (Universal Laser Systems, Scottsdale, AZ) as described previously.31 All devices were clamped in a poly(methyl methacrylate) (PMMA) jig. Source pads (Millipore, Billerica, MA, or Ahlstrom, Bellingham, MA) were used to apply solutions to the inlet arms. The same materials were used for the single absorbent pad placed at the distal end of the common channel. To extend the period of continuous flow, small wells were filled with the solutions, and pieces of Kimwipe (Kimberly Clark, Roswell, GA) or pad material were used as wicks between the reservoir wells and the source pads. When source pad material was used to connect to the reservoirs, a PMMA weight was placed over both pads to assure consistent contact between the source pads and the paper device. The solutions used to visualize flow within the 2DPNs were 800 μM erioglaucine (blue dye), 1870 μM tartrazine (yellow dye) (Sigma-Aldrich, St. Louis, MO) or deionized water (DI H2O). To reduce the confounding effects of evaporation, all experiments were enclosed within a small humidity chamber made from a Petri dish (Corning, Corning, NY) containing a Kimwipe wetted with DI H2O. A fully assembled device is shown in Supplementary Information Figure S1.
Image analysis
Images for quantitative analysis were captured with a web camera (Logitech, Fremont, CA) and analyzed with ImageJ.32 All other images were acquired with a Sony cyber-shot digital camera. Images were adjusted for brightness and contrast for display purposes.
Size-based separation and extraction in 2DPNs
Paper devices were cut and blocked by soaking in 0.5% casein + 0.05% Tween-20 for 1 hour and allowed to dry at room temperature. Molecules for the separation demonstration were Naphthol blue black bovine serum albumin, or Blue-BSA, (Sigma-Aldrich, St. Louis, MO, MWt ~66382 Da) and tartrazine (Sigma-Aldrich, St. Louis, MO, MWt = 534.3 g mol−1), specifically chosen for their differences in diffusivity. 200 μl of the Blue-BSA + tartrazine solution was added to the left source pad and the right source pad contained 200 μl DI H2O as a collection buffer. The device was allowed to flow until the solutions reached the absorbent pad at the distal end of the device. Regions of interest were cut from the distal end of paper device (left and right sides). To elute the molecular species at the distal end, the paper segments were placed in 100 μl DI H2O and vortexed. The absorbances of the fluids thus obtained were measured at 590 and 422 nm for Blue-BSA and tartrazine, respectively, on a diode array spectrophotometer (Hewlett Packard model number 8452A, Palo Alto, CA). A standard curve was generated for both Blue-BSA and tartrazine and used to calculate concentrations of each species in the extracts. The enrichment factor was determined by dividing the molar ratio for each species (tartrazine to Blue-BSA) in the eluate of the purified extract (right eluate) by the molar ratio of the input solution.
Results and discussion
The 2DPN Y device
Classic microfluidic devices that exploit transverse diffusion across adjacent flow streams are Y (or T) structures combining multiple inlet streams into a common channel. These geometries have been used to study interdiffusion of one or multiple species, to evaluate transport processes, and to sense analytes ranging from pH to immunoassays targets.16–18,20–21 Performing such activities requires a very stable diffusion interface, which, in turn, requires at least two extremely stable pumps. The paper Y device in Figure 1 demonstrates a pumpless alternative to the conventional microfluidic Y device. Once the interface is established, its position is stable as long as there is sufficient source fluid in the source pad and ample unfilled capacity in the absorbent pad to continue flow in the device. Figure 1b depicts the interdiffusion of erioglaucine (blue) and tartrazine (yellow) in a 2DPN. The interdiffusion zone between the two parallel laminae is demarcated by a green region illustrating intermixing of the blue and yellow dye. Diffusion distance in the 2DPN Y device increases with contact time resulting in a broadening of the diffusion profile down the length of the common channel. The diffusion of the small molecule erioglaucine into a stream of DI H2O is depicted in Figure 1d; the resulting diffusion profile is plotted in 1e. Diffusion in porous media has been shown to follow bulk diffusion as described by the Stokes-Einstein equation, when the molecule-to-pore size ratio, λ, defined as λ = rs/rp is small;33 rp is the membrane pore radius, and rs is the radius of the diffusing species. For these demonstrations λ is negligible for molecules with a radius smaller than ~20 nm. Future work will investigate diffusion behavior under flow in 2DPNs, since in duct flow additional secondary diffusional effects proved to be significant.21,34
Hydrodynamic focusing in 2DPNs
Hydrodynamic focusing occurs when multiple flows with substantially different flow rates come into contact. The most frequently employed configuration for focusing is a three inlet device that allows rapid mixing of the content of a small “core” stream with a bulk “sheath” flow. The center flow stream is “pinched” between two sheath streams, thereby shrinking the core stream width; this doubles the area of the diffusion interface and greatly reduces the diffusion distances. Focusing also accelerates the narrowed core stream, allowing for study of rapid (bio)chemical kinetics.15 In conventional microfluidic devices, hydrodynamic focusing is achieved through the precise control of flow rates by multiple external pumps and/or pressure sources.35
A three inlet 2DPN is a simple and economical alternative device for hydrodynamic focusing. Focusing can be controlled in the 2DPN by reducing the fluid path length, L, between the “sheath” source pads and the inlet junction of the device. Center stream focusing occurs when the flow resistance is greater for the center inlet than for the outer sheath inlets. Figure 2 shows the effect of varying the sheath inlet arm lengths. Diffusional broadening of the core in Figure 2 is apparent further downstream, indicative of an increase in transverse diffusion versus distance occurring with contact time. Note that the broadening of the center stream that occurs with distance downstream is driven by diffusional mixing, but that the net volumetric flow rate in the common channel is also increasing as the position of the sheath source pads decreases. Quantitative measurements in this and other formats require the knowledge of both local and mean flow rates within the paper device; this method is described elsewhere.36
Fig 2.

Demonstration of hydrodynamic focusing by varying inlet arm lengths in a three channel paper Y device. (a) A three channel paper Y device is shown with sample pads loaded with erioglaucine and tartrazine. 1, 2, & 3 show varying inlet arm lengths by altering source pad position. (b) Enlargement of the focusing region in images a2 & a3. Note that the volumetric flow in the common channel must increase as the “sheath” pads move closer to the distal end of the device, so not only the relative velocities, but also the absolute flow rates are changing.
Size-based separation and extraction in a 2DPN H-filter
Previously our laboratory developed a pump-driven microfluidic device called the H-filter, which allowed separation of small analytes from complex samples.13,37 Separation of two species and subsequent extraction of the faster diffusing species can be achieved when one inlet contains a mixed sample and the other a collection buffer. The efficiency of the extraction depends on the diffusion coefficient of each species, the contact time, and the dimensions of the common channel; no intervening membrane is required as long as the Reynolds number in the device is low. The practicaly utility of the H-fitler was limited by the requirement for pumps to precisely controll flow and was generally restricted to continuous use, as establishing stable flow took a long time.
Conversion of the H-filter to a paper format exploits the inherent compatibility of the structure for efficient batch processing of small sample volumes. The 2DPN H-filter design shown here consists of a modified Y device with a geometry that has been optimized to broaden the interdiffusion zone (Figure 3). Extraction of a desired species is implemented by simply cutting a region of interest from the device after flow has stopped. Figure 3a demonstrates separation of two species, naphthol blue black bovine serum albumin (Blue-BSA, DBSA = 6.3e−11 m2s−1)38 and tartrazine (Dtartrazine = 6.55e−10 m2s−1).39 Blue-BSA is larger than tartrazine and does not diffuse across the full width of the 2DPN H-filter while tartrazine appears to fully distribute across the width of the device.‡ The enrichment factor of the small analyte was determined by calculating the molar ratio of tartrazine to Blue-BSA in the extract (right) compared to the input solution. In this 2DPN H-filter design, tartrazine was enriched ~60-fold over Blue-BSA.
Fig 3.
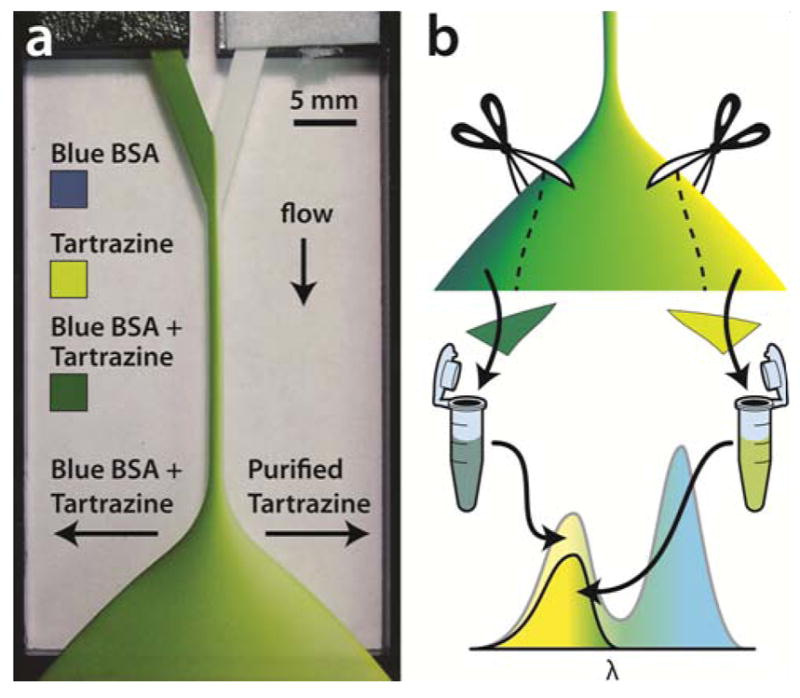
Size based separation in a paper H-filter. (a) An image of a paper H-filter with a mixture of naphthol blue black BSA and tartrazine in the left sample pad and DI H2O in the right. The device fills in less than 15 minutes. (b) Schematic of the extraction process. Molar ratios of tartrazine / Blue-BSA of the right extraction were compared to the molar ratio of the input solution. Tartrazine was enriched in the right extract by ~64-fold in n = 2 devices. (1: 50 tartrazine to Blue-BSA in the input, 1: 55 in the left eluate, 1: 3176 in the right eluate)
The 2DPN H-filter could be used as a stand-alone device for extraction of small molecules and a host of other applications. As with the conventional H-filter, the volumetric capacity of the device scales with depth allowing the 2DPN H-filter to be tailored to a desired batch volume. The outlet geometry of the device could also be re-designed to allow splitting off of specific desired fractions, or the device could be integrated as a component in a more complex 2DPN system. The 2DPN H-filter could also be used as a fast and inexpensive alternative separation technique to replace slow dialysis or expensive centrifugation. Future work will investigate new device geometries for optimal purification and extraction.
Mixing in paper networks: The flat Y-mixer
Mixing is required for a variety of chemical operations, and the difficulty of mixing laminar flow streams presents one of the classic challenges in microfluidics. Microfluidic micromixing strategies range from chaotic advection to active fluid disturbance, however, these processes add complexity and cost.19 We demonstrate micromixing in a paper Y device called a flat Y-mixer by employing concepts similar to that of the flat H-filter previously developed in our group.13,15 Note that the paper Y device in Figure 1 is very useful for visualizing the movement of diffusing species, but is inefficient as a rapid mixer because of the small contact area between flow streams and the long distance required for diffusion of fluid at the edges of the device. The flat Y-mixer design achieves rapid mixing by stacking thin flow streams to maximize the area of the diffusion interface and reduce diffusion distances (Figure 4). For example, for two 100 μm thick, 2 cm long × 0.5 cm wide porous strips, the cross-sectional area of the diffusion interface is 50-fold larger if they are stacked rather than positioned side-by-side, as in the conventional Y-mixer in Figure 1. More importantly, stacking of the two 100 μm porous layers reduces the maximum diffusion distance from 1 cm to 200 μm, reducing the time for diffusion equilibrium by approximately 2500-fold. The combined mixing time enhancement is, therefore, a factor of 125,000. In the flat Y-mixer shown here, full mixing is achieved after ~2.5 mm of paper layer contact. For a measured flow velocity of 0.01 cm s−1, this corresponds to a mixing time of 2.5 seconds.
Fig 4.

Demonstration of mixing in a paper flat Y-mixer. (a) A schematic of the flat Y-mixer is shown to illustrate the 3-dimensional structure of the paper construct. (b) A flat Y-mixer in operation. Inlets contain erioglaucine (left) and tartrazine (right). The interdiffusion of the two dyes results in the green color, which is the result of mixing, not just a superposition of the two colors (see supplemental data, Figure S2). The clear Mylar spacer is outlined by a dashed grey line.
Note that the flat Y-mixer requires that an impermeable spacer be placed between the two membranes (as shown in Figure 3b). This ensures the membrane layers come into contact only after the flow lines have reoriented to be parallel to the long axis of the common channel. Without the spacer, the flow pattern that develops is similar to that of the standard Y-mixer. Also note that this device consists of two paper layers and an impermeable spacer, so it is not, strictly speaking, a 2DPN.
Dilutions in a paper network
As we have shown with the 2DPN Y device, the volumetric flow rates for each inlet do not have to be equal, thus the flat Y-mixer design can be modified to perform rapid sample dilutions. A schematic and images of a one-step paper diluter are shown in Figure 5. Using Darcy’s law as a guide, the volumetric flow rate, Q, can be set to achieve a desired dilution by adjusting the length of dilution inlet arm (L2 as shown in Figure 5a). As the length of the dilution arm increases, the volumetric flow rate of the diluent decreases leading to a reduced dilution factor in the common channel downstream. Figure 5b depicts two dilution arm lengths and the dilution of an input solution of erioglaucine. We have empirically determined the relationship between the length of the dilution arm and the resulting dilution factor (Figure 5c).
Fig 5.

Demonstration of a paper diluter. (a) Schematic of a paper diluter. (b) Image series of a diluter. The top inlet stream contains 800 μM erioglaucine, while the right inlet acts as the diluent (DI H2O). Two different diluent arm lengths (L2) are shown: 2.0 and 3.4 cm. (c) Plot of the final concentrations obtained by varying the length of L2. Concentrations were calculated from a standard curve of erioglaucine in paper.
The mathematical prediction of dilution effect versus arm length deviates from the data. The source of this discrepancy is under investigation. One potential contributor could be variations in the volumetric flow rate in the dilution inlet arm due to the 90° turn and/or contact between the paper and the supporting structures of the device. Future devices can be redesigned to reduce or eliminate these effects. Despite this, the demonstrated dilution device is a tool that can be tuned to obtain a desired dilution. Serial dilutions are also possible by adding multiple dilution arms (see Supplementary Information, Figure S3), allowing achievement of a wide range of final concentrations with the ability to capture and use all of the intermediate concentrations during the dilution process, all without a single pump or pipetting step.
Conclusions
Many of the potentially useful microfluidic devices developed over a decade ago have remained laboratory curiosities because they are expensive to use and are not particularly reliable in the absence of the most precise fluidic support equipment. Herein we have shown that many classic laminar-flow-based devices and processes previously developed in a microfluidic duct-based format can be recreated in simple and low-cost paper networks. Adjacent fluid flows in paper networks can be used for hydrodynamic focusing, size-based separations, mixing of reagents for analysis or synthesis, and tunable dilution. These paper networks are ideally suited for POC diagnostic applications in low resource settings due to the low cost of materials, compatibility with dry reagent storage, ease of disposal and lack of complex pumping/pressure systems or power sources. They provide inexpensive and easy access to a range of novel practical fluidic tools for the chemistry/biochemistry laboratory and have the potential to supplant conventional technologies. Many unresolved questions remain such as if paper devices can function as reproducibly and quantitatively as their conventional microfluidic counterparts. Ongoing work in this laboratory is aimed to further the potential of this technology and to make it broadly available.
Supplementary Material
Acknowledgments
This work was supported by funding from the Department of Bioengineering, NIH/NIBIB through a Challenge Grant (1RC1EB010593), and a fellowship to J. Osborn from the National Science Foundation. We also would like to thank Dr. Kristen Helton, Katherine McKenzie, and Lauren Shepherd for their valuable discussions.
Footnotes
Electronic Supplementary Information (ESI) available: See DOI: 10.1039/b000000x/
Note that we use a broad definition of the term “paper” that includes related porous materials.
The complete distribution of tartrazine into the collection buffer stream would result in a 2-fold dilution of the tartrazine dye as compared to the input solution.
References
- 1.Whitesides GM. The origins and the future of microfluidics. Nature. 2006;442:368–373. doi: 10.1038/Nature05058. [DOI] [PubMed] [Google Scholar]
- 2.Yager P, et al. Microfluidic diagnostic technologies for global public health. Nature. 2006;442:412–418. doi: 10.1038/nature05064. [DOI] [PubMed] [Google Scholar]
- 3.Blow N. Microfluidics: the great divide. Nature Methods. 2009;6:683–686. [Google Scholar]
- 4.Hawkins KRaW, Bernhard H. In: SPIE, Microfluidics, Bio MEMS, and Medical Microsystems VIII. Becker Holger, Wang Wanjun., editors. [Google Scholar]
- 5.Gordon J, Michel G. A database of publications on lateral flow immunoassays and review of limits of detection. Clinical Chemistry. 2008;54:A204–A204. doi: 10.1373/clinchem.2007.102491. [DOI] [PubMed] [Google Scholar]
- 6.Fenton EM, Mascarenas MR, Lopez GP, Sibbett SS. Multiplex Lateral-Flow Test Strips Fabricated by Two-Dimensional Shaping. Acs Applied Materials & Interfaces. 2009;1:124–129. doi: 10.1021/Am800043z. [DOI] [PubMed] [Google Scholar]
- 7.Martinez AW, Phillips ST, Butte MJ, Whitesides GM. Patterned paper as a platform for inexpensive, low-volume, portable bioassays. Angewandte Chemie-International Edition. 2007;46:1318–1320. doi: 10.1002/anie.200603817. [DOI] [PMC free article] [PubMed] [Google Scholar]
- 8.Martinez AW, Phillips ST, Wiley BJ, Gupta M, Whitesides GM. FLASH: A rapid method for prototyping paper-based microfluidic devices. Lab on a Chip. 2008;8:2146–2150. doi: 10.1039/b811135a. [DOI] [PMC free article] [PubMed] [Google Scholar]
- 9.Carrilho E, Phillips ST, Vella SJ, Martinez AW, Whitesides GM. Paper Microzone Plates. Analytical Chemistry. 2009;81:5990–5998. doi: 10.1021/ac900847g. [DOI] [PubMed] [Google Scholar]
- 10.Martinez AW, Phillips ST, Whitesides GM. Three-dimensional microfluidic devices fabricated in layered paper and tape. Proceedings of the National Academy of Sciences of the United States of America. 2008;105:19606–19611. doi: 10.1073/pnas.0810903105. [DOI] [PMC free article] [PubMed] [Google Scholar]
- 11.Fu E, Lutz Barry, Kauffman Peter, Yager Paul. Controlled Reagent Transport in Disposable 2D Paper Networks. Lab on a Chip. 2010:918–920. doi: 10.1039/b919614e. [DOI] [PMC free article] [PubMed] [Google Scholar]
- 12.Fu E, Kauffman Peter, Lutz Barry, Yager Paul. Chemical signal amplification in two-dimensional paper networks. Sensors and Actuators B. 2010 doi: 10.1016/j.snb.2010.06.024. in press. [DOI] [PMC free article] [PubMed] [Google Scholar]
- 13.Brody JP, Yager P. Diffusion-based extraction in a microfabricated device. Sensors and Actuators a-Physical. 1997;58:13–18. [Google Scholar]
- 14.Helton KL, Nelson KE, Fu E, Yager P. Conditioning saliva for use in a microfluidic biosensor. Lab on a Chip. 2008;8:1847–1851. doi: 10.1039/b811150b. [DOI] [PubMed] [Google Scholar]
- 15.Brody JP, Yager P, Goldstein RE, Austin RH. Biotechnology at low Reynolds numbers. Biophysical Journal. 1996;71:3430–3441. doi: 10.1016/S0006-3495(96)79538-3. [DOI] [PMC free article] [PubMed] [Google Scholar]
- 16.Hatch A, Garcia E, Yager P. Diffusion-based analysis of molecular interactions in microfluidic devices. Proceedings of the Ieee. 2004;92:126–139. [Google Scholar]
- 17.Hatch A, et al. A rapid diffusion immunoassay in a T-sensor. Nature Biotechnology. 2001;19:461–465. doi: 10.1038/88135. [DOI] [PubMed] [Google Scholar]
- 18.Weigl BH, Kriebel J, Mayes KJ, Bui T, Yager P. Whole blood diagnostics in standard gravity and microgravity by use of microfluidic structures (T-sensors) Mikrochimica Acta. 1999;131:75–83. [Google Scholar]
- 19.Nguyen NT, Wu ZG. Micromixers - a review. Journal of Micromechanics and Microengineering. 2005;15:R1–R16. [Google Scholar]
- 20.Kamholz AE, Schilling EA, Yager P. Optical measurement of transverse molecular diffusion in a microchannel. Biophysical Journal. 2001;80:1967–1972. doi: 10.1016/S0006-3495(01)76166-8. [DOI] [PMC free article] [PubMed] [Google Scholar]
- 21.Kamholz AE, Yager P. Theoretical analysis of molecular diffusion in pressure-driven laminar flow in microfluidic channels. Biophysical Journal. 2001;80:155–160. doi: 10.1016/S0006-3495(01)76003-1. [DOI] [PMC free article] [PubMed] [Google Scholar]
- 22.Beebe DJ, Mensing GA, Walker GM. Physics and applications of microfluidics in biology. Annual Review of Biomedical Engineering. 2002;4:261–286. doi: 10.1146/annurev.bioeng.4.112601.125916. [DOI] [PubMed] [Google Scholar]
- 23.Khademhosseini A, Langer R, Borenstein J, Vacanti JP. Microscale technologies for tissue engineering and biology. Proceedings of the National Academy of Sciences of the United States of America. 2006;103:2480–2487. doi: 10.1073/pnas.0507681102. [DOI] [PMC free article] [PubMed] [Google Scholar]
- 24.Knight JB, Vishwanath A, Brody JP, Austin RH. Hydrodynamic focusing on a silicon chip: Mixing nanoliters in microseconds. Physical Review Letters. 1998;80:3863–3866. [Google Scholar]
- 25.Holden MA, Kumar S, Castellana ET, Beskok A, Cremer PS. Generating fixed concentration arrays in a microfluidic device. Sensors and Actuators B-Chemical. 2003;92:199–207. doi: 10.1016/s0925-4005(03)00129-1. [DOI] [Google Scholar]
- 26.Jeon NL, et al. Generation of solution and surface gradients using microfluidic systems. Langmuir. 2000;16:8311–8316. [Google Scholar]
- 27.Takayama S, et al. Selective chemical treatment of cellular microdomains using multiple laminar streams. Chemistry & Biology. 2003;10:123–130. doi: 10.1016/s1074-5521(03)00019-x. [DOI] [PubMed] [Google Scholar]
- 28.Purcell EM. Life at Low Reynolds-Number. American Journal of Physics. 1977;45:3–11. [Google Scholar]
- 29.Bird RB, Stewart Warren E, Lightfoot Edwin N. Transport Phenomena. 2. Vol. 148. John Wiley & Sons, Inc; 2002. [Google Scholar]
- 30.Fu E, Ramsey SA, Kauffman P, Lutz B, Yager P. Transport in two-dimensional paper networks. Microfluidics and Nanofluidics. 2010 doi: 10.1007/s10404-010-0643-y. in press. [DOI] [PMC free article] [PubMed] [Google Scholar]
- 31.Spicar-Mihalic P, Stevens D, Yager P. MicroTAS Proceedings. :667–669. [Google Scholar]
- 32.Rasband WS. ImageJ. 1997–2010 < http://rsb.info.nih.gov/ij/>.
- 33.Davidson MG, Deen WM. Hindered Diffusion of Water-Soluble Macromolecules in Membranes. Macromolecules. 1988;21:3474–3481. [Google Scholar]
- 34.Kamholz AE, Yager P. Molecular diffusive scaling laws in pressure-driven microfluidic channels: deviation from one-dimensional Einstein approximations. Sens Actuator B-Chem. 2002;82:117–121. [Google Scholar]
- 35.Lee GB, Chang CC, Huang SB, Yang RJ. The hydrodynamic focusing effect inside rectangular microchannels. Journal of Micromechanics and Microengineering. 2006;16:1024–1032. doi: 10.1088/0960-1317/16/5/020. [DOI] [Google Scholar]
- 36.Kauffman P, Fu Elain, Lutz Barry, Yager Paul. Visualization and Measurement of Flow in Two-Dimensional Paper Networks. Lab on a Chip. 2010 doi: 10.1039/c004766j. in presss. [DOI] [PMC free article] [PubMed] [Google Scholar]
- 37.Brody JP, Osborn TD, Forster FK, Yager P. A planar microfabricated fluid. Sensors and Actuators a-Physical. 1996;54:704–708. [Google Scholar]
- 38.Schmitz KS, Lu M. Effect of Titration Charge on the Diffusion of Bovine Serum-Albumin. Proceedings of the National Academy of Sciences of the United States of America-Biological Sciences. 1983;80:425–429. doi: 10.1073/pnas.80.2.425. [DOI] [PMC free article] [PubMed] [Google Scholar]
- 39.Abad AC, SC, Torregrosa JI, Navarro-Laboulais J. 15th International Congress of Chemical and Process Engineering (CHISA 2002). [Google Scholar]
Associated Data
This section collects any data citations, data availability statements, or supplementary materials included in this article.